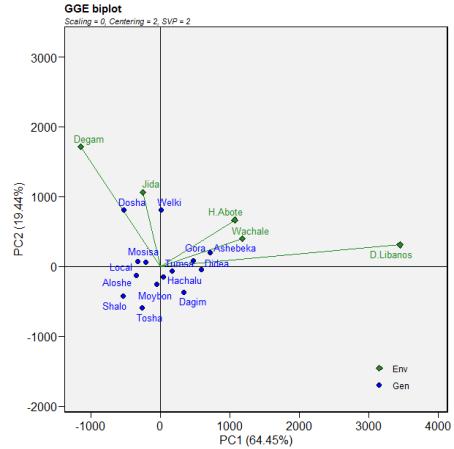
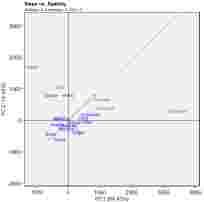
Field experiment was conducted at Degam, H/Abote, D/Libanos, Jida and Wachale districts of North Shewa Zone, Oromia region, Central Ethiopia with the objectives of evaluating adaptable and best yield performing improved Faba bean varieties for further demonstration and scaling up during the main cropping season of 2020, 2021 and 2022. The experiment was conducted using randomized complete block design (RCBD) with three replications. In the experiment, thirteen improved faba bean varieties and one local control were used to evaluate their performance. Parameters like seed yield (qt/ha), 1000 seed weight in gram, number of pod per plant, number of seed per pod, plant height (cm) were measured to assess the actual field performances of different faba bean varieties. The data were analyzed by R software. Grain yield and most of yield components were significantly affected by main effect of variety, environment and interaction of variety and environment. The results revealed that there were significant (P < 0.01) variations between the varieties for yield. Higher yield was recorded on Welki and Ashebeka varieties while low yield was recorded from Tosha and Shalo. In addition the stability analysis indicated that as the mean of grain yield is more stable across locations as compared to other variety. Also, in this study it was found that there is 24.5 % and 19.1% increment of yield using of Welki and Ashebeka variety respectively as compared to local variety at the study area. Therefore, farmers located at the study area are recommended to use those varieties to increase faba bean production yield.
| Published in | American Journal of Life Sciences (Volume 12, Issue 2) |
| DOI | 10.11648/j.ajls.20241202.11 |
| Page(s) | 24-32 |
| Creative Commons |
This is an Open Access article, distributed under the terms of the Creative Commons Attribution 4.0 International License (http://creativecommons.org/licenses/by/4.0/), which permits unrestricted use, distribution and reproduction in any medium or format, provided the original work is properly cited. |
| Copyright |
Copyright © The Author(s), 2024. Published by Science Publishing Group |
Adaptability, Faba Bean, GGE Biplot, Stability and Varieties
2.1. Description of Experimental Areas
2.2. Experimental Materials, Design and Field Management
Variety | Pedigree | Seed Size | Year of Release | Adaptation area(m.a.s.l) | Breeder/Maintainer |
|---|---|---|---|---|---|
Shallo | EH011-22-1 | Small | 2000 | 2300-2800 | SARC |
Walki | EH96049-2 | Medium | 2008 | 1800-2800 | HARC |
Dosha | Coll 155/00-3 | Medium | 2009 | 1900-2800 | HARC |
Tumsa | EH99051-3 | Large | 2010 | 2050-2800 | HARC |
Gora | EK 01024-1-2 | Large | 2013 | 1900-2800 | KARC |
Mosisa | EH99047-1 | Medium | 2013 | 2300-2800 | SARC |
Didea | EH01048-1 | Large | 2014 | 1800-2800 | HARC |
Alloshe | EH03043-1 | Medium | 2017 | 2300-2800 | SARC |
Dagim | Grarjarso 89-8 | Small | 2002 | 1900-2800 | HARC |
Ashebeka | EH010755-4 | Large | 2015 | 1900-2800 | KARC |
Tosha | EH00021-1 | Medium | 2019 | 2300-2600 | SARC |
Moybon | EH011088-3 | Large | 2019 | 2300-2600 | SARC |
Hachalu | EH00102-4-1 | Medium | 2010 | 2100-2800 | HARC |
Local | Small |
2.3. Data Collected
2.4. Statistical Analysis
2.5. GGE Biplot and AMMI Stability Analysis
3.1. Combined Analysis of Variance
Source of Variation | Mean squares | ||||||
|---|---|---|---|---|---|---|---|
Df | DM | PPP | SPP | Pht | GY | HSW | |
Variety | 13 | 30.2*** | 144.6*** | 1106*** | 349** | 1579966*** | 4429.3*** |
Location | 5 | 8856.7*** | 1077.9*** | 4937*** | 21878*** | 30805344*** | 914.9*** |
Variety* Location | 65 | 34.3*** | 20.2NS | 109NS | 139NS | 1270643*** | 101.8 |
Residuals | 83 | 9.3 | 20.9 | 115 | 126 | 337894 | 88.8 |
3.2. Estimate Analysis of Variance Components
Source | Df | SS | MS | Ex.SS % | Pr(>F) |
|---|---|---|---|---|---|
Environments | 4 | 119882855.4 | 29970714** | 33.1 | < 0.001 |
Rep(Environments) | 10 | 628842.3 | 62884.23 | 0.2 | 1.00 |
Genotype | 13 | 22178421.8 | 1706032** | 6.12 | <0.001 |
Genotype: Environment | 52 | 66073415.9 | 1270643** | 18.24 | < 0.001 |
PC1 | 16 | 39640773.8 | 2477548** | - | <0.001 |
PC2 | 14 | 7510037.8 | 536431.3 | - | 0549 |
PC3 | 12 | 3112051.2 | 259337.6 | - | 0.945 |
PC4 | 10 | 1686184 | 168618.4 | - | 0.983 |
Residuals | 172 | 101436658.8 | 589748 | 28.01 | |
Total | 303 | 362149240.9 | 1195212 |
3.3. Performances of Agronomic Yield Components
Variety | DM | PPP | SPP | Pht | GY | HSW |
|---|---|---|---|---|---|---|
Welki | 142.1b-e | 14.9b | 35.1b | 110.2ab | 3087.74a | 52.6e |
Ashebeka | 145.9a | 12.9b-e | 30.9b-e | 114.6a | 2952.41ab | 84.5a |
Gora | 143.2b-d | 10.9de | 26.6de | 107.9a-c | 2763.65cd | 79.6a |
Didea | 143.1b-d | 14.3bc | 34.7b | 109.6ab | 2682.48d | 70.8bc |
Dosha | 141.0de | 14.9b | 33.9bc | 105.4bc | 2861.64bc | 67.8b-d |
Tumsa | 141.6c-e | 12.6b-e | 26.8de | 106.8bc | 2523.05e | 71.5b |
Mosisa | 141.4c-e | 13.8b-d | 29.4b-e | 105.6bc | 2508.84e | 64.6cd |
Hachalu | 144.3ab | 14.0bc | 32.9b-d | 110.6ab | 2469.35ef | 63.7d |
Local | 142.8b-d | 19.4a | 45.6a | 101.8cd | 2479.15ef | 32.1f |
Dagim | 143.8a-c | 20.1a | 51.6a | 104.4bc | 2392.64ef | 33.8f |
Moybon | 141.3de | 11.5c-e | 25.0e | 102.0cd | 2341.16f | 82.7a |
Aloshe | 140.1e | 12.8b-e | 28.1b-e | 106.7bc | 2329.29f | 63.6d |
Shalo | 141.1de | 12.5b-e | 27.6c-e | 104.3bc | 2059.77g | 64.0d |
Tosha | 141.2de | 10.1e | 24.2e | 96.9d | 2047.76g | 66.5b-d |
LSD (5%) | 2.47 | 3 | 7.06 | 7.38 | 152.45 | 6.2 |
CV (%) | 2.15 | 22.84 | 23.19 | 10.56 | 9.14 | 14.7 |
3.4. Performances of Faba Bean Grain Yield Across Environments
Varieties | Mean Grain Yield (kg/ha) | Combined Mean of GY(Kg/ha) | Yield Adv.(%) | |||||
|---|---|---|---|---|---|---|---|---|
2020 | 2021 | 2022 | ||||||
Degam | H/Abote | D/Libanos | Degam | Wachale | Jida | |||
Welki | 4899.9a | 2085.2gh | 2987.4e | 4929.2b | 1586.1ef | 2038.6b | 3087.74a | 24.5 |
Local | 3611.9b | 2367.5cd | 1324.6j | 3703.9f | 1834cd | 2032.1b | 2479.15ef | 0 |
Dosha | 3590.2b | 2399.6c | 1102.6k | 5324.6a | 1646.3ef | 3106.5a | 2763.65cd | 15.4 |
Mosisa | 3034.7c | 2259.2de | 1930.4h | 4832.2b | 1397.4g | 1599.2b | 2508.84e | 1.2 |
Aloshe | 2618.5d | 2252.2d-f | 1371.4j | 4388.7c | 1479.1fg | 1865.8b | 2329.29f | -6.1 |
Shallo | 2533.5de | 1666.9i | 1059.2k | 4402.5c | 1098.8h | 1597.6b | 2059.77g | -16.9 |
Hachalu | 2398.5ef | 2197.0e-g | 2288.7g | 4095.5de | 2119.0b | 1717.4b | 2469.35ef | -0.4 |
Moybon | 2271.0fg | 2133.9f-h | 2206.3g | 4220.8cd | 1528.9e-g | 1686.0b | 2341.16f | -5.6 |
Ashebeka | 2129.4g | 2841.5b | 3923.5a | 4204.7cd | 2863.9a | 1751.5b | 2952.41ab | 19.1 |
Tosha | 1915.5h | 1430.9j | 1759.7i | 4376.6c | 1364.3bc | 1439.6b | 2047.76g | -17.4 |
Dagim | 1776.0hi | 2016.0h | 3274.5d | 3848.2ef | 1688.9de | 1752.3b | 2392.64efab | -3.5 |
Tumsa | 1761.1i | 2359.7cd | 2772.0f | 4356.3cd | 1673.9de | 2215.3b | 2523.05e | 1.7 |
Gora | 1567.2j | 2809.4b | 3419.2c | 4849.4b | 2153.7b | 1782.9b | 2763.65cd | 11.4 |
Didea | 1076.7k | 3140.4a | 3612.1b | 4287.8cd | 1910.1c | 2067.9b | 2682.48d | 8.2 |
Mean | 2513.2 | 2282.8 | 2359.4 | 4415.7 | 1738.9 | 1903.8 | 2535.64 | |
LSD (5%) | 151.7 | 122.8 | 109.1 | 268.9 | 172.9 | 865.2 | 152.45 | |
CV (%) | 3.6 | 3.2 | 2.8 | 3.6 | 5.9 | 27.2 | 9.14 | |
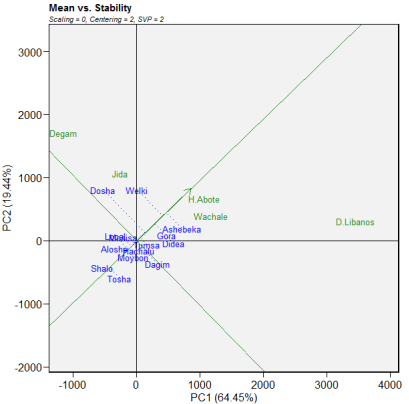
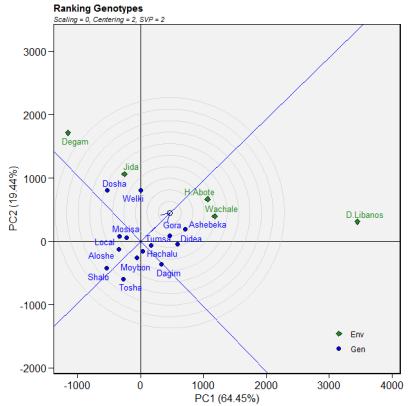
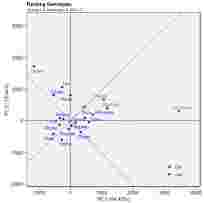
3.5. GGE Biplot and Stability Analysis
3.6. Performances of Tested Varieties across Locations
| [1] | Abebe, T., Belay, G., Keneni, G., & Tadesse, T. 2018. Fungicidal Management of the Newly Emerging Faba bean disease “Gall” (Olpidium viciae Kusano) in Tigray, Ethiopia. Crop Protection, 107(March 2017), 19–25. |
| [2] | Anteneh, A., Yohannes, E., Mesganaw, G., Solomon, G., & Getachew, T. 2018. Survey of Faba bean (Vicia faba L.) Diseases in Major Faba bean Growing Districts of North Gondar. African Journal of Plant Science, 12(2), 32–36. |
| [3] | CSA. 2021. Agricultural sample survey 2020/21 (2013 E. C.): Report on Area and Production of Major Crops (Private Peasant Holdings, Meher Season). In Statistical Bulletin (Vol. 590). Addis Ababa, Ethiopia. |
| [4] | Fouad M., Mohammed N., Aladdin H., Ahmed A., Xuxiao Z., Shiying B., Tao Y. Genetic and Genomic Resources of Grain Legume Improvement. Elsevier; 2013. Faba bean; pp. 113–136. |
| [5] | Gaur, C. P., Tripathi, S., Cll, G., Gv, R. R., Hc, S., & Pande, S. 2010. Chickpea Seed Production Manual. Patancheru 502 324, Andhra Pradesh, India: International Crops Research Institute for the Semi-Arid Tropics. |
| [6] | Gedif, M.; Yigzaw, D. 2014. Genotype environment interaction analysis for tuber yield of potato using a GGE biplot method in Amhara region, Ethiopia. Potato J. Pp; 41–51. |
| [7] | Gemechu Keneni, Musa Jarso and Welabu T. 2006. Faba bean (Vicia faba L.) genetics and breeding research in Ethiopia: A Review. In: Ali K, Gemechu Keneni, Ahmed S, Malhotra R, Beniwal S, Makkouk K, Halila MH (eds) Food and forage legumes of Ethiopia: Progress and prospects. Proceedings of a workshop on food and forage legumes. September 2003, Addis Ababa, Ethiopia. ICARDA, Aleppo, Syria, p 351. |
| [8] | Malunga, L. N., Bar-El Dadon, S., Zinal, E., Berkovich, Z., Abbo, S., & Reifen, R. 2014. The Potential Use of Chickpeas in the Development of Infant follow-on formula. Nutrition Journal, 13(1), 1–6. |
| [9] | Merkine Mogiso and Teshome Mamo.2018. Evaluation of faba bean (Vicia faba L.) varieties for yield performance in Kaffa Zone, Southwestern Ethiopia. Int. J. Curr. Res. Biosci. Plant Biol. 5(11), 68-74. |
| [10] | Mulusew Fikere, Tadele Tadesse and Tesfaye Letta. 2008. Genotype-Environment Interactions and Stability Parameters for Grain Yield of Faba Bean (Vicia faba L.) Genotypes Grown in South Eastern Ethiopia. International Journal of Sustainable Crop Production, 3(6): 80-87. |
| [11] | Ronner, E. and Giller, K. E. 2012. Agronomy, Farming Systems Background Information on and Ongoing Projects on Grain Legumes in Ethiopia. Retrieved from |
| [12] | Sarker, S. K., Rashid, S., Sharmin, M., Haque, M. M., Sonet, S. S., & Nur-Un-Nabi, M. 2014. Environmental Correlates of Vegetation Distribution in Tropical Juri Forest, Bangladesh. Tropical Ecology, 55(2), 177–193. |
| [13] | Tamene Temesgen, Gemechu Keneni, Tadese Sefera and Mussa Jarso. 2015. Yield stability and relationships among stability parameters in faba bean (Vicia faba L.) genotypes. The Crop Journal, 3: 260 - 261. |
| [14] | Teame, G., Ephrem, S., Lemma, D., 2017. Participatory evaluations of faba bean (Vicia faba L.) Varieties in EndaMekoni District, Northern Ethiopia. Afr. J. Agric. 4(2), 263-268. |
| [15] | Tekalign Efata, Bulti Tesso, Dagnachew Lule. 2019. Interaction Effects of Genotype by Environment and AMMI Stability Analysis of Seed Yield and Agronomic Performance of Faba Bean Genotypes in the Highlands of Oromia Region, Ethiopia. International Journal of Research in Agriculture and Forestry Volume 6, Issue 10, 2019, PP 22-31. |
| [16] | Thijs, R., Auke, B., Daphne, W., Dawit, K., & Wannes, D. 2015. Business Opportunity Report: Oilseeds and Pulses.Prinses Margrietplantsoen 37 2595 AM Den Haag: The Netherlands. |
| [17] | Watson J., Zheng B., Chapman S., Chenu K. 2017. Projected Impact of Future Climate on Water-stress Patterns across the Australian Wheat belt. Journal of Experimental Botany. Vol: 68(21–22): 5907–5921. |
| [18] | Wondwosen, W., Dejene, M., Tadesse, N., & Ahmed, S. (2019a). Evaluation of Faba Bean (Vicia faba L.) Varieties against Faba Bean Gall Disease in North Shewa Zone, Ethiopia. Review of Plant Studies, 6(1), 11–20. |
| [19] | Yan, W.; Hunt, L. A.; Sheng, Q.; Szlavnics, Z. 2000. Cultivar evaluation and mega-environment investigation based on the GGE biplot. Crop Sci. Vol: 40, Pp; 597–605. |
| [20] | Yan, W.; Kang, M. S. 2003. GGE Biplot Analysis: A Graphical Tool for Breeders, Geneticists, and Agronomists; CRC Press LLC: Boca Raton, FL, USA; Pp. 271. |
| [21] | Yan, W.; Rajcan, I.2002. Biplot analysis of test sites and trait relations of soybean in Ontario. Crop Sci. Vol: 42, Pp; 11–20. |
| [22] | Yan, W.; Tinker, N. A. 2006. Biplot analysis of multi-environment trial data: Principles and applications. Can. J. Plant Sci., Vol: 86, Pp; 623–645. |
APA Style
Bedada, A. F., Bedada, G. S., Firisa, N. K. (2024). Performance Evaluation and Adaptability of Improved Faba Bean (Vicia Faba L.) Varieties in the Highlands of North Shewa Zone, Oromia . American Journal of Life Sciences, 12(2), 24-32. https://doi.org/10.11648/j.ajls.20241202.11
ACS Style
Bedada, A. F.; Bedada, G. S.; Firisa, N. K. Performance Evaluation and Adaptability of Improved Faba Bean (Vicia Faba L.) Varieties in the Highlands of North Shewa Zone, Oromia . Am. J. Life Sci. 2024, 12(2), 24-32. doi: 10.11648/j.ajls.20241202.11
AMA Style
Bedada AF, Bedada GS, Firisa NK. Performance Evaluation and Adaptability of Improved Faba Bean (Vicia Faba L.) Varieties in the Highlands of North Shewa Zone, Oromia . Am J Life Sci. 2024;12(2):24-32. doi: 10.11648/j.ajls.20241202.11
@article{10.11648/j.ajls.20241202.11,
  author = {Abreham Feyisa Bedada and Gashaw Sefara Bedada and Name Kinati Firisa},
  title = {Performance Evaluation and Adaptability of Improved Faba Bean (Vicia Faba L.) Varieties in the Highlands of North Shewa Zone, Oromia
},
  journal = {American Journal of Life Sciences},
  volume = {12},
  number = {2},
  pages = {24-32},
  doi = {10.11648/j.ajls.20241202.11},
  url = {https://doi.org/10.11648/j.ajls.20241202.11},
  eprint = {https://article.sciencepublishinggroup.com/pdf/10.11648.j.ajls.20241202.11},
  abstract = {Field experiment was conducted at Degam, H/Abote, D/Libanos, Jida and Wachale districts of North Shewa Zone, Oromia region, Central Ethiopia with the objectives of evaluating adaptable and best yield performing improved Faba bean varieties for further demonstration and scaling up during the main cropping season of 2020, 2021 and 2022. The experiment was conducted using randomized complete block design (RCBD) with three replications. In the experiment, thirteen improved faba bean varieties and one local control were used to evaluate their performance. Parameters like seed yield (qt/ha), 1000 seed weight in gram, number of pod per plant, number of seed per pod, plant height (cm) were measured to assess the actual field performances of different faba bean varieties. The data were analyzed by R software. Grain yield and most of yield components were significantly affected by main effect of variety, environment and interaction of variety and environment. The results revealed that there were significant (P < 0.01) variations between the varieties for yield. Higher yield was recorded on Welki and Ashebeka varieties while low yield was recorded from Tosha and Shalo. In addition the stability analysis indicated that as the mean of grain yield is more stable across locations as compared to other variety. Also, in this study it was found that there is 24.5 % and 19.1% increment of yield using of Welki and Ashebeka variety respectively as compared to local variety at the study area. Therefore, farmers located at the study area are recommended to use those varieties to increase faba bean production yield.
},
 year = {2024}
}
TY  - JOUR
T1  - Performance Evaluation and Adaptability of Improved Faba Bean (Vicia Faba L.) Varieties in the Highlands of North Shewa Zone, Oromia

AU  - Abreham Feyisa Bedada
AU  - Gashaw Sefara Bedada
AU  - Name Kinati Firisa
Y1  - 2024/04/02
PY  - 2024
N1  - https://doi.org/10.11648/j.ajls.20241202.11
DO  - 10.11648/j.ajls.20241202.11
T2  - American Journal of Life Sciences
JF  - American Journal of Life Sciences
JO  - American Journal of Life Sciences
SP  - 24
EP  - 32
PB  - Science Publishing Group
SN  - 2328-5737
UR  - https://doi.org/10.11648/j.ajls.20241202.11
AB  - Field experiment was conducted at Degam, H/Abote, D/Libanos, Jida and Wachale districts of North Shewa Zone, Oromia region, Central Ethiopia with the objectives of evaluating adaptable and best yield performing improved Faba bean varieties for further demonstration and scaling up during the main cropping season of 2020, 2021 and 2022. The experiment was conducted using randomized complete block design (RCBD) with three replications. In the experiment, thirteen improved faba bean varieties and one local control were used to evaluate their performance. Parameters like seed yield (qt/ha), 1000 seed weight in gram, number of pod per plant, number of seed per pod, plant height (cm) were measured to assess the actual field performances of different faba bean varieties. The data were analyzed by R software. Grain yield and most of yield components were significantly affected by main effect of variety, environment and interaction of variety and environment. The results revealed that there were significant (P < 0.01) variations between the varieties for yield. Higher yield was recorded on Welki and Ashebeka varieties while low yield was recorded from Tosha and Shalo. In addition the stability analysis indicated that as the mean of grain yield is more stable across locations as compared to other variety. Also, in this study it was found that there is 24.5 % and 19.1% increment of yield using of Welki and Ashebeka variety respectively as compared to local variety at the study area. Therefore, farmers located at the study area are recommended to use those varieties to increase faba bean production yield.

VL  - 12
IS  - 2
ER  -
Fitche Agricultural Research Center, Fitche, Ethiopia
Information