Research Article | | Peer-Reviewed

Impact of Improved Rice Variety Adoption on Smallholder Farmers Rice Productivity and Gross Farm Income Enhancement in North Western Ethiopia

Received: 10 February 2024    Accepted: 12 March 2024    Published: 17 April 2024
Views:       Downloads:
Abstract

The research was assessed status of adopting improved rice technology as well as evaluate its impact on rice productivity and gross farm income in Ethiopia. The research showed the importance of adopting improved rice technologies using impact evaluating techniques such as propensity scoring matching (PSM). The research was used descriptive and econometric methods of data analysis to elaborate the respondents’ characteristics, farming practices, adoption status and to estimate its impact. The research used multistage sampling methods to select 180 smallholder rice producers. Amhara and Benshangul Gumuz region are the potential rice producers which targeted for this study. Zones, districts and kebles of these regions were selected random that can be represent the region as well as the rice producers in Ethiopia. The research revealed that 44.44% of the respondents were adopted improved rice technology and pawe_1 is the most frequently used by respondents. The econometric result revealed that treated groups were gained high rice output 3,019.70 quintal per hectare over the controlled groups 1,971.40 quintal per hectare as well as in terms of gross income treated groups were earned higher income which is 46,159.78 ETHB than the controlled groups which were earned 29,797.14 ETHB on average. This indicated that adopting improved rice technology was brought 34.72% and 35.45% of increment in rice productivity and gross income on smallholders’ rice producers respectively. Adopting of agricultural technologies are a means of improving the smallholder farmers crop production, productivities and income generated from that farm activities. Therefore, any governmental and non-governmental institution should be focused on the outreach of these agricultural technologies to end user over all part of the country.

Published in International Journal of Agricultural Economics (Volume 9, Issue 2)
DOI 10.11648/j.ijae.20240902.17
Page(s) 110-119
Creative Commons

This is an Open Access article, distributed under the terms of the Creative Commons Attribution 4.0 International License (http://creativecommons.org/licenses/by/4.0/), which permits unrestricted use, distribution and reproduction in any medium or format, provided the original work is properly cited.

Copyright

Copyright © The Author(s), 2024. Published by Science Publishing Group

Keywords

Adoption, Impact, Improve Variety, Groundnut Productivity, Income and PSM

1. Introduction
Agriculture is the engine of Ethiopia Economy which play a massive role on export share (90%), job opportunity and share 32% of the country gross domestic product(GDP). Agriculture sector is the main source income and food for smallholder farmers as well as used as raw material supply for the industrial sectors. The Ethiopia Economy particularly, Agriculture was grown by 5.3% during the last twenty years. This indicated that Agriculture sector has a vital role in the Ethiopia economy that contributed 57.60% to the whole economy growth of the country. Keeping and sustainable the current economic growth of the country helps to increase production and productivity of the agricultural sector, income of smallholder farmers who engaged in cultivation of crops and rearing of animals as well as to ensure their food security. Hence, focusing on cultivating of high yielding crop types might facilitated and enhanced the productivity, income, food security of smallholder farmers in Ethiopia. Among cereals crops maize, wheat, sorghum, finger millet, barely and rice are the high yielding crop types and they are used as staple food and source of income to smallholder farmers in Ethiopia.
Rice is a million crop that gave high emphasis to ensure food security and reduce poverty of smallholder farmers in Ethiopia .
Rice was introduced to Ethiopia in 1970s to tackle food insecurity problems in the resettlement area of Ethiopia particularly Benshangul Gumuz, Amhara and Gambella region during the derg regim . After introduction of rice to the country, its expansion was tremendous and covers almost in all part of the country since 1990s that reached more than half part of the country namely, Amhara, Benshangul Gumuz, Oromia, Tigray and southern and Gambella regions. The production of rice was showed an incremental trend which covers a total area of 10,000 ha to 85,288.85 ha from 2005 to 2020 in Ethiopia . Rice is ranked the second among cereal crops in terms of productivity after maize and its productivity was showed an incremental trend from 18 quintals per hectare to 31.44 quintal per hectare in the years of 2005 to 2020 . This is due to high emphasis was given by government to boost rice productivity by releasing new variety, popularizing, scale out, multiplication and dissemination of a new rice varieties to smallholder farmers particularly in Benshangul Gumuz and Amhara regional state regions.
To pace the rice sector, the government of Ethiopia(GE) launched a rice research centers during the late of 1990s at Abobo and Pawe Agriculture research centers. In addition to these research centers, it expands to Amhara region (fogera National Rice and Training centers), Beneshangul Gumuz (Assosa), Afar (Werer), Southern Region (Hawassa), and Tigray region (Shire May-Tsebri rice research centers) . Hence to improve and enhance the rice production and productivity, these research centers released about 43 new improved rice varieties and disseminated to end users to enhance smallholder farmers rice production, productivity and incomes at household levels.
Awi and Metekel zones are among the conducive rice producing areas in Amahara and Benshangul Gumuz regional states which focused this research to investigated the importance of adopting improved rice varieties on smallholders’ rice productivity and income improvement. Cultivation of rice in Awi and Metekel Zone is the main agricultural activities for smallholder farmers especially who have swampy farm lands. They use as source of staple food and incomes which consumed in different forms like Ingera, Kita and Gonfo. Moreover, it uses for making of local bira like Tila. Besides, its straw used as animal feed and for making of houses by mixing with mud.
Eventhough, a lot of of rice varieties have been innovated, released and disseminated to smallholder farmers in Metekel and Awi Zones, a little empirical evidence has been investigated about the importance of improved rice variety adoption on smallholder farmers rice productivity and income improvement. Up to date some literatures has been focused on soybean, groundnut, coffee varieties . Hence to fill the knowledge gap on the importance of adopting improved rice variety on smallholder rice productivity and income enhancement, this research was intended to conduct and investigated the impact of improved rice variety adoption on smallholder farmers rice producing areas in Awi and Metekel Zones, Amhara and Beneshangul Gumuz regional states respectively.
2. Methodology of Research

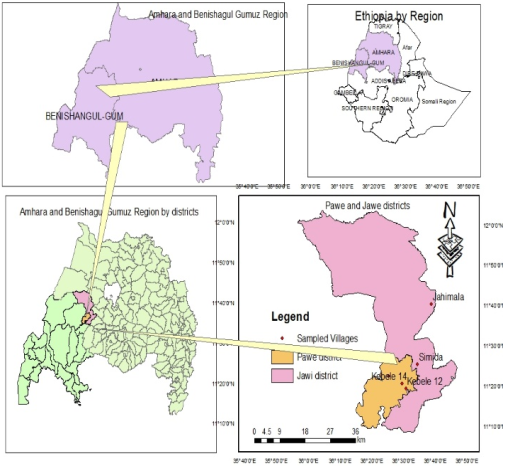
2.1. Description of the Study Area

Pawe is one of the seven districts in Metekel Zone Benshangul Gumuz Regional state. The district has 20 potential rice producing kebles which found at 21 kilo meter from the capital city of metekel zone, Gelgel Beles town, 335 kilo meter from the region capital city, Assosa and 568 kilo meter from Addis Ababa, the capital city of the country to north west direction. Its geographical location is 36°28’22 86’’ longitude and latitude of 11°19’03.90’. The district is practicing both cultivations of crops and livestock rearing with dominant of cereals oil crops. Among cereal crops, Rice is ranked second in terms of productivity .
Jawi is one of the six districts in Awi Zone Amhara Regional state. The district has 25 potential rice producing kebles which found at 156 kilo meter from the capital city of Awi zone, Injibara town, 272 kilo meter from the region capital city, Bahrdar and 608 kilo meter from Addis Ababa, the capital city of the country to north west direction. Its geographical location is 36°27’21 94’’ longitude and latitude of 11°16’49.42’’. The district is practicing both cultivations of crops and livestock rearing with dominant of cereals oil crops. Among cereal crops, Rice is ranked second in terms of productivity .
Figure 1. Map of the Study Area.

2.2. Sampling Procedure and Sample Size Determination

The research was employed multi stage sampling procedures. At the first stage the potential rice producing regions and zones were selected randomly. At the second stage also districts and kebles were selected randomly from each zone. At the third stage, smallholder rice producers were selected using systematic random sampling method and proportion to population size. Accordingly, Pawe from Metekel zone and Jawi from Awi zones were selected. 180 of smallholder rice producers were also sampled and conducted this research based on the response of these smallholders’ rice producers.
The research adopted the Cochran formula to determine the sample size .
m= Y2 ( FG)/e2  (1)
Where m – sample size, Y - Is 95% confidence, F –Number of success and G is number of failure, e - margin of error. According this formula, 180 sample households of rice producers were taken from two districts. The sample distribution is illustrated as follow.
Table 1. Respondents of Rice Producers by District.

District

# of sample unit selected

Share of sample in %

Pawi

95

52.78

Jawe

85

47.14

180

100

Source: (Own Competion, 2019)

2.3. Source and Techniques of Data Collection

This research was used survey method of data collection techniques from smallholder rice producers to collect the primary data whereas the secondary data was collected using unpublished document review from zone and district governmental offices. The primary data was collected by trained enumerators by interviewing and filling their response on well-developed and structured questionnaires.

2.4. Econometric Analysis

2.4.1. Propensity Score Matching (PSM)

There are numerous impact studying techniques. Endogens switching regression, difference in difference and Propensity Score Matching techniques (PSM) are among the impact evaluation techniques. PSM is the appropriate impact evaluation in case of the dependent variable has dummy characteristics and data type is cross sectional . Hence, this research employed PSM impact evaluation since the data on hand is a cross sectional data and the dependent variable has a dummy characteristic. PSM estimating has five steps , these are estimate propensity score, identify common support, choosing best matching algorithm, testing matching quality and sensitivity analysis.

2.4.2. Estimating Propensity Score Techniques

Propensity score is estimated using logit or probit regression techniques on beneficiaries and non-beneficiaries by choosing covariant variables
According to in estimating the logit model, the dependent variable is adopter and non-adopter which takes a value of 1 if they produce improved rice and it takes 0 if they were produced local rice.
The propability of adopting improve rice variety is estimating using this equation
Qi=eZi1+eZi  (2)
Where: - Qi = is the probability of producing improved rice variety of ith household. cultivating improved rice variety takes 1 whereas local rice cultivators takes 0.
Yi= α + βXi + Ui  (3)
Where i= 1, 2, 3 … N, α = Intercept, β = regression coefficient to be estimated, Xi = Explanatory variables, Ui = a disturbance term
Adopting improved technology on crop productivity and associated income of impact is evaluated by the equation
Zi=Xi D = 1- Yi  D = 0  (4)
Where Zi = is the impact of improved rice variety adoption, Xi = is the rice productivity and gross farm income enhancement on the ith household, Di = is whether the iTh household has been adopted improved rice variety or not. Estimating non-biased average treatment effect (ATT) is obtained by conducted survey randomly that avoided self-selection biasness .
3. Results and Discussion

3.1. Demographic and Socioeconomic Characteristics of Respondents

Majority of respondents (87.22%) are men headed households and the rest 12.78% are women headed households. This is good representative of the Ethiopian rural households which is about 10% is female headed households in rural Ethiopia. 38.88% and 5.56% of the total respondents were men and women household headed that adopted improved rice variety respectively. However, there is no statically significance on adopting the rice technology . More than half of the respondents (52.78%) are getting extension service in the study area. Among these, 25.56% and 27.22% are treated and controlled groups respectively. Since, the service is given to all smallholder farmers who participate in any cultivate of crop in the rural Ethiopia. Hence, the extension contact of household has no influence on adopting of improved rice variety. According the respondents response 46.11% said that their rice farm land is fertile that can grow rice gives good yield and among these 25% and 21.11% are treated and controlled groups respectively. Thus, soil fertility of respondents has positive effect and statically significance at 5% on adopting of improved rice variety. According the respondents response 34.44% said that they were got train on rice production during 2018/19 crop production season and among these 19.44% and 15% are treated and controlled groups respectively. Thus, train on rice production has positive effect and statically significance at 5% on adopting of improved rice variety. less than half of the respondents (47.22%) are member of cooperatives in the study area. Among these, 26.67% and 20.56% are treated and controlled groups respectively. Thus, the result of chi2 statistics revealed that being a member of cooperative has positive effect and statically significance at 1% on adopting of improved rice variety.
Table 2. Respondents Socio-Cultural Interaction.

Dummy variables

Adopter

Non-Adopter

Total

X2

Sex(adopter)

80

100

180

0.01

Male

70

87

157

Extension Contact

80

100

180

1.28

Yes

46

49

95

Soil Fertility

80

100

180

5.95**

Yes

45

38

83

Trained on Rice Production

80

100

180

5.52**

Yes

35

27

62

Member of Cooperative

80

100

180

9.43***

Yes

48

37

85

Source: (Own Competion, 2019)

3.2. Respondents Socio-Economic Characteristics

According the respondents, the rice producers Age, rice farm experience, total owned land, cultivated land for rice production, owned animal in TLU, distance to FTC, distance to district market and distance to milling paddy rice in Kilo meter was not showed statistically significance. Thus, T-test value does not show statistically significance. The educational background is almost complete of grade two which is greater by one class than the non-adopters and it is statistically significance at 5% and positive effect on the adoption of improved rice variety. Adopters of improved rice variety is nearest to district market than the non-adopters of improved rice varieties by six minutes. it is statistically significance at 1% and positive effect on the adoption of improved rice variety.
Table 3. Respondents Asset ownership.

Continous variables

Adopter

Non-Adopter

Whole sample

T-Value

Age

41.60

43.02

42.38

1.22

Education

1.54

.98

1.23

2.64**

Farm exp

5.48

5

5.21

1.22

farm land

2.92

2.98

2.95

0.65

Rice land

0.589

0.59

0.59

0.12

Own TLU

4.5

4.39

4.44

0.40

Dist/FTC

1.75

1.95

1.86

1.64

Dist/market

22.94

28.53

26.04

8.33***

Dist/coop

1.34

1.52

1.44

1.26

Dist/mill

1.57

1.50

1.53

0.47

Source: (Own Competion, 2019)

3.3. Improved Rice Variety Preference and Its Adoption in North Western Ethiopia

In This study, the research tried to identify the distribution of improved rice varieties by Pawe, Fogera and other rice research centers and its adoption rate in North western Ethiopia by smallholder farmers. According the response of smallholder farmers Pawe_ rice variety is the most preferred and adopted in North Western Ethiopia. Among the improved rice variety 27.78%, 11.11% and 5.55% of Pawe_1, NERICA_4 and X-Jegina varieties were adopted by respondents in study area. The respondents have showed significance difference to adopt the improved rice technology.
Table 4. Respondents Rice variety preference.

Rice Variety

District

Total

Adoption rate

Pawe

Jawi

Pawe_1

31

19

50

27.78

NERICA_4

11

9

20

11.11

X-Jegina

3

7

10

5.55

NERICA_1

0

0

0

0

SUPERICA_1

0

0

0

0

Old Rice Variety

50

50

100

55.56

Source: (Own Competion, 2019)

3.4. Adoption of Improved Rice Technology by District

In North western Ethiopia 44.44% of the total respondents of rice producers are adopter of improved rice variety whereas the remain 55.56% are non-adopters. When we see it at district level, it is more adopted in Pawi district (47.36%) than Jawe district (41.18%). Even though, there is slightly difference on the used improved rice variety between the two district, it does not statistically significance (Table 5).
Table 5. Adoption rate of improved rice variety.

District

Treated

Controlled

% of Treated

% of Controlled

Pawi

45

50

47.36

52.64

Jawe

35

50

41.18

58.82

Whole

80

100

44.44

55.56

Source: (Own Competion, 2019)

3.5. Determining Exogenous Variables Causing Over Estimate of Outcome Variable

Significant variables should be excluded from further impact estimation to excluded the over estimation of impact due to intervention. Eleven covariant variables were used the model to determine the variables that causing to outcome variable. Among these variables four of them affected the impact of improved rice variety adoption on rice productivity and income of smallholder farmers in North Western Ethiopia. Smallholder farmers who is more educated, own fertile land, and trained on rice production showed statistically significance at 5% and positive effect and smallholder farmers who are a member of cooperatives are highly statically significance at 1% and positive effect on impact estimation. In addition to this, smallholder farmers who are more farm experience in rice production also have statistically significance at 10% and positive effect on impact estimation. Base on this theory, four significance variables are excluded from further impact evaluation.
Table 6. Determining Cofactors Causing to overestimate Outcome Variable (Logit regression).

Cofactors

Coefficients

Std.err

Z Value

Sex

0.09

0.30

0.31

Education

0.14

0.07

1.93

Age

-0.03

0.02

-1.51

Rice farm experience

0.09

0.05

1.18

Allocated land for rice production

0.22

0.36

0.6

Access to credit

0.13

0.22

0.58

Labor force

0.09

0.14

0.67

Extension contact

0.17

0.20

0.85

Soil fertility

0.46

0.20

2.27

Trained on rice production

0.49

0.21

2.30

Member of Cooperatives

0.57

0.20

2.84

Constant

-0.92

0.70

-1.31

Source: (Own Competion, 2019)

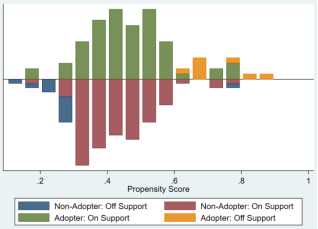
3.6. Estimate Propensity Score Matching and Identifying the Common Support Region

The mini and maxi, trimming or combine approaches are best way of estimating propensity score result and determining the common support region . Determining the common support is essential for furtherly evaluating the impact driven by the adoption of technology. The above theory mentioned this research revealed that common support region is laid between 0.0532 and 0.7820 of the propensity score. Besides propensity score of treated was distributed between 0.0532 and 0.9056 with a mean of 0.5575 whereas the Controlled groups of the propensity score were distributed between 0.0455 and 0.7820 with a mean of 0.3590 (Table 7).
Table 7. Propensity Scores and Common Supports.

Groups

Ob

Mean

Std. de

Min

Max

Treated

80

0.5575

0.2149

0.0532

0.9056

Controlled

100

0.3590

0.1818

0.0455

0.7820

Common Support

On Support

Off Support

Whole

Treated

74

6

80

Controlled

96

4

100

Whole

170

10

180

Source: (Own Competion, 2019)

3.7. Treated and Controlled Groups of Propensity Score Sketching

The propensity score of Treated and Controlled groups are estimated by taking sensitivity analysis and discarding the off support to estimate good impact value on average of average. Figure 2 shows the propensity score distribution of Treated and Controlled groups and their common support area. About 94.44% of the respondents were fall in the common support area indicated that there is a good overlap of treated and controlled groups distribution the finding is in line with .
Figure 2. Map of Common Support Area.

3.8. Selection of Best Matching Method

The evaluation of impact on treated and controlled groups is conducted after selecting of The best matching methods. The matching methods is conducting after selecting a matching methods using the three criteria such as large insignificant covariates, lesser R2 value and large matched sample size. Nevertheless, the matching methods may give the same result and if such condition happened, the matching method is chosen by randomly. In this research, this is happening except the kernel bandwidth of (0.01). Therefore, radius bandwidth (0.5) has been selected randomly that satisfies lower pseudo R2 value (0.1305), large insignificant covariate (6) and large matched sample size (170) that excluded 10 off support respondents’ (Table 8).
Table 8. Selection Criteria of Matching Methods.

Matching Estimators with different band width

Selection Criteria

Balancing Test

Pseudo R2

Matched Sample Size

Kernel

0.01

6

0.1305

147

0.1

6

0.1305

170

0.25

6

0.1305

170

0.5

6

0.1305

170

Radius

0.01

6

0.1305

170

0.1

6

0.1305

170

0.25

6

0.1305

170

0.5

6

0.1305

170

Neighbor

Neighbor 1

6

0.1305

170

Neighbor 2

6

0.1305

170

Neighbor 3

6

0.1305

170

Neighbor 4

6

0.1305

170

Source: (Own Competion, 2019)

3.9. Impact of Improved Rice Variety Adoption on Rice Productivity in NW Ethiopia

One of the corner stones of this research is evaluating the impact of adoption of improved crop varieties on crop productivity at smallholder farmers level. For the purpose of this research, respondents are categorized as treated and controlled groups for those cultivating improved rice variety and local rice varieties respectively. In this case, raised a question does adoption of improved rice varieties contributed to rice productivity at smallholder farmers? If yes in what amount? According to the survey data, the answer is yes. The propensity score matching of impact evaluating methods revealed that on average treated groups were produced 3,019.70 quintal of rice output per hectare whereas the controlled groups were produced 1,971.40 quintal of rice output per hectare which is greater than the controlled groups by 1,048.30 quintal of rice output per hectare. This result is statically significance at 1% and has positive effect of rice productivity at smallholder farmers. In general, adoption of improved rice variety brought 34.72% of increment on rice productivity at smallholder farmers. Based on this result, adoption of improved rice varieties has positive effect on increasing rice productivity of smallholder farmers from similar cultivated farm land in the study area. the same result is find by .
Table 9. Impact of improved rice variety adoption on rice productivity in North Western Ethiopia.

Outcome variable

Sample

Adopters

Non-Adopters

diff

SE

T-Stat

Rice Yield

Unmatched

3,015.70

1971.20

1,044.5

124.00

4.95

ATT

3,019.70

1971.40

1,048.4

143.44

4.42

ATU

1,971.40

3,019.70

1,048.4

ATE

1,048.4

Log of Rice Yield

Unmatched

12.39

11.66

0.73

0.09

4.51

ATT

12.40

11.66

0.74

0.11

4.07

ATU

11.66

12.40

0.74

ATE

0.74

Source: (Own Competion, 2019)

3.10. Impact of Improved Rice Variety Adoption on Gross Farm Income in NW Ethiopia

Another corner stones of this research is evaluating the impact of adoption of improved crop varieties on improvement of gross farm income at smallholder farmers level. For the purpose of this research, respondents are categorized as adopter and non-adopter for those cultivating improved rice variety and local rice varieties respectively. In this case, raised a question does adoption of improved rice varieties contributed to improvement of gross farm income at smallholder farmers? If yes in what amount? According to the survey data, the answer is yes. The propensity score matching of impact evaluating methods revealed that on average adopters were earned 46,159.78 ETHB of revenue per hectare whereas the non-adopters were earned 29,797.14 ETHB of revenue per hectare which is greater than the non-adopters by 16,362.64 ETHB of revenue per hectare. This result is statically significance at 1% and has positive effect of gross farm income improvement at smallholder farmers. In general, adoption of improved rice variety brought 35.45% of increment on gross farm income at smallholder farmers. Based on this result, adoption of improved rice varieties has positive effect on gross farm income generated from rice cultivation at smallholder farmers level from similar cultivated farm land in the study area. the same result is find by .
Table 10. Impact of improved rice variety adoption on Income of Rice producers in NEW.

Outcome variable

Sample

Adopters

Non-Adopters

diff

SE

T-Stat

Gross Farm income

Unmatched

45,687.93

29,863.48

15,824.45

124.0

4.95

ATT

46,159.78

29,797.14

16,362.64

143.4

4.42

ATU

29,797.14

46,159.78

16,362.64

ATE

16,362.64

Log of gross Farm income

Unmatched

17.01

16.27

0.74

0.09

4.51

ATT

17.03

16.27

0.76

0.11

4.07

ATU

16.27

17.03

0.76

ATE

0.76

Source: (Own Competion, 2019)

3.11. Analysis of Sensitivity on Rice Productivity and Gross Farm Income

The last steps in impact evaluating using PSM techniques is cross checking whether the exogenous variables have effect on or not the outcome variables in this case rice productivity and gross farm income at smallholder farmers level . Besides, sensitivity analysis is conducted to detect the conditional independence assumption (CIA) and was satisfactory or not. This revealed that the impact driven by the adoption of improved rice variety on rice productivity and gross farm income is not affected out of the variables include in the model. Furtherly, this implies that the rice productivity and gross farm income gained and earned by adopters is obtained due to improved rice adoption. Hence, this research was checked the effect of exogenous variable on rice productivity and gross farm income using The sensitivity test conducted in (Table 11) to check the impact of rice productivity and gross farm income was affected by exogenous variables or not. According the sensitivity test, the impact driven due to adoption of improved rice variety was not affected by exogenous variables (Table 11).
Table 11. Analysis of Sensitivity on Rice productivity and Gross Income.

Gamma

Omega (Ω+)

Omega (Ω-)

dx=1

3.2e-15

3.2e-15

dx =1.25

4.1e-12

4.1e-12

dx =1.5

2.1e-12

2.1e-12

dx =1.75

8.1e-12

8.1e-12

dx =2

1.1e-16

1.1e-16

dx =2.25

4.2e-15

4.2e-15

dx =2.5

9.1e-12

9.1e-12

dx =2.75

1.1e-12

1.1e-12

dx =3

9.1e-12

9.1e-12

Source: (Own Competion, 2019)
4. Conclusion and Recommendation
The research was accomplished at Jawi and Pawe districts in Awe and Meteke Zone of Amhara and Benshangul Gumuz regional states respectively in North west Ethiopia. Its aim is determining the importance of using improved rice varieties on rice productivity and associated of income generated. In this case, particularly examined the importance of using improved rice variety on rice production and income at household level. The descriptive statics result revealed 44.11% of total respondents are saying my rice farm land is fertile, 44.44% are taking training on rice production, 47.22% are member of cooperatives, 61.67% are owned mobile phone which used for communication about their farm land, economic, social and cultural issues. It also revealed that Adopters are more educated than non-adopters, adopters located near to district market by six-minute walking time on average than non-adopters, the total land owned (2.92ha and 2.98ha) and allocated for rice production (0.589 ha and 0.59 ha) is almost similar between adopters and non-adopters respectively. It also revealed that 44.44% of the total sample households were adopted the improved rice varieties which is medium rate of adoption at study area.
The Econometric analysis part showed that adopters of improved rice variety were earned higher gross farm income than the non-adopters. Adopters are earned 46,159.78 Ethiopian currency(ETHB) whereas the non-adopters are earned 29,797.14 Ethiopian currency(ETHB) from the given rice production. Furthermore, Adopters were produced 3,019.70 kg per ha of rice output which is almost enlarge by one third of the non-adopters’ rice output 1,971.20 kg per hectare. The Econometric analysis revealed that Adopters were produced 1,048.44 kg per ha of rice output difference over the non-adopters due to the adoption of improved rice variety. The Econometric output of this research thought that adoption of improved rice variety able to enhance rice production and gross farm income by 35.45 and 34.72% respectively over the non-adopters. This research is recommending for governmental and non-governmental organizations as follow. Adopting of agricultural technologies are a means of improving the smallholder farmers crop production, productivities and income generated from that farm activities. Therefore, any governmental and non-governmental institution should be focused on the outreach of these agricultural technologies to end user over all part of the country.
Conflicts of Interest
The authors declare no conflicts of interest.
References
[1] P. a. D. Commusion), "Ten Years Development Plan Pathway to Prosperity 2021-2030, Federal Democratic Repbulic of Ethiopia, Planning and Development Commusion, Addis Ababa, Ethiopia.," Planning and development Commusion, Addis Ababa, 2021.
[2] M. o. Agriculture), "National Rice Research and Development Strategy 2020-2030.," Ministry of Agriculture, Addia Ababa, 2020.
[3] A. Abebaw, H. Endeshaw, S. Seiichi and D. Alemu, "Impact assessment of adopting improved rice variety on farm household," Journal of Agriculture and Food Research, vol. 10, no. 2, pp. 1-12, 2022.
[4] C. S. Agency), "The Federal Democratic Repbulic of Ethiopia Centeral Statistics Agency. Area and Production of Major Crops, Private Peasant Holding, Meher Season," Centeral Statistics Agency, Addis Ababa, 2020.
[5] T. Welay and T. Desalegn, "Impact of Improved Soybean Variety on Enhancing Productivity and Gross Farm Income of Smallholder Farmers in North Western Ethiopia," Journal of Natural Sciences Research, vol. 9, no. 15, pp. 25-39, 2019.
[6] W. Tesfay, "Impact of Improved Groundnut Variety Adoption on GroundnutProductivity of Smallholder Farmers in North Western Ethiopia," Journal of Biology, Agriculture and Healthcare, vol. 13, no. 1, pp. 25-35, 2023.
[7] W. T. Tewelemedhin, "Impact of Improved Coffee Variety Adoption on Coffee Productivity of Smallholder Farmers in North Western Ethiopia," Journal of Economics and Sustainable Development, vol. 14, no. 7, pp. 13-24, 2023.
[8] W. Cochran, Sampling techniques. John Wiley & Sons, 2007.
[9] S. Khandker, Micro-finance and Poverty, 2010.
[10] M. Caliendo and S. Kopeinig, "Some practical guidance for the implementation of propensity score matchin," Journal of economic surveys, vol. 22, pp. 31-72, 2008.
[11] J. Smith and P. Todd, "Does matching overcome LaLonde's critique of nonexperimental estimators?," Journal of econometrics, vol. 125, pp. 305-353, 2005.
[12] D. Gujarati, Basic econometrics, Tata McGraw: Hill Education., 2009.
[13] J. Moti, K. Menale and M. Paswel, "Impact of Improved Maize Variety Adoption on Household Food Security in Ethiopia," International Association of Agricultural Economists, pp. 1-26, 2015.
[14] R. Dehejia and S. Wahba, "Propensity score-matching methods for nonexperimental causal studies.," Review of Economics and statistics, vol. 84, pp. 151-161, 2002.
[15] (D. A. O. PDAO, "Performance of Agricultural Activities Annual Report," Pawe District Agriculture Office, Pawe, Ethiopia, 2020.
[16] (D. A. O. JDAO, "Performance of Agricultural Activities Annual Report," Jawi District Agiculture Office, Jawi, Ethiopia, 2020.
[17] E. Leuven and B. Sianesi, "PSMATCH2: Stata module to perform full Mahalanobis and propensity score matching, common support graphing, and covariate imbalance testing," 2018.
Cite This Article
  • APA Style

    Tesfay, W., Woundiferaw, B. (2024). Impact of Improved Rice Variety Adoption on Smallholder Farmers Rice Productivity and Gross Farm Income Enhancement in North Western Ethiopia . International Journal of Agricultural Economics, 9(2), 110-119. https://doi.org/10.11648/j.ijae.20240902.17

    Copy | Download

    ACS Style

    Tesfay, W.; Woundiferaw, B. Impact of Improved Rice Variety Adoption on Smallholder Farmers Rice Productivity and Gross Farm Income Enhancement in North Western Ethiopia . Int. J. Agric. Econ. 2024, 9(2), 110-119. doi: 10.11648/j.ijae.20240902.17

    Copy | Download

    AMA Style

    Tesfay W, Woundiferaw B. Impact of Improved Rice Variety Adoption on Smallholder Farmers Rice Productivity and Gross Farm Income Enhancement in North Western Ethiopia . Int J Agric Econ. 2024;9(2):110-119. doi: 10.11648/j.ijae.20240902.17

    Copy | Download

  • @article{10.11648/j.ijae.20240902.17,
      author = {Welay Tesfay and Belete Woundiferaw},
      title = {Impact of Improved Rice Variety Adoption on Smallholder Farmers Rice Productivity and Gross Farm Income Enhancement in North Western Ethiopia
    },
      journal = {International Journal of Agricultural Economics},
      volume = {9},
      number = {2},
      pages = {110-119},
      doi = {10.11648/j.ijae.20240902.17},
      url = {https://doi.org/10.11648/j.ijae.20240902.17},
      eprint = {https://article.sciencepublishinggroup.com/pdf/10.11648.j.ijae.20240902.17},
      abstract = {The research was assessed status of adopting improved rice technology as well as evaluate its impact on rice productivity and gross farm income in Ethiopia. The research showed the importance of adopting improved rice technologies using impact evaluating techniques such as propensity scoring matching (PSM). The research was used descriptive and econometric methods of data analysis to elaborate the respondents’ characteristics, farming practices, adoption status and to estimate its impact. The research used multistage sampling methods to select 180 smallholder rice producers. Amhara and Benshangul Gumuz region are the potential rice producers which targeted for this study. Zones, districts and kebles of these regions were selected random that can be represent the region as well as the rice producers in Ethiopia. The research revealed that 44.44% of the respondents were adopted improved rice technology and pawe_1 is the most frequently used by respondents. The econometric result revealed that treated groups were gained high rice output 3,019.70 quintal per hectare over the controlled groups 1,971.40 quintal per hectare as well as in terms of gross income treated groups were earned higher income which is 46,159.78 ETHB than the controlled groups which were earned 29,797.14 ETHB on average. This indicated that adopting improved rice technology was brought 34.72% and 35.45% of increment in rice productivity and gross income on smallholders’ rice producers respectively. Adopting of agricultural technologies are a means of improving the smallholder farmers crop production, productivities and income generated from that farm activities. Therefore, any governmental and non-governmental institution should be focused on the outreach of these agricultural technologies to end user over all part of the country.
    },
     year = {2024}
    }
    

    Copy | Download

  • TY  - JOUR
    T1  - Impact of Improved Rice Variety Adoption on Smallholder Farmers Rice Productivity and Gross Farm Income Enhancement in North Western Ethiopia
    
    AU  - Welay Tesfay
    AU  - Belete Woundiferaw
    Y1  - 2024/04/17
    PY  - 2024
    N1  - https://doi.org/10.11648/j.ijae.20240902.17
    DO  - 10.11648/j.ijae.20240902.17
    T2  - International Journal of Agricultural Economics
    JF  - International Journal of Agricultural Economics
    JO  - International Journal of Agricultural Economics
    SP  - 110
    EP  - 119
    PB  - Science Publishing Group
    SN  - 2575-3843
    UR  - https://doi.org/10.11648/j.ijae.20240902.17
    AB  - The research was assessed status of adopting improved rice technology as well as evaluate its impact on rice productivity and gross farm income in Ethiopia. The research showed the importance of adopting improved rice technologies using impact evaluating techniques such as propensity scoring matching (PSM). The research was used descriptive and econometric methods of data analysis to elaborate the respondents’ characteristics, farming practices, adoption status and to estimate its impact. The research used multistage sampling methods to select 180 smallholder rice producers. Amhara and Benshangul Gumuz region are the potential rice producers which targeted for this study. Zones, districts and kebles of these regions were selected random that can be represent the region as well as the rice producers in Ethiopia. The research revealed that 44.44% of the respondents were adopted improved rice technology and pawe_1 is the most frequently used by respondents. The econometric result revealed that treated groups were gained high rice output 3,019.70 quintal per hectare over the controlled groups 1,971.40 quintal per hectare as well as in terms of gross income treated groups were earned higher income which is 46,159.78 ETHB than the controlled groups which were earned 29,797.14 ETHB on average. This indicated that adopting improved rice technology was brought 34.72% and 35.45% of increment in rice productivity and gross income on smallholders’ rice producers respectively. Adopting of agricultural technologies are a means of improving the smallholder farmers crop production, productivities and income generated from that farm activities. Therefore, any governmental and non-governmental institution should be focused on the outreach of these agricultural technologies to end user over all part of the country.
    
    VL  - 9
    IS  - 2
    ER  - 

    Copy | Download

Author Information
  • Agricultural Economics Research, Ethiopia Institute of Agricultural Research, Mehoni Agricultural Research Centre, Mehoni, Ethiopia

  • Agricultural Economics Research, Ethiopia Institute of Agricultural Research, Pawe Agricultural Research Centre, Pawe, Ethiopia

  • Abstract
  • Keywords
  • Document Sections

    1. 1. Introduction
    2. 2. Methodology of Research
    3. 3. Results and Discussion
    4. 4. Conclusion and Recommendation
    Show Full Outline
  • Conflicts of Interest
  • References
  • Cite This Article
  • Author Information