1. Introduction
Many of the excellent responses of Lanthanum gallium oxide (LaGaO
3), Lanthanum aluminate oxide (LaAlO
3) and Lanthanum indium oxide (LaInO
3) in its perovskite are outstanding due to its uniquely large electronic band gap
| [1] | Kim, Y., et al., Transport Properties of the La In O3/Ba SnO3 Interface Analyzed by Poisson-Schrödinger Equation. Physical Review Applied, 2022. 17(1): p. 014031. |
[1]
. Lanthanum aluminate oxide exhibits a large variety of electronic, structural and optical responses under applied external pressure. The researchers have been able to elucidate the mechanisms underlying the interface conductivity in LaAlO
3/SrTiO
3 systems
| [2] | Rubano, A. and D. Paparo, Optical Second Harmonic Generation on LaAlO3/SrTiO3 Interfaces: A Review. Materials, 2023. 16(12): p. 4337. |
[2]
. They have found that the formation of oxygen vacancies and charge transfer at the interface play crucial roles in modulating the electronic properties. By precisely tuning the growth conditions and controlling the thickness of the LaAlO3 film, it is possible to manipulate the conductivity and create novel devices with tailored functionality
| [3] | Oh, Y. S., et al., Polar Perturbations in Functional Oxide Heterostructures. Advanced Functional Materials, 2023: p. 2302261. |
[3]
. Furthermore, DFT calculations have shed light on various other intriguing properties of LaAlO3, such as its magnetic behavior, optical response, and mechanical properties. These studies have not only deepened our fundamental understanding of LaAlO
3 but have also paved the way for its potential applications in fields like catalysis, energy storage, and optoelectronics
| [4] | Reaz Rahman, I., Analytical modeling of electrostatic and transport phenomena in inversion-type inGaAs nanowire MOSFET. 2021. |
[4]
. Woodward and Lufaso analysis shows how cubic ABX
3 perovskites such as LaGaO
3 and LaAlO
3 can go into phase transition when subjected to some limits of external pressure
| [5] | Surendran, K. and R. Ubic, Perovskites. Microwave Materials and Applications 2V Set, 2017: p. 81-148. |
[5]
. This work uses computational analysis of the structural, electronic, and optical responses in both high temperature and pressure ranges to produce calculations of the cubic perovskite Lanthanum Aluminate (LaAlO
3) crystal structure. The crystalline s tructures of LaGaO
3 and LaInO
3 are characterized by their perovskite arrangement, consisting of layers of oxygen atoms sandwiched between lanthanum and gallium ions
| [6] | Jaiswal, N., et al., A brief review on ceria based solid electrolytes for solid oxide fuel cells. Journal of Alloys and Compounds, 2019. 781: p. 984-1005. |
[6]
. This unique structure imparts exceptional qualities to LaGaO
3, making it an ideal candidate for various applications, particularly in solid oxide fuel cells (SOFCs)
| [7] | Tarutin, A. P., et al., Chemical design of oxygen electrodes for solid oxide electrochemical cells: A guide. Sustainable Energy Technologies and Assessments, 2023. 57: p. 103185. |
[7]
.
is bonded to twelve (12) equivalent
atoms from LaO
12 cuboctahedral that share corners with 12 equally (LaO
12) cuboctahedra and its face with eight equivalents (AlO
6, GaO
6, InO
6) octahedral. All La-O bond lengths are 2.77
and Al-O, Ga-O, and In-O bond length values are 1.69
, 1.96
| [8] | Asthagiri, A. and D. S. Sholl, Pt thin films on the polar La Al O 3 (100) surface: A first-principles study. Physical Review B, 2006. 73(12): p. 125432. |
[8]
and 2.19-2.22
is bonded in a distorted geometry to four
and two equally
the atom as well as
is bonded in a five coordinates geometry to three equally
and Two equally
atoms. Computed possible oxidations states
,
,
,
and
respectively. Lanthanum aluminate (LaAlO
3), Lanthanum gallate (LaGaO
3) and Lanthanum indium oxide (LaInO
3) are considered excellent candidate in the forthcoming advanced perovskite materials analysis in the optoelectronic device because of their valuable impact electronic and optical responses. Theoretical computed results mostly emphasized the material's electronic band tuning, optical conductivity response, and hardness impacts
| [9] | Molla, M. R., et al., Electronic phase transition from semiconducting to metallic in cubic halide CsYbCl3 perovskite under hydrostatic pressure. Physica B: Condensed Matter, 2022. 630: p. 413650. |
[9]
. LaAlO
3 and LaInO
3 are perovskite oxides that have attracted attention due to their interesting properties, including their optical behavior under external pressure. The optical properties of materials can be investigated using techniques such as spectroscopy, ellipsometry, and reflectivity measurements
| [10] | Ermolaev, G. A., et al., Broadband Optical Properties of Bi2Se3. Nanomaterials, 2023. 13(9): p. 1460. |
[10]
. H. Zhang, X. Zheng, and J. Wu examined the pressure-dependent optical properties of LaAlO
3 using a diamond anvil cell and spectroscopic ellipsometry. They found that the optical bandgap of LaAlO
3 increased with increasing pressure
| [11] | Kimura, S.-i. and H. Okamura, Infrared and terahertz spectroscopy of strongly correlated electron systems under extreme conditions. Journal of the Physical Society of Japan, 2012. 82(2): p. 021004. |
[11]
. Durante et al. investigated the effect of pressure on the optical properties of LaAlO
3 using in situ optical reflectivity measurements. They observed a pressure-induced phase transition in LaAlO
3 and identified changes in its optical properties. Regarding LaInO
3, there appears to be relatively fewer studies specifically focusing on its optical properties under pressure. However, research on the general properties and behavior of LaInO
3 may provide some insights. One relevant study is titled "Electrical and optical properties of epitaxial LaInO
3 thin films. This study discussed the electrical and optical properties of LaInO
3 thin films and their potential applications. It was described that it has small lattice coefficient distortion, lesser dielectric coefficient, excellent chemical stability in its ground state and can be produced easily
| [12] | Bérardan, D., et al., Colossal dielectric constant in high entropy oxides. physica status solidi (RRL)–Rapid Research Letters, 2016. 10(4): p. 328-333. |
[12]
. In current times, the call for a reduces in working temperature is to enhances the efficiency as well as also increase of the SOFC. Other oxides family represent unsatisfied ionic conductivity as compared to perovskite oxides nature. The Perovskite domestic represent increased oxygen ion diffusion with the support of fractional exchange of its cations with smaller valence cations. Scientific media are appealing to these materials by showing the rapid development of the perovskite field existing in the study of the structural, electronic, mechanical and optical response of LaXO
3 (X = Al, In, Ga). In the present research, neither experimental nor computational data exists for this substance, and current theoretical predictions of their response under pressure are justified. The main objective of research is to explore the electronic, structure and optical responses of LaXO
3 (X = Al, In, Ga) under applied external pressure. The present work explores the electronic and optical responses of LaXO
3 (X = Al, In, Ga) perovskite oxides for optoelectronic applications.
2. Computational Approach
First principles computations based on the DFT framework were performed by analyzing the CASTP Code simulation program (material studio). This technique creates faster and easier calculations, which enhance efficiency. This technique employs faster computing, which increases efficiency. This projector augmented wave-based norm converging pseudopotentials were used to obtain the ion and electron interactions
| [13] | Blöchl, P. E., O. Jepsen, and O. K. Andersen, Improved tetrahedron method for Brillouin-zone integrations. Physical Review B, 1994. 49(23): p. 16223. |
[13]
. Under norm-converging pseudopotentials employed for cubic LaAlO
3, LaGaO
3 and orthorhombic LaInO
3 the electronic states of (La, Al, Ga, In, O)-states were constructed
| [14] | Krukau, A., et al., Range-Separated Local Hybrids. J. Chem. Phys, 2006. 125: p. 224106. |
[14]
. To modify the electronic band structure, PDOS, EPDOS, TPDOS and DOS
| [15] | Pan, L.-Y., et al., Constructing a built-in electric field in monolayer g-C3N4 by carbon and oxygen co-doping for enhanced photocatalytic oxidation of toluene to benzaldehyde activity. Surfaces and Interfaces, 2022: p. 102601. |
[15]
, on a mesh value, the Monkhorst-pack strategy is analyzed to describe Brillouin zone interaction. Hybrid functional incorporating a fraction direct inked with Hartree-Fock exchange-correlation into the short range. Computed knowledge of the structural parameters of LaXO
3 (X = Al, In, Ga) allows the main predictions of the unit cell volume evolution of the crystal structure in solids under the impact of hydrostatic pressures as well as consequently that its parameter, which indicates the important key factors computed under pressure affect other parameters
| [16] | Catalano, S., et al., Rare-earth nickelates RNiO3: thin films and heterostructures. Reports on Progress in Physics, 2018. 81(4): p. 046501. |
[16]
. Nowadays, many researchers take a personal interest in the stranded hybrid functional (HSE06) estimates of the tuning of electronic band gap
| [17] | Noh, J., et al., A density functional theory investigation of the electronic structure and spin moments of magnetite. Science and technology of advanced materials, 2014. |
[17]
. The perovskite structures LaAlO
3, LaInO
3 and LaGaO
3 were finally optimized without any constraints on volume and structure parameters. The wave function electronic structure is prolonged by an interesting set of plane waves with a cut-off energy of 600eV. Under first Brillion zone, the automatically created 6x6x4 Monkhorst pack set of valuable K-symmetries has been analyzed
| [18] | Monkhorst, H. J. and J. D. Pack, Special points for Brillouin-zone integrations. Physical review B, 1976. 13(12): p. 5188. |
[18]
. In GGA exchange and E
xc depend on the density of electrons.
(1)
Where = 0.26
Under present important conduction, the hybrid functional (HSE06) is given by the following equation
(2)
The HSE06 gives improved results for (binding energy), (total energy)as well as (structural parameters) of material but has some limitations for extremely correlated systems and is comparable to GGA approximation
| [19] | Lin, J., et al., Green Diamond: A Superhard Boron Carbonitride with Bandgap in Green-Light Region and Anisotropic High Carrier Mobilities. The Journal of Physical Chemistry Letters, 2023. 14: p. 3403-3412. |
| [20] | Mohebbi, E., et al., Stability, phonon calculations, electronic structure and optical properties of VO2 (M) nanostructure: A comprehensive DFT study. Frontiers in Materials, 2023. 10: p. 62. |
[19, 20]
. In computing these properties, the convergence condition for total energy associated in the self-consistent field iteration was fixed to 1x10
-8eV, and geometry optimizations have been obtained under relaxations until the (Hellmann Feynman)-force component on every atom is less as compared to 0.001eV/ Å
| [21] | Ortiz Almazo, A. F., Computational study of the mechanical properties of the Clay/Graphene composite. 2022. |
[21]
. To bolster the excellent accuracy of the computations, we also access the norm convergence pseudopotentials employed (CASTEP) code to modify the structure and compute the possible response
| [22] | Faucher, A., V. V. Terskikh, and R. E. Wasylishen, Feasibility of arsenic and antimony NMR spectroscopy in solids: an investigation of some group 15 compounds. Solid State Nuclear Magnetic Resonance, 2014. 61: p. 54-61. |
[22]
. Finally, during the computation of different responses like band gap tuning and optical characteristics the energy tolerance was noted as 5x10
-6eV per atom, the impact of stress tolerance was 0.02Gpa and the displacement tolerance was 5x10
-4 Å
| [23] | Vittoria, C., Novel Epitaxial Films of Magnetoelectric Hexaferrite Materials. 2018, NORTHEASTERN UNIV BOSTON MA BOSTON United States. |
[23]
.
3. Results and Discussions
3.1. Structural Properties
The Heydscuseria-Ernzerhof screened hybrid functional (HSE06) approach is employed to optimize the cubic crystal structure of LaXO
3 (X = Al, In, Ga) perovskite oxide. In the case of LaAlO
3 La-atoms to be fixed at the corner whykof positions (0, 0, 0), the X-atoms are exactly placed at the body-centered positions (1/2, 1/2, 1/2) and the O-atoms exist at the face-centred directions (0.62, 0.05, 025). With four La-atoms and four (X= Al, Ga, In)-atoms as well as oxygen twelve-atoms per unit cell as shown in
figure 1. In the current case, the main strength of the intra-site repulsion for (La-d) states is computed by considering previously studied parallel structures. Lattice coefficients and some structural constants are computed by fitting the Vinet equation of states. The ground state energy of the crystal structures LAO, LIO and LGO are computed with help of Birch Murnaghan's approach of using HSE06 functional.
(v) = ) –( (3)
is symbolized by bulk modulus, volume at zero pressure, V volume of the unit cell.
E (V) = (4)
P(V) ={ (5)
Where and at the zero-pressure energy and volume condition respectively, x = and , B is called its pressure derivative.
Figure 1. Optimized crystal structure of (a) LaAlO3, (b) LaInO3 and (c) LaGaO3.
Below is the structure assembly for the unit cell of LaXO
3 (X= Al, Ga, In). The Murnaghan-state mathematical statement was employed to compute equilibrium lattice coefficients while keeping the total energy of the crystal lattice low, and results were computed for various lattice parameters
| [24] | Mokhtari, D., et al., Structural, electronic, magnetic and thermoelectric properties of inverse Heusler alloys Ti2CoSi, Mn2CoAl and Cr2ZnSi by employing Ab initio calculations. Philosophical Magazine, 2020. 100(12): p. 1636-1661. |
[24]
. As a function of the volume of the unit cells LaAlO
3, LaInO
3 and LaGaO
3, the total amount of energy has been computed about the volume of equilibrium cell V. perovskite crystal structure was dependent on (X= Al, Ga, In)-O
6 octahedron network with clearly defined corner connection between the neighboring octahedrons. value of the optimized lattice parameter and experimental data as well as theoretical lattice parameters calculated by different approaches for comparison. Our current computed lattice constants from the stranded density functional theory (DFT) computations are LaAlO
3 (a = b = c = 3.44Å), LaInO
3 (a = 5.15, b = 5.4, c = 7.3Å) and LaGaO
3 (a = 5.4, b = 4.8, c = 7.2 Å) which are in excellent agreement with experimental data within very small noted error of about 0.9%. This computed data is in a few ways consistent with the previously reported data in
Table 1.
Table 1. Geometry optimized lattice parameter volume of LaAlO3, LaInO3 and LaGaO3,
Material | Lattice Parameters (Å) |
| a | b | C | Volume (Å) |
Experimental Result (LaAlO3) | [25] | Tran, Q. N., et al., Transition metal B-Site substitutions in LaAlO3 perovskites reorient bio-ethanol conversion reactions. Catalysts, 2021. 11(3): p. 344. |
[25] | 3.810 | 3.810 | 3.810 | 55.306 |
Experimental Result (LaGaO3) | [26] | Ubic, R. and G. Subodh, The prediction of lattice constants in orthorhombic perovskites. Journal of alloys and compounds, 2009. 488(1): p. 374-379. |
[26] | 5.47 | 7.76 | 5.60 | 237.4 |
Experimental Result (LaInO3) | [26] | Ubic, R. and G. Subodh, The prediction of lattice constants in orthorhombic perovskites. Journal of alloys and compounds, 2009. 488(1): p. 374-379. | | [27] | Kumar, A. and A. Verma, Lattice constant of orthorhomic perovskite solids. Journal of alloys and compounds, 2009. 480(2): p. 650-657. |
[26, 27] | 5.72 | 8.20 | 5.90 | 276.7 |
Present Result (LaAlO3 at 0-GPa) | 3.44 | 3.44 | 3.44 | 40.7 |
Present Result (LaInO3 at 0-GPa) | 5.15 | 5.41 | 7.36 | 205.1 |
Present Result (LaGaO3 at 0-GPa) | 5.46 | 4.8 | 7.2 | 188.7 |
Present Result (LaAlO3 at 20-GPa) | 3.41 | 3.41 | 3.41 | 39.65 |
Present Result (LaInO3 at 20-GPa) | 5.08 | 5.32 | 7.27 | 196.5 |
Present Result (LaGaO3 at 20-GPa) | 5.42 | 4.60 | 7.10 | 177.0 |
Present Result (LaAlO3 at 40-GPa) | 3.38 | 3.38 | 3.38 | 38.61 |
Present Result (LaInO3 at 40-GPa) | 5.02 | 5.30 | 7.2 | 191.6 |
Present Result (LaGaO3 at 40-GPa) | 5.4 | 4.7 | 7.1 | 180.2 |
Present Result (LaAlO3 at 60-GPa) | 3.06 | 3.06 | 3.06 | 28.65 |
Present Result (LaInO3 at 60-GPa) | 5.02 | 5.31 | 7.27 | 193.7 |
Present Result (LaGaO3 at 60-GPa) | 5.3 | 4.5 | 7.0 | 57.29 |
Present Result (LaAlO3 at 80-GPa) | 3.33 | 3.33 | 33.3 | 166.9 |
Present Result (LaInO3 at 80-GPa) | 4.75 | 5.38 | 7.24 | 185.0 |
Present Result (LaGaO3 at 80-GPa) | 4.7 | 5.2 | 6.9 | 168.6 |
We introduced that there is no experimental and theoretical evidence for LaAlO3, LaInO3 and LaGaO3 in the literature to compare. As data, our computed conclusions will be confirmed by future measurements. The computed values are very consistent with the calculated (3.810Å) and experimental data (3.811Å).
3.2. Electrons Properties
Electronic properties refer to the characteristics and behaviors of materials or systems related to their electronic structure and the behavior of electrons within them. These properties play a crucial role in determining the functionality and performance of various electronic devices and materials. Conductivity is a measure of how easily a material allows the flow of electric current. Materials can be classified as conductors, semiconductors, or insulators based on their conductivity. Conductors have high conductivity, allowing the easy flow of electrons, while insulators have low conductivity, restricting the flow of electrons. Semiconductors have intermediate conductivity. The term band structure refers to the arrangement and distribution of energy levels, called bands, that electrons can occupy within a solid material. The band structure determines whether a material is a conductor, semiconductor, or insulator. It also affects the electrical and optical properties of the material. Energy levels represent the allowed energy values that electrons can have within a material. The arrangement of energy levels determines the electronic transitions that can occur, such as absorption or emission of photons. Energy levels are typically represented as discrete energy states or energy bands in the band structure. After the structure response discussion, we will now explain the electronic properties of LaXO
3 (X=Al, Ga, In). understanding the electronic impact of perovskite materials requires studying the electronic band gap, TPDOS/EPDOS and TDOS density of states
| [28] | Anwar, A. W., M. Moin, and A. Ali, Computational Comparative Analysis of (Ag, In)-Doped Laalo3 for Optoelectronic Application: A First-Principles Study. Available at SSRN 4281359. |
[28]
. The electronic band gap is a valuable key in indicating complete knowledge about the possible energy type of utilized and inactive electrons and their movement from VB maxima to CB minima
| [29] | Rafique, M. D. and S. Gillani, Isotropic pressure-induced electronic band structure of BaTiO3, SrTiO3 and CaTiO3 with its impact on structural and optical properties: ab-initio calculation. Molecular Simulation, 2022: p. 1-15. |
[29]
. The basic purpose of band gap tuning is to understand the families of different materials whether they are metal, non-metal or semiconductor
| [30] | Hong, G., et al., Controlling the growth of single-walled carbon nanotubes on surfaces using metal and non-metal catalysts. Carbon, 2012. 50(6): p. 2067-2082. |
[30]
. There are two types of allowed band regions in every compound and electron energy determines which region exists. The assortment of energy value between these two allowed gaps is usually denoted by forbidden/Fermi level. Under the effect of pressure, the computed electronic band structures of LaAlO
3, LaInO
3 and LaGaO
3 using Various DFT techniques along high symmetric directions in the first BZ were illustrated in
Figure 2 at 0 GPa -80 GPa.
3.3. Electronic Band Structure of LaAlO3
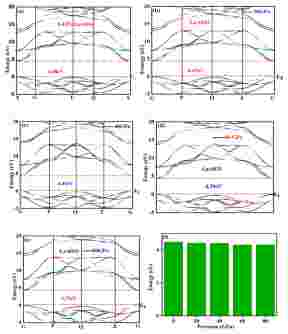
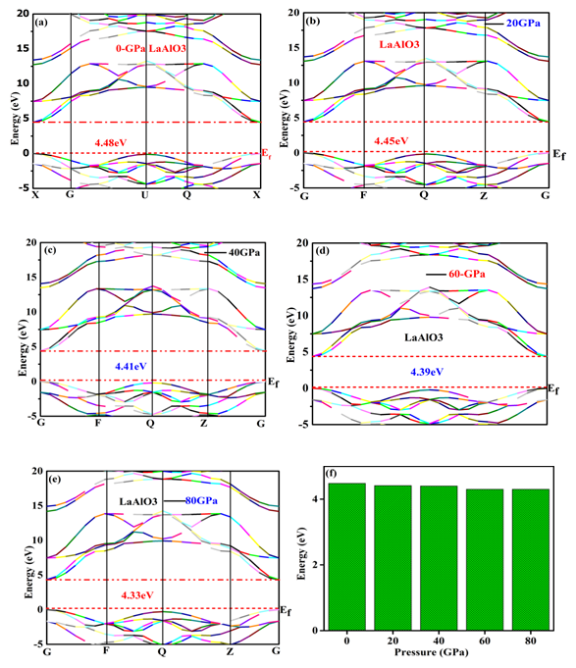
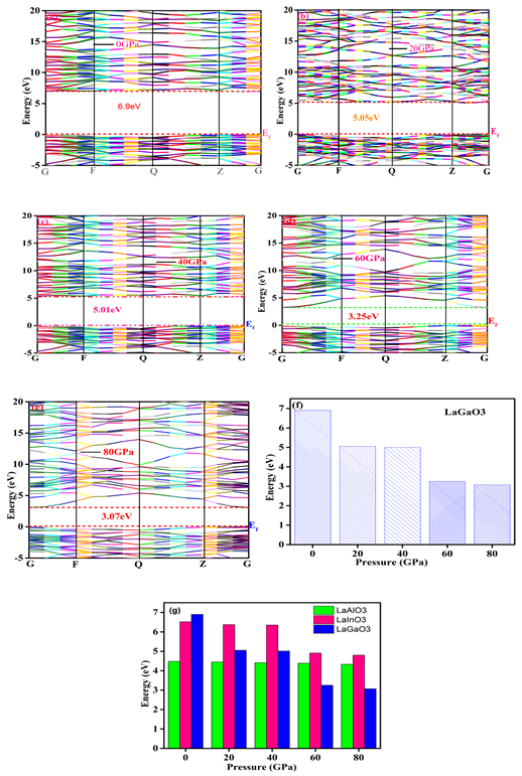
Figure 2. Before and after applied stress band structure of LaAlO3, (a) at 0GPa, (b) at 20GPa, (c) at 40GPa, (d) at 60GPa, (e) at 80GPa and (f) trends of electronic band gaps.
The electronic band gap of LaAlO
3 remains indirect when pressure is enhanced from 0 to 80GPa due to the existence of VB maxima at symmetric point Q and CB minima at the gamma point G. Electronic band structure gives value to the energy ranges that are helpful in which it is a possible number of electrons to present (energy band) and the area where there are no existing electrons (band gap)
| [31] | Rizwan, M., et al., A review on perovskite lanthanum aluminate (LaAlO3), its properties and applications. Materials Research Express, 2019. 6(11): p. 112001. |
[31]
. Under the increment of external pressure from (0GPa to 80GPa), its important impact on the tuning of electronic band gaps permanently decreased. The main description of the energies and their bands gives a lot of important knowledge about materials' physical qualities. The electronic band structure determines the BG which has a major impact on the optical response.
Figure 3a-3f shows that the band gap of pure LaAlO
3 obtained from the HSE06 functional were 4.48eV, 4.45eV, 4.41eV, 4.39 eV and 4.33eV at a pressure increased from 0GPa to 80GPa respectively. The band gap of LaAlO
3 is underestimated compared with the previously reported value of the band gap is 5.65eV
| [32] | Ilyas, B. and B. Elias, A first principles study of the phonon anharmonicity, electronic structure and optical characteristics of LaAlO3. International Journal of Computational Physics Series, 2018. 1(1): p. 161-180. |
[32]
. Electronic band structure shows that LaXO
3 (X = Al, In, Ga) is a semiconductor with indirect band gap and an optically inactive response up 20GPa, while the band gap becomes direct at gamma points (G-X-Q) at 80GPa and the band gap changes from indirect to direct nature. This change in the band gaps occurs due to the external isotropic pressure of O-2p-orbitals in VB and Al-3d-orbitals in CB. it is observed that at zero external pressure the top of the VB is at (X-U) symmetry point, while the bottom of the conduction band is located at (X) symmetry point. Hence, Lanthanum aluminate oxide at zero external pressure is an indirect bandgap semiconductor. A similar bandgap nature for the compound at zero pressure is also discussed by a previous analysis by Yuan et al. which is comparable to our current computed results. Additionally, when we enhance applied external pressure, the top of the VB at G shifts to the Fermi level and it shifts away from the Fermi level at symmetry points (U, Q), changing to a direct bandgap (G-X) in the whole pressure range. The transformation from indirect band gap to direct band of LaAlO
3 with external pressure expects some excellent results which are potential candidate and represent its effectiveness in large frequency optoelectronic responses.
3.4. Electronic Band Structure of LaInO3
Under the impact of isotropic pressure on the electronic band gap of LaInO
3 and its computations are done at the enhanced pressure of 0GPa to 80GPa. The calculated band structure, as depicted in
Figure 4(a, e), illustrates that the Valence Band Maximum (MVB) and Conduction Band Minimum (MCB) do not align at the same points, indicating an indirect behavior of the band gap. Upon computation, it is evident that the electronic band gap tuning of pure and doped LaInO
3 is influenced by external factors such as pressure and concentration. Specifically, when subjected to external pressure or altered concentrations, the band gap trends towards a decrease. Furthermore, the Fermi level is observed to shift further into the conduction band, showcasing p-type characteristics. In this context, isotropic pressure emerges as a facilitator for promoting electronic transitions compared to LaInO
3 without external pressure. This observation underscores the significance of external environmental factors in modulating the electronic properties of LaInO
3.
Moreover, the variation in electronic responses between LaInO3 and LaAlO3 can be directly linked to the predominant contribution of La-4d and In-4d states in their respective band structures. This indicates that the modification of the electronic band structure is intricately tied to the manipulation of these specific electronic states, highlighting the potential for tailored tuning of material properties through targeted alterations in composition and external conditions.
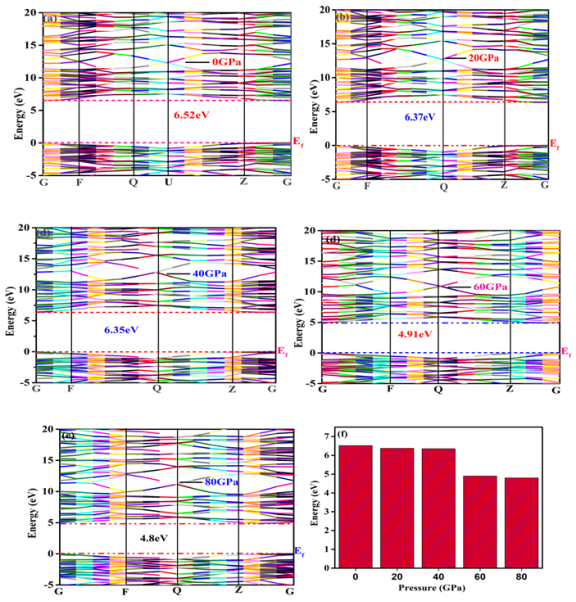
Figure 3. Before and after applied stress band structure of LaInO3, (a) at 0GPa, (b) at 20GPa, (c) at 40GPa, (d) at 60GPa, (e) at 80GPa and (f) trends of electronic band gaps.
From the above figures the computed tuning of electronic band gap values is 5.51eV, 5.08 eV, 5.02 eV, 5.01 eV and 4.84 eV at applied external isotropic pressures of 0GPa, 20GPa, 40GPa, 60GPa and 80GPa. In current computed values of the electronic band gap are comparable with experimental and theoretical 4.33eV data already reported
| [33] | Hartley, P., et al., Experimental and theoretical study of the electronic structures of lanthanide indium perovskites LnInO3. The Journal of Physical Chemistry C, 2021. 125(11): p. 6387-6400. |
[33]
. The mobile of the valance band electron after incrementing external pressure shifted from the valance band to the conduction band and the fermi level shifted near the conduction band continuously It is observed that at zero external pressure, the top of the valence band (VB) is situated at the (G-Z) symmetry point, while the bottom of the conduction band is positioned at the (G-F) symmetry point. Consequently, Lanthanum indium oxide exhibits an indirect bandgap semiconductor behavior under these conditions. This bandgap characteristic at zero pressure aligns with findings from a previous analysis by Yuan et al., which is consistent with our current computational results. Furthermore, as we increase the applied external pressure, there is a notable shift in the position of the VB top at the Γ point, moving towards the Fermi level. Simultaneously, it moves away from the Fermi level at symmetry points (G, U), leading to a transition to a direct bandgap (G-Z) across the entire pressure range. The transformation from indirect band gap to direct band of LaInO
3 with external pressure expects some excellent results which are potential candidate and represent its effectiveness in large frequency optoelectronic responses. When large external pressure is applied, the change in crystal lattice parameters is confirmed and its impact on its results is strong atomic interaction enhanced which leads to the production of delocalized electrons. In
figure 4f the trends of band gap LaInO
3 decreased continuously with increasing external pressure and fermi levels also shifted continuously from valance band to conduction band due to the movement of free electrons in valance band.
3.5. Electronic Band Structure of LaGaO3
Figure 4. Before and after applied stress band structure of LaGaO3, (a) at 0GPa, (b) at 20GPa, (c) at 40GPa, (d) at 60GPa, (e) at 80GPa, (f) trends of electronic band gap and (g) Comparison B/w band gaps.
Since conventional density function theory employs HSE06 to estimate the excited and ground state energies, the calculated band gaps of LaGaO
3 are compared to experimental calculations. Among them, Hybrid functional obtained better band gaps but below the experiment values of LaGaO
3 4.48eV
| [34] | Luo, B., et al., Electronic, dielectric and optical properties of orthorhombic lanthanum gallate perovskite. Journal of Alloys and Compounds, 2017. 708: p. 187-193. |
[34]
. The influence of external pressure on the tuning of the electronic band gap is mitigated by the transitions of valence electrons into the conduction region and the subsequent increase in the number of holes remaining in the valence band. This phenomenon diminishes the susceptibility of the material to external pressure, thereby reducing its impact on band gap modulation. The computed value of the band gap is 6.92eV, 5.05eV, 5.02 eV, 3.25 eV and 3.07eV at different pressure respectively. The observed trends unequivocally demonstrate that both direct and indirect bandgaps increase with rising pressure. This enhancement in bandgaps directly correlates with the reduction in lattice coefficients of the materials under increased external pressure. The inverse relationship between lattice constants and bandgaps has been consistently observed in both experimental and theoretical studies. Understanding the nature of the electronic band gap serves as a fundamental framework for comprehending the properties of optoelectronic semiconductor materials. The particle density of states (TDOS) elemental partial density of states (EPDOS) and total partial density of states (TPDOS) of LaAlO
3, LaInO
3 and LaGaO
3 were computed under the external pressure as shown in
figure 5.
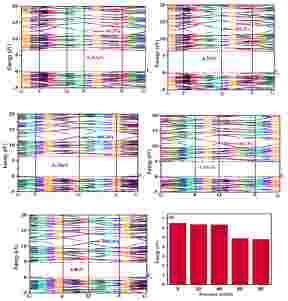
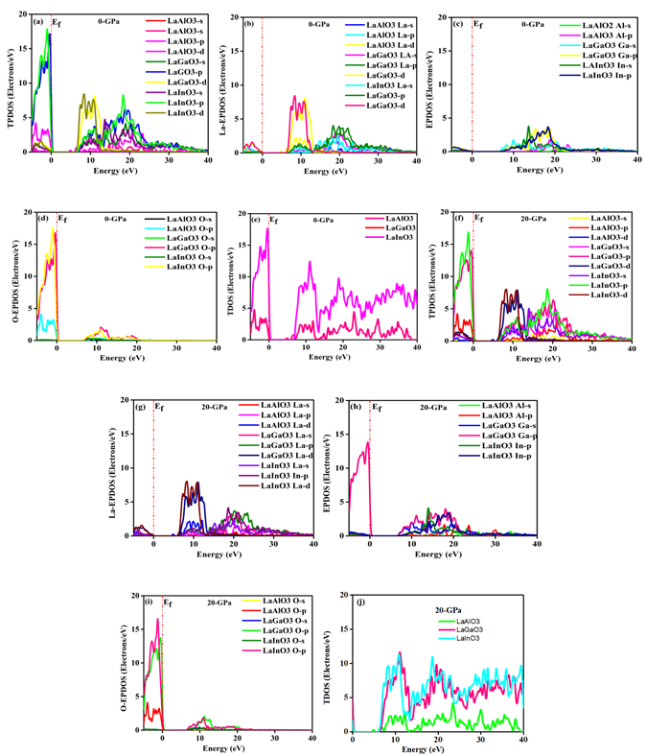
Figure 5(a, j) computes the density of states, the partial density of states, the elemental partial density of states and the total density of states under the external pressure which increased from 0GPA to 20GPa giving us information about the electron distributions in the spectrum distribution. The maximum peak contribution in the case of TPDOS of LaInO
3-3p state is 17.84 at the energy range 0.94eV in the valance band and the energy peak shifted from -5eV to 0.31eV at 0GPa external pressure respectively. After the mobile of the valance outermost electron from the valance band to the conduction band the strong minimum contribution of In-5p states at the 18.23eV energy range shown in CB and fermi level shifted more in CB. From
figure 5f when the external pressure is increased from 0GPa to 20GPa the maximum two strong contribution peaks of In-5p and In-3d 16.8, 8.0 at -1.34eV, 18.7eV energy range respectively. In
figure 5(b-g) the EPDOS of La-LAXO
3 (X= Al, In, Ga) is adjusted from 6.3eV to 12.74eV, where the conduction band is absorbed by LIO-3d and LGO-3d states. Moreover, the pressure is increased from 0 to 20GPa equally contribution peaks are LIO-5d, LGO-3d states 7.9 at 10.8ev and the energy range is shifted from 5.9eV to 12.8eV respectively. From
figure 5(c, h) we can see a maximum involvement of Ga-2s and In-3p states, then In-O-3p and Ga-O-3 p states as upper VB in the energy range from -5eV to -0.01eV respectively. Moreover, In-p has major contributions at 18.36eV and Al-p minor contribution at -4.05eV but in all cases, maximum involvement is shown in the conduction band. In
figure 5(e, j) the TDOS is computed for the strong contribution peak LaInO
3 17.5 at energy range -0.28eV and it also shows the maximum transition of electrons from VB to CB. After increasing and having an important impact on TDOS the maximum contribution in the energy range is 12.5eV and the strongest contribution is only in the conduction band.
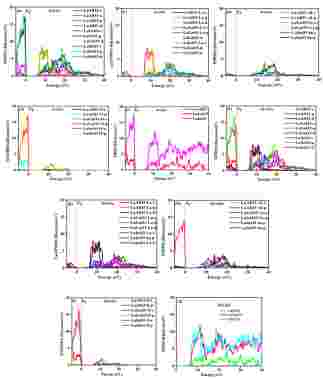
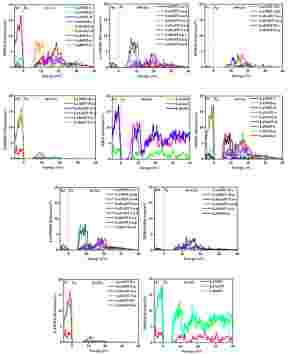
Figure 5. Before and after applied external pressure of LaXO3 (a) TPDOS at 0GPa (b) La-EPDOS at 0GPa (c) Al-EPDOS at 0GPa, (d) O-EPDOS at 0GPa (e) TDOS at 0GPa, (f) TPDOS at 20GPa, (g) La-EPDOS at 20GPa, (h) Al-EPDOS at 20GPa (i) O-EPDOS at 20GPa and (j) TDOS at 20GPa.
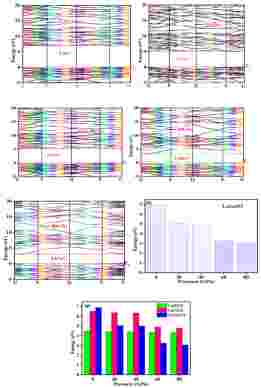
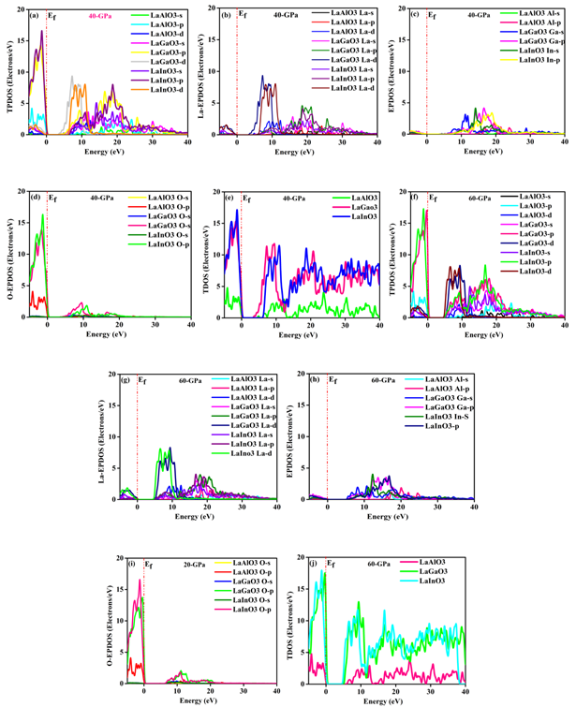
Figure 6. Before and after applied external pressure of LaXO3 (a) TPDOS at 40GPa (b) La-EPDOS at 40GPa (c) Al-EPDOS at 40GPa, (d) O-EPDOS at 40GPa (e) TDOS at 40GPa, (f) TPDOS at 60GPa, (g) La-EPDOS at 60GPa, (h) Al-EPDOS at 60GPa (i) O-EPDOS at 60GPa and (j) TDOS at 60GPa.
In
Figure 6a-6f, a notable shift in Total Projected Density of States (TPDOS) energy is observed, spanning from -5.0eV to 0.24eV. This shift is predominantly influenced by the In-3p and Ga-3p states, which prominently contribute to the upper Valence Band (VB) region compared to other states. Conversely, in
Figure 6(b, c, g, h), a distinct emphasis on Ga-5d states is evident, with an energy range adjustment ranging from 3.6eV to 12.7eV, characterizing the obtained conduction band. Additionally, the Electron Projected Density of States (EPDOS) of Al, Ga, and In exhibit significant involvement following the energy range shifts, spanning from 7.0eV to 21.14eV. Notably, the Ga-5d states display a maximal contribution at 16.44eV compared to other peaks, highlighting their substantial influence in the system. From
figure 6(d, i), the strong contribution of In-O-3p states and energy peak shifted between -5.1eV and 0.37eV. In the case of TDOS, when external pressure increased from 40GPa to 60GPa, the strong involvement of In-states and secondly Ga-states as well as the maximum movement of free electrons from VB to CB and left holes in VB. After enhancing the isotropic pressure, we saw the major change noted in all cases of TPDOS. EPDOS and TDOS as well as the maximum involvement of electrons noted in CB.
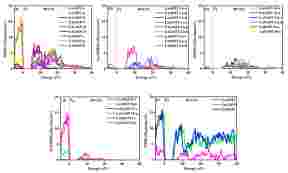
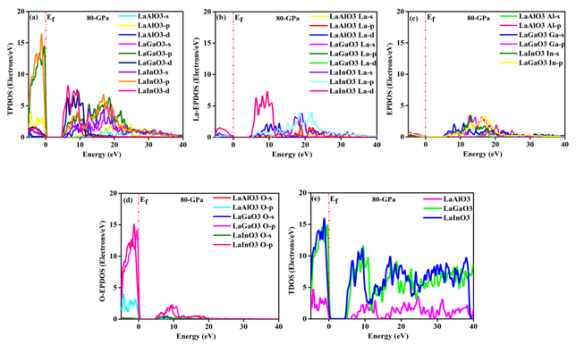
Figure 7. Before and after applied external pressure of LaXO3 (a) TPDOS at 80GPa (b) La-EPDOS at 80GPa (c) Al-EPDOS at 80GPa, (d) O-EPDOS at 80GPa and (e) TDOS at 80GPa.
From
figure 7(a, f) computed the TPDOS of LAXO
3 (X= Al, In, Ga) we see that CB has a maximum contribution of In-5d states is 8.1 at energy range 6.5eV respectively. However, CB is contributed by In-3p states in the energy range of -5eV to 0.11eV. The best knowledge to understand the electronic band gap these states are moving toward the conduction band and this is the main cause of decrease in the band gap. In
figure 7(b, g) the energy range of about 12.2eV consisted of In-s states representing a sharp peak due to its large localizations. When the energy range shift from -5eV to 0.24eV points were usually caused by O-2s states and pressure impact feathers. The energy ranges from -5eV to 0.51eV mainly consists of In-3p and Ga-3p states. In
figure 7e after increasing the external pressure 60GPa to 80GPa we observed notable peaks changing accounts. The maximum strong contribution in cause of TDOS is L-In states at energy range shifted from 4.48eV to 39eV. the movement of a large number of electrons from VB to CB the fermi level shifted more into CB and the conductivity of these materials was enhanced. Computed results above were done without accounting for coulomb correlations and set the 4f states
| [35] | Piyanzina, I., et al., Electronic properties of LaAlO3/SrTiO3 n-type interfaces: a GGA+ U study. Journal of Physics: Condensed Matter, 2017. 29(9): p. 095501. |
[35]
. Keep in mind, the effect of 4f states electrons on the lattice constant, internal coordinates, and bond length is very small
| [36] | Rahmanizadeh, K., et al., First-principles study of intermixing and polarization at the DyScO3/SrTiO3 interface. Physical Review B, 2012. 85(7): p. 075314. |
[36]
. Subsequently, electronic responses for d-electrons and f-electrons are sensitive to the post-GGA function approach
| [37] | Michaelides, A. and M. Scheffler, An introduction to the theory of metal surfaces. Textbook of Surface and Interface Science, 2010. 1. |
[37]
. Under this view, we strongly agree that the hybrid function (HSE06) correlated d-states and f-states
| [38] | Krcha, M. D. and M. J. Janik, Challenges in the use of density functional theory to examine catalysis by M‐doped ceria surfaces. International Journal of Quantum Chemistry, 2014. 114(1): p. 8-13. |
[38]
. The Generalized Gradient Approximation (GGA) is computationally efficient and generally provides accurate results for a broad range of LaXO3 materials (where X = Al, In, Ga). However, it tends to underestimate responses related to electronic band structure. In contrast, the Hybrid functional HSE06 offers superior accuracy, particularly for electronic band gaps and density of states (DOS), including projected DOS (PDOS) and electronic partial DOS (EPDOS), for pure materials. However, this improved accuracy comes at a higher computational cost. Ultimately, employing the HSE06 hybrid functional yields compelling evidence for band gap engineering and DOS properties of LaXO3 compounds (with X = Al, In, Ga). The computed results obtained using the HSE06 functional exhibit excellence and closely resemble experimental findings compared to those obtained with the GGA functional.
3.6. Optical Properties
The optical response, which results from shifts between VB and CB, may be recognized by its propensity to absorb light
| [39] | Huang, Y., et al., The application of perovskite materials in solar water splitting. Journal of Semiconductors, 2020. 41(1): p. 011701. |
[39]
. This impact on optical response is an illustration of electromagnetic radiation
| [40] | Maier, S. A. and H. A. Atwater, Plasmonics: Localization and guiding of electromagnetic energy in metal/dielectric structures. Journal of applied physics, 2005. 98(1): p. 10. |
[40]
. Understanding the optical characteristics of LaXO
3 (X = Al, In, Ga) are also clearly inked with their band gaps tuning which is very helpful for many applications. The effect of pressure and its impact on optical tunings like refractive index, dielectric function, energy loss function, reflectivity, extinction coefficient and absorptions factors
| [40] | Maier, S. A. and H. A. Atwater, Plasmonics: Localization and guiding of electromagnetic energy in metal/dielectric structures. Journal of applied physics, 2005. 98(1): p. 10. |
[40]
. The interaction of incident photons with a solid can be identified with imaginary dielectric function as follows:
The real part is denoted by
r and
| [41] | Shi, Y., et al., Study the relation between band gap value and lattice constant of MgTi2O4. Journal of Alloys and Compounds, 2019. 788: p. 891-896. |
[41]
the imaginary part is
2. The imaginary part predicts the real parts, derived from the Kramer-Kronig transformation approach
| [42] | Bao, H. and X. Ruan, Ab initio calculations of thermal radiative properties: The semiconductor GaAs. International journal of heat and mass transfer, 2010. 53(7-8): p. 1308-1312. |
[42]
;
.
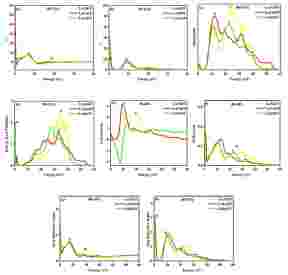
Figure 8 shows the change of ε
1(ω) in the type of incident electron or electron energy at different pressures (P=0, 80). Under the effect of pressure and its impact to see the variation clearly, we have displayed its low-range energy spectrum. We noted that with enhanced pressure values, the dielectric function is decreased but its maximum peaks of ε
1(ω) are increasing in trend and transfer towards the higher energies range
| [43] | Yaseen, M., et al., Phase transition and thermoelectric properties of cubic KNbO3 under pressure: DFT approach. Journal of Materials Research and Technology, 2021. 11: p. 2106-2113. |
| [44] | Awais, M., et al., First-principles calculations to investigate band gap of cubic BaThO3 with systematic isotropic external static pressure and its impact on structural, elastic, mechanical, anisotropic, electronic and optical properties. Journal of Physics and Chemistry of Solids, 2022. 169: p. 110878. |
[43, 44]
. When the applied pressure enhances the first root and the second root are increased up to 40GPa and 60GPa receptively and then the trend decreased. The valuable change in the peak around 21.1eV may be due to the transition of the indirect band gap at different pressures (P= 0, 80).
During electromagnetic radiations incident on the LAO
3, LIO
3 and LGO
3, the absorbance of light of specific frequency in perovskite materials can be employed by complex parts of dielectric functions
| [45] | Al-Shami, A., et al., Improved Power Conversion Efficiency with Tunable Electronic Structures of the Cation-Engineered [Ai] PbI3 Perovskites for Solar Cells: First-Principles Calculations. International Journal of Molecular Sciences, 2022. 23(21): p. 13556. |
[45]
. Dipole matrix element whose atoms are employed to calculate the transformation from the uncompleted to the completed band
| [46] | Oh, Y. J., et al., Dipole-allowed direct band gap silicon superlattices. Scientific reports, 2015. 5(1): p. 1-11. |
[46]
. The computed optical characteristics at 0GPa of three perovskite family as shown in
figure 8.
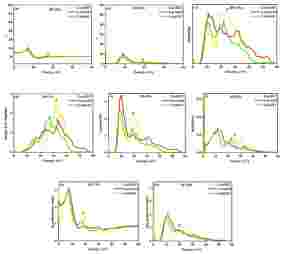
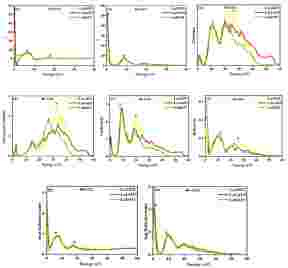
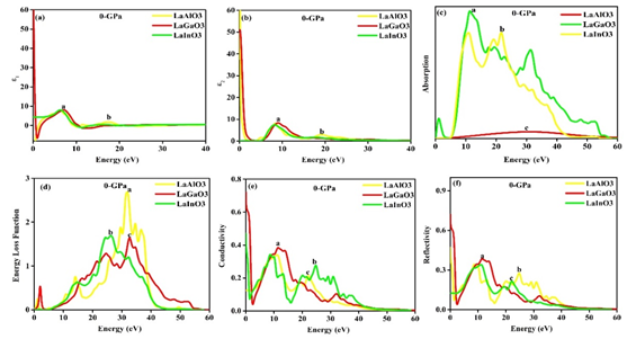
Figure 8. Before and after applied external pressure of LaXO3 (a) Real part of dielectric function at 0GPa, (b) Imaginary part of dielectric function at 0GPa (c) Absorption at 0GPa; (d) Energy loss function at 0GPa; (e) Conductivity at 0GPa, (f) Reflectivity at 0GPa.
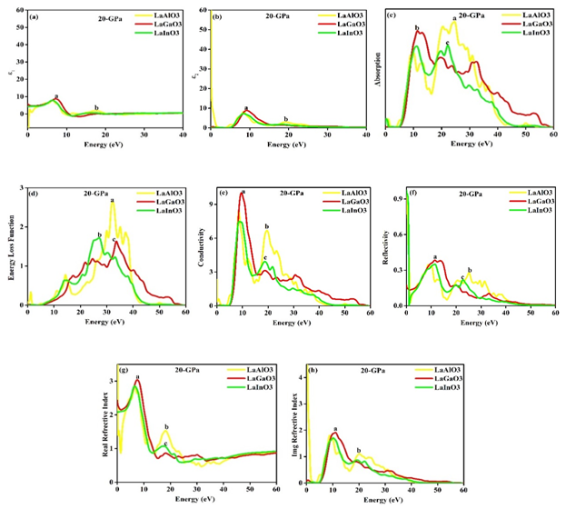
Figure 9. Before and after applied external pressure of LaXO3 (a) Real part of dielectric function at 20GPa, (b) Imaginary part of dielectric function at 20GPa (c) Absorption at 20GPa; (d) Energy loss function at 20GPa; (e) Conductivity at 20GPa, (f) Reflectivity at 20GPa, (g) Real part of refractive index at 20GPa, (h) Imaginary part of refractive index at 20GPa.
To compute the powerful analysis of these LaXO
3 (X= Al, In, Ga) LAO, LAIO and BTO materials in optoelectronic devices. The main concern of this work is to calculate their optical responses.
Figures 8 & 9(a, b) shows the variation in various optical responses. Approximately the maximum contribution of the real dielectric function peak is 8.08 (LIO) at energy range 6.3 and the second peak noted is 2.2 at 17.4eV respectively. The photon energy peaks of the complex dielectric function occurrence correspond to the applied isotropic external pressure (0GPa to 20GPa), respectively
with high energy contribution peaks noted at 8.4 (LIO), 3.03, 8.9 (LGO), and 3.1eV at energy ranges 9.1eV, 18.8eV, 9.01eV, and 19.1eV respectively. When the pressure increased and it impacted on dielectric function the major peaks at the real and complex parts of the dielectric function systematically move downwards by applying a systematic external isotropic pressure. From
figures 8 & 9c, for LAO, LIO and LGO the frequency-dependent absorption parameter by various pressure in the limit of 0GPa-20GPa is displayed above figures. In this case, the maximum absorption peaks shifted from 5.0eV (LGO) to 54.7 eV and from 4.4eV (LAO) to 48.4 eV respectively. Under the condition of pressure increasing its important impact on absorption peaks also transfers from high to low energy range values. After the absorption of all incident photons and electrons, they jump from the VB to CB and these electrons take part in the conduction band. From
figures 8 & 9d computed energy loss function, the strong contribution peaks are 32.0eV (LAO), 25.86eV, 32.8eV, 32.2eV, 27.0 eV (LIO) and 33.3 eV respectively. The energy loss function is also maximized when the complex part of the dielectric function reaches a minimum value, which is a main key parameter of the semiconductor Optical conductivity is the main response to the relation between induced current density and induced electric field under different frequency limits. It is accurately linked with optical conductivity caused by illumination. When electromagnetic light has an indirect behaviour with substance and breakage of its bonds
| [47] | Charnukha, A., et al., Superconductivity-induced optical anomaly in an iron arsenide. Nature communications, 2011. 2(1): p. 1-5. |
[47]
. The absorption is a large range and the light of incident photons will travel very strongly into the perovskite materials like LaXO
3 (X = Al, In, Ga). It indicates the absorption of the photon into the materials. The absorption coefficient is computed by employing two important parameters of dielectric functions
| [48] | Crovetto, A., et al., Dielectric function and double absorption onset of monoclinic Cu2SnS3: Origin of experimental features explained by first-principles calculations. Solar Energy Materials and Solar Cells, 2016. 154: p. 121-129. |
[48]
. Additionally, when electrons collide with incident photons then absorption peaks create inter-band and intra-band transitions
| [49] | Govorov, A. O., et al., Photogeneration of hot plasmonic electrons with metal nanocrystals: Quantum description and potential applications. Nano Today, 2014. 9(1): p. 85-101. |
[49]
. From From
figure 8 & 9 (e) calculated the maximum contribution peaks of conductivity are noted at energy ranges 11.4 eV (LGO) 11.41 eV, 24.9 eV, 9.65 eV, 19.7 (LAO) and 19.0 eV as well as overall the energy range selected from 0 to 60eV respectively. The maximum conductivity is shown in the case of LaGaO3 as compared to LaAlO3 and LaInO
3. From From
figure 8 & 9f, at applied pressure the result of reflectivity at the edges of maximum peaks shifted at energy range 11.6 eV, 24.63 eV 21.9 eV respectively. From
figure 9(g, h) the refractive index increased until 7.26 eV, 17.66 eV and 7.53, 18.7eV then beings to decrease. The considerable values of the refractive index decreased with increased external pressure and also enhanced as absorption decreases as in above figures. In case of real and complex refractive index the maximum contributions are made by LGO as compared to others LAO and LGO.
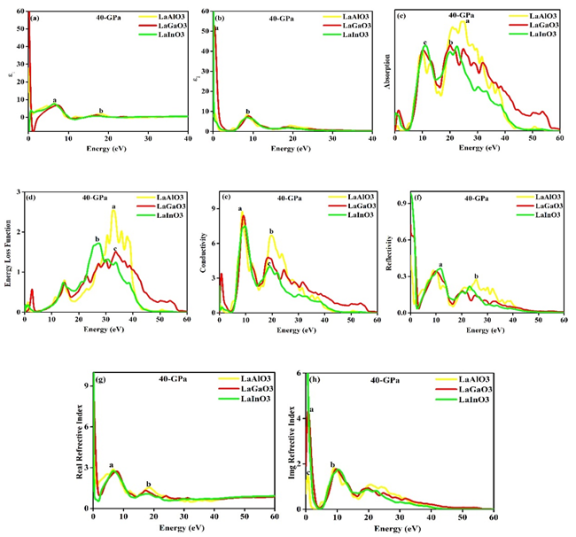
Figure 10. Before and after applied external pressure of LaXO3 (a) Real part of dielectric function at 40GPa, (b) Imaginary part of dielectric function at 40GPa (c) Absorption at 40GPa; (d) Energy loss function at 40GPa; (e) Conductivity at 40GPa, (f) Reflectivity at 40GPa, (g) Real part of refractive index at 40GPa, (h) Imaginary part of refractive index at 40GPa.
Figure 11. Before and after applied external pressure of LaXO3 (a) Real part of dielectric function at 60GPa, (b) Imaginary part of dielectric function at 60GPa (c) Absorption at 60GPa; (d) Energy loss function at 60GPa; (e) Conductivity at 60GPa, (f) Reflectivity at 60GPa, (g) Real part of refractive index at 60GPa, (h) Imaginary part of refractive index at 60GPa.
Figure 10 & 11(a, b) indicates the real and imp part of dielectric functions, it is also obvious that when imp part reaches the threshold value, the loss function is maximal which is one of the major responses of semiconductors. The strong contribution peaks in the case of real dielectric function at 6.3 (LIO) 18.1eV (LAO), 7.5eV (LGO) and 18.0 eV (LAG) energy range respectively. But under applied external pressure and its important impact on the complex part of the dielectric function the maximum peaks are noted at 0.37 eV (LGA) 8.5 eV (LAO) 7.4 eV and 19.5 eV energy range respectively. The graphs show that the complex part of the system dielectric role has the lowest value at 0eV, demonstrating that LAO has the largest absorption. From
figures 10 & 11(c, d) computed the results of absorption and energy loss functions the maximum strong contribution of absorption at 40GPa-60GPa are noted as 24.5 eV (LAO), 20.0 eV (LGA), 10.7 eV, 24.9 eV, 12.7 eV and 22.4 eV and energy loss functions are justified at 32.8eV (LAO), 26.7eV (LIO) and 33.71eV (LGO) respectively
Figures 10 & 11(e, f) computed the maximum values of conductivity and reflectivity, which indicates that absorption and reflection are inversely proportional when the L(w) value is large and I(w) is smallest. In the case of conductivity are justified at 8.6eV (LAO) 19.7 eV (LAO), 19.0 (LIO) and at external pressure increased 40GPa to 60GPa the maximum peaks are noted at 9.8eV (LGO), 20.1 eV (LAO) and 18.9eV energy range values. Finally, we see that the effect of external pressure on the conductivity is noted a considerable changing accrues. From
Figures 10 & 11(g, h) the real and complex parts of the refractive index are noted at 0.55 eV (LGO), 10.7 eV (LAO), 21.1 eV (LAO), 6.38 eV (LAO), 18.6eV (LAO) respectively. Additionally, reflectivity has a direct relationship with complex refractive index. When the complex refractive index is enhanced in the absorption parameters which has different trends in all three materials. In the preceding discussion, it was established that applying isotropic pressure improves all the optical responses of LAO, LIO and LGO.
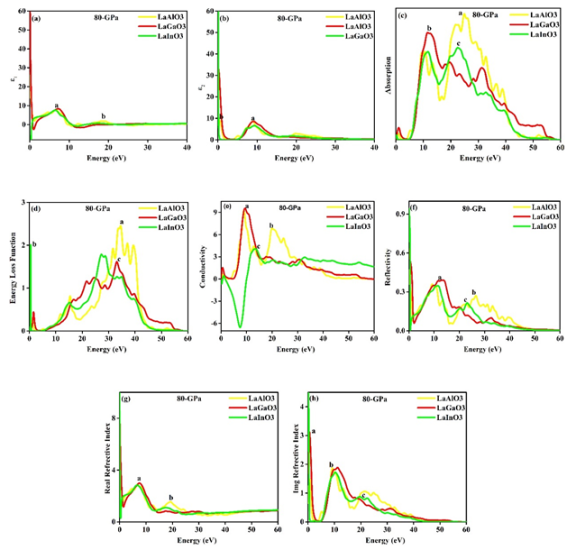
Figure 12. Before and after applied external pressure of LaXO3 (a) Real part of dielectric function at 80GPa, (b) Imaginary part of dielectric function at 80GPa (c) Absorption at 80GPa; (d) Energy loss function at 80GPa; (e) Conductivity at 80GPa, (f) Reflectivity at 80GPa, (g) Real part of refractive index at 80GPa, (h) Imaginary part of refractive index at 80GPa.
From
figure 12(a, b) calculated the optical response of LAO, LIO and LGO under external pressure vary from 0GPa to 80GPa. In the case of real and complex dielectric functions, the strong contribution peaks justified are 7.02eV (LGO), 18.83eV (LAO) and 907eV, 0.31eV energy range respectively. The dielectric coefficient, also known as the relative permittivity, is a fundamental property of a material that describes its response to an electric field. Typically represented by a complex number, it consists of a real portion (ε
1) and an imaginary portion (ε
2). The real part of the dielectric constant (ε
1) reflects the material's ability to store electrical energy when subjected to an electric field. It is associated with the polarization responses within the material, where the external electric field induces the displacement of charges. A higher value of ε1 indicates a greater capacity of the material to store electrical energy, essentially determining the extent to which the electric field penetrates the material. Conversely, the imaginary part of the dielectric constant (ε
2) represents the material's ability to dissipate electrical energy as heat under the influence of an electric field. This dissipation occurs through various mechanisms such as atomic vibrations and electronic transitions, leading to energy loss. A higher value of ε2 signifies a greater capability of the material to absorb and dissipate electrical energy. In terms of physical phenomena, the real part (ε1) influences the refractive index of the material, which affects the speed of electromagnetic wave propagation through it. It also impacts the capacitance of capacitors, as the effective capacitance is directly proportional to ε
1. On the other hand, the imaginary part (ε
2) is associated with the absorption of electromagnetic waves, contributing to phenomena like dielectric heating and signal attenuation in transmission lines. Materials with higher values of ε
2 are often utilized in applications requiring absorption and dissipation of electromagnetic energy, such as microwave absorbers and thermal insulators. The absorption coefficient of incident light can be computed using a mathematical framework, primarily by analyzing the absorption characteristics of the incident light based on the frequency-dependent dielectric response of the material.
Figure 12(c, d) compute the trends of absorption and energy loss function. The maximum strong involvement in case of absorption at 80GPa pressure is noted at points 24.9eV (LAO), 11.5 eV (LGO), 22.6eV (LIO) respectively. The absorption has a large range and the light of incident photons will travel very strongly into the perovskite materials like LaXO
3 (X = Al, In, Ga). It indicates the absorption of the photon into the materials. The absorption coefficient is computed by employing two important parameters of dielectric functions
| [48] | Crovetto, A., et al., Dielectric function and double absorption onset of monoclinic Cu2SnS3: Origin of experimental features explained by first-principles calculations. Solar Energy Materials and Solar Cells, 2016. 154: p. 121-129. |
[48]
. Additionally, when electrons collide with incident photons then absorption peaks create an impact of inter-band and intra-band transitions
| [49] | Govorov, A. O., et al., Photogeneration of hot plasmonic electrons with metal nanocrystals: Quantum description and potential applications. Nano Today, 2014. 9(1): p. 85-101. |
[49]
.
Figure 12(e, f) computes results of conductivity and reflectivity under applied external isolated pressure. We see a major peak trend changing in all cases of LAO, LIO and LGO. The maximum contribution peaks of conductivity noted at points are 9.5 eV (LGO), 19.8eV (LAO) and reflectivity peaks justified at different points under the maximum movement of free electrons from VB to CB. Reflectivity pertains to a material's ability to reflect incident electromagnetic waves, representing the portion of energy bounced back from the surface. Typically denoted by a value between 0 and 1, where 0 signifies complete absorption and 1 denotes total reflection, reflectivity relies on factors such as the material's refractive index and surface characteristics. Transmittance, on the other hand, measures a material's capacity to allow electromagnetic waves to pass through it. Also ranging from 0 to 1, with 0 indicating full absorption and 1 complete transmission, transmittance depends on variables like refractive index, thickness, and absorption properties. Resistivity, measured in ohm-meters (Ω·m), gauges a material's resistance to electric current flow, influenced by its composition, temperature, and impurities. High resistivity obstructs current flow, while low resistivity enables efficient conduction. Although pressure can affect LaXO3 (X = Al, In, Ga) perovskite materials by densifying them and reducing volume, temperature alterations primarily impact their kinetic energy, leading to changes in mechanical, electronic, and optical properties. Elevated temperatures increase atom mobility, causing expansion and alterations in conductivity. Reflectivity serves to discern the surface characteristics of LaAlO3, LaInO
3, and LaGaO3 perovskite materials. Impact of reflectively dealing with the aptitude of the surface of our material to reflect light in form of radiations
| [50] | Naeem, M., Laser processing of reflective materials: a new technology managing reflection effects. Laser Technik Journal, 2013. 10(1): p. 18-20. |
[50]
. It is also indicated by the taken ratio of incident radiation to the reflected radiation
| [51] | Hall, E. J. and C.-S. Wuu, Radiation-induced second cancers: the impact of 3D-CRT and IMRT. International Journal of Radiation Oncology* Biology* Physics, 2003. 56(1): p. 83-88. |
[51]
.
Figure 12(g, h) computes the real and complex parts of the refractive index for both LaXO
3 (X = Al, In, Ga). The maximum contribution peaks in the case of real and complex refractive indices are justified at different notable points. These edges show the maximum peaks of refractive index. The refractive index is a measure of the speed of light in a vacuum compared to its speed in a medium. It characterizes the extent to which light slows down when passing through a substance. LaAlO
3, LaInO
3, and LaGaO
3 are perovskite oxides with distinct refractive indices, each indicating their ability to bend and slow down light. The accurate refractive index values for these materials determine how much light is transmitted through them, crucial for various applications such as optics, photonics, and telecommunications.