Abstract
This study addresses the challenge of detecting and classifying advanced cyber threats, including distributed denial-of-service (DDoS) and Stealth Attacks, in complex network environments. We propose a hybrid approach that combines machine learning models with a rule-based classifier to improve anomaly detection accuracy. The method uses Random Forest, Gradient Boosting, and Linear Regression to predict normal traffic volume with high precision (R² = 0.99, MSE = 0.000085). Key features include request rate, traffic volume, source IP entropy, flow duration, and protocol diversity. A deviation threshold of 0.5 standard deviations from predicted values effectively identifies anomalies under dynamic conditions. For classification, we introduce a rule-based system that utilizes thresholds, such as a request rate exceeding 100 requests per second for DDoS attacks or a source IP entropy of approximately 0.6907 for Stealth Attacks. This classifier identifies six types of anomalies: DDoS, Slow, Volumetric, Service Outage, Application Layer, and Stealth Attacks. The experimental results demonstrate the effectiveness of our hybrid approach. Compared to existing methods, it achieves higher F1-scores (0.97-1.00) across most attack types. Additionally, it correctly classifies 91% of real traffic (1,246,311 packets) as usual in a synthetic dataset containing 9,660 flows. The proposed method demonstrates strong performance in terms of precision, recall, and computational efficiency, making it suitable for real-time network monitoring.
|
Published in
|
Advances in Applied Sciences (Volume 10, Issue 3)
|
|
DOI
|
10.11648/j.aas.20251003.15
|
|
Page(s)
|
88-96 |
|
Creative Commons
|

This is an Open Access article, distributed under the terms of the Creative Commons Attribution 4.0 International License (http://creativecommons.org/licenses/by/4.0/), which permits unrestricted use, distribution and reproduction in any medium or format, provided the original work is properly cited.
|
|
Copyright
|
Copyright © The Author(s), 2025. Published by Science Publishing Group
|
Keywords
Anomaly Detection, Cybersecurity, Machine Learning, Rule-based Classification
1. Introduction
In today’s digital age, web-based applications have become central to global communication and commerce. However, this reliance also broadens the attack surface for malicious actors, increasing the need for robust cybersecurity measures. One crucial task is detecting anomalies in network traffic, which is vital for identifying threats and maintaining system integrity.
Network traffic analysis offers valuable insights into user behavior and system status. By catching anomalies early, we can identify potential threats and support proactive security measures. Irregularities may appear as sudden traffic spikes, unauthorized access attempts, or deviations from typical interaction patterns—often signs of cyberattacks, such as DDoS, SQL injection, or data leakage
.
This study explores methods for collecting and processing network traffic data and applies Machine Learning (ML) techniques to model expected behavior. Based on this, we developed an algorithm for accurate anomaly detection and classification. Experimental results show its effectiveness, with a detection coefficient over 0.98 and a low mean squared error.
The paper is organized as follows: Section 2 reviews related work, Section 3 discusses network traffic analysis, Section 4 outlines the anomaly detection methodology, Section 5 introduces classification metrics, Section 6 defines the categories of anomalies, Section 7 describes the detection and classification algorithm, and Section 8 presents the analysis of experimental results.
2. Analysis of the Current Situation
Cyber threats, especially DDoS attacks, pose significant risks to organizations worldwide. According to Cloudflare, Q4 2024 experienced record-level DDoS attacks, including the largest ever at 5.6 Tbps. Over 21.3 million DDoS attacks were blocked in 2024, representing a 53% increase from 2023
. These figures highlight the urgent need for improved protection mechanisms. DDoS attacks can result in significant economic losses, service disruptions, and reputational damage. Cobalt reports estimate that annual cybercrime costs will reach $10.5 trillion by 2025
. As noted by the Center for Strategic and International Studies, the increasing complexity and frequency of cyberattacks call for new defense strategies
. One promising approach is entropy-based DDoS detection, which enhances speed and accuracy. However, static thresholds limit adaptability, leading to potential false positives or missed attacks. Additionally, resource-intensive computations may hinder real-time deployment on less powerful systems
| [5] | Center for Strategic and International Studies, “Significant Cyber Incidents,” 2025. [Online]. Available: https://www.csis.org/programs/strategic-technologies-program/significant-cyber-incidents |
| [6] | Wang, X., Dai, H., Huang, Z., and Han, Y. “Network traffic anomaly detection based on DGBi-SA model,” Eng. Lett., vol. 33, no. 3, pp. 612-619, 2025. Available: https://www.engineeringletters.com/issues_v33/issue_3/EL_33_3_09.pdf |
| [7] | Palmieri F., “Network anomaly detection based on logistic regression of nonlinear chaotic invariants,” J. Netw. Comput. Appl., vol. 148, p. 102460, 2019. Available: https://doi.org/10.1016/j.jnca.2019.102460 |
[5-7]
. Modern threats are becoming increasingly sophisticated, requiring adaptive algorithms that can evolve in response to changing network conditions
| [8] | Fan, C., Kaliamurthy, N. Chen, S., Jiang, H., Zhou, Y., and Campbell, C. “Detection of DDoS Attacks in Software Defined Networking Using Entropy,” Appl. Sci., vol. 12, no. 1, p. 370, 2022. Available: https://doi.org/10.3390/app12010370 |
[8]
. Effective solutions must maintain high accuracy while minimizing errors and missed attacks, especially in sectors like finance and telecommunications
| [9] | Alazab, M. “A discrete time-varying greywolf IoT botnet detection system,” Comput. Commun., vol. 192, pp. 405-416, 2022. Available: https://doi.org/10.1016/j.comcom.2022.06.016 |
| [10] | Abbasi, M., Shahraki, A., and Taherkordi, A. “Deep learning for network traffic monitoring and analysis (NTMA): A survey,” Comput. Commun., vol. 170, pp. 19-41, 2021. Available: https://doi.org/10.1016/j.comcom.2021.01.021 |
[9, 10]
. Machine learning and big data analytics provide scalable tools for multi-stage anomaly detection, enabling early threat identification before significant damage occurs
| [11] | Van Efferen, L., and Ali-Eldin, A. M. T., “A multi-layer perceptron approach for flow-based anomaly detection,” in Proc. Int. Symp. Netw. Comput. Commun. (ISNCC), IEEE, 2017, pp. 1-6. Available: https://doi.org/10.1109/ISNCC.2017.8072036 |
[11]
. This study builds on these insights by analyzing existing traffic, identifying anomalies, and developing a hybrid detection and classification algorithm tailored for electronic network resources.
3. Network Data Analysis
Network traffic refers to the continuous flow of data across computer networks. Its analysis is crucial for security, improving performance, and understanding user behavior
| [12] | Htet P. P., and Thanda, S., “Network traffic anomaly detection based on Apache Spark,” in Proc. Int. Conf. Adv. Inf. Technol. (ICAIT), IEEE, 2019, pp. 222-226. Available: https://doi.org/10.1109/AITC.2019.8920897 |
| [13] | Zhou, D., Yan, Z., Fu, Y., and Yao, Z. “A survey on network data collection,” J. Netw. Comput. Appl., vol. 116, pp. 9-23, 2018. Available: https://doi.org/10.1016/j.jnca.2018.05.004 |
| [14] | Rahmatov, F., and Kholmuminov, O. “Analysis of DDoS Attacks on network electronic resources,” Sci. J. Digit. Transform. Artif. Intell., vol. 2, no. 2, pp. 133-137, 2024. Available: https://dtai.tsue.uz/index.php/dtai/article/view/v2i220 |
[12-14]
. We focus on passive traffic
analysis, which observes traffic without interference. Tools like Wireshark and NetFlow are used to collect real-time data
| [16] | Nunez-Agurto, D., Fuertes, W., Marrone, L., and Macas, M. “Machine Learning-based traffic classification in software-defined networking: A systematic literature review, challenges, and future research directions,” IAENG Int. J. Comput. Sci., vol. 49, no. 4, pp. 1002-1015, 2022. Available: https://www.iaeng.org/IJCS/issues_v49/issue_4/IJCS_49_4_04.pdf |
| [17] | LOIC (Low Orbit Ion Cannon). Available: https://github.com/NewEraCracker/LOIC |
| [18] | Gradient Boosting in ML. Available: https://www.geeksforgeeks.org/ml-gradient-boosting/ |
| [19] | Linear Regression in Machine Learning. Available: https://www.geeksforgeeks.org/ml-linear-regression/ |
[16-19]
. Passive methods allow for non-intrusive evaluation of existing traffic patterns. Traffic can be analyzed at different layers of the OSI/TCP-IP model
| [7] | Palmieri F., “Network anomaly detection based on logistic regression of nonlinear chaotic invariants,” J. Netw. Comput. Appl., vol. 148, p. 102460, 2019. Available: https://doi.org/10.1016/j.jnca.2019.102460 |
| [13] | Zhou, D., Yan, Z., Fu, Y., and Yao, Z. “A survey on network data collection,” J. Netw. Comput. Appl., vol. 116, pp. 9-23, 2018. Available: https://doi.org/10.1016/j.jnca.2018.05.004 |
[7, 13]
. For anomaly detection, the session and application layers offer valuable insights
| [12] | Htet P. P., and Thanda, S., “Network traffic anomaly detection based on Apache Spark,” in Proc. Int. Conf. Adv. Inf. Technol. (ICAIT), IEEE, 2019, pp. 222-226. Available: https://doi.org/10.1109/AITC.2019.8920897 |
| [15] | Nmap: the Network Mapper - Free Security Scanner. Available: https://nmap.org/ |
[12, 15]
. Key parameters include:
1) Request Intensity - Average number of requests per unit time.
2) Packet Size - Measured in bytes; indicates data transmission volume.
3) Response Time - Server response delay.
4) Bandwidth - Maximum data transmission capacity.
5) Packet Loss - Percentage of lost packets due to congestion or faults.
6) Latency - Includes transmission and processing delays.
These quantitative indicators help distinguish between normal and abnormal behavior
| [13] | Zhou, D., Yan, Z., Fu, Y., and Yao, Z. “A survey on network data collection,” J. Netw. Comput. Appl., vol. 116, pp. 9-23, 2018. Available: https://doi.org/10.1016/j.jnca.2018.05.004 |
[13]
. To assess traffic stability, we use a stochastic model based on Equation (
1):
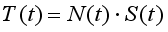 (1)
(1) Where
N(
t) is the number of requests at time
t,
S(
t) is the average size at time
t, and
T(
t) is the total traffic volume at time
t. Using this model, we apply machine learning algorithms—Random Forest, Gradient Boosting, and Linear Regression—to predict traffic behavior and detect anomalies
| [16] | Nunez-Agurto, D., Fuertes, W., Marrone, L., and Macas, M. “Machine Learning-based traffic classification in software-defined networking: A systematic literature review, challenges, and future research directions,” IAENG Int. J. Comput. Sci., vol. 49, no. 4, pp. 1002-1015, 2022. Available: https://www.iaeng.org/IJCS/issues_v49/issue_4/IJCS_49_4_04.pdf |
[16]
.
Each model has its strengths:
1) Random Forest: High accuracy, robust against overfitting
.
2) Gradient Boosting: Excels in regression tasks
.
3) Linear Regression: Simple, fast, and interpretable
.
We trained the models using network traffic data from Tashkent University of Information Technologies. Wireshark captured 350 MB of traffic (356,328 packets), including 11,436 HTTP packets used for training. Model performance was evaluated using R² and MSE metrics. Linear Regression showed the best results (R² = 0.99, MSE = 0.000085), making it ideal for real-time monitoring.
4. Anomaly Detection Methodology
In the next step, we utilize the trained model to identify anomalies in network traffic. This is achieved by calculating the average traffic volume (μ) and the standard deviation (σ) over a sliding window of W periods, based on historical data. The following equations describe this process:
Mean Traffic Volume μ:
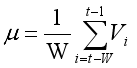 (2)
(2) Standard Deviation σ:
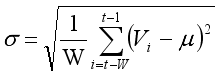 (3)
(3) Where Vi is the size of the i-th packet, t is the observation time, W is the window size (for example, 10 minutes), and i represents each observation within the window. Once the average traffic volume μ and the standard deviation σ are calculated, we evaluate traffic stability at each time t after the initial window has passed. Stability is assessed by comparing the current traffic volume, T(t), with the average traffic volume, μ. The following condition is used to determine stability:
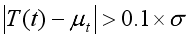 (4)
(4) If the absolute difference between the current traffic volume T(t) and the mean μ exceeds this threshold, the traffic is considered unstable. When traffic instability is detected, we proceed to identify anomalies by comparing the actual traffic volume T(t) with the predicted traffic volume Pt(t) using the following condition:
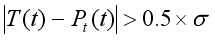 (5)
(5) If the difference between the predicted and actual values exceeds the threshold, an anomaly is flagged.
The thresholds of 0.1 and 0.5 in Equations (
4) and (
5) were determined experimentally through testing in real-world conditions
| [16] | Nunez-Agurto, D., Fuertes, W., Marrone, L., and Macas, M. “Machine Learning-based traffic classification in software-defined networking: A systematic literature review, challenges, and future research directions,” IAENG Int. J. Comput. Sci., vol. 49, no. 4, pp. 1002-1015, 2022. Available: https://www.iaeng.org/IJCS/issues_v49/issue_4/IJCS_49_4_04.pdf |
[16]
. These values may vary depending on the network's specific characteristics, the type of traffic, and potential threats.
5. Anomaly Classification Metrics
To classify anomalies, we combined Poisson
and Gaussian
distributions. The Poisson distribution models discrete random variables, representing the probability that a certain number of events occur independently within a fixed time interval at a known average rate per unit of time. Assuming the number of requests
Rt follows a Poisson distribution, the probability of receiving
k requests during the time interval
t is given by:
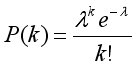 (6)
(6) The average number of requests within a time window W (used for dynamic monitoring) is calculated as:
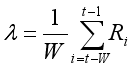 (7)
(7) Where λ is the average request rate (e.g., number of requests per second), Ri is the number of requests at time i, t is the current observation time, and W is the size of the time window (e.g., 10 minutes) used to update parameters.
The probability P(Rt = k) represents the expected number of requests within a time interval of t.
To characterize packet size (S), we use the standard (Gaussian) distribution:
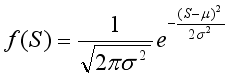 (8)
(8) Where μ is the average packet size and σ² is the variance (i.e., the square of the standard deviation), indicating how much packet sizes vary from the mean. Based on these, we established upper and lower limits for request count and traffic volume. To identify unusually high activity, we calculate the upper threshold kh for request count based on the Poisson distribution using:
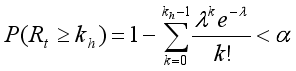 (9)
(9) Here, α represents the significance level (e.g., α = 0.01, which indicates a 1% chance of false positives). This equation sets the upper limit for request count, and surpassing it is considered a rare event. To identify decreased activity, we define the lower bound kl using:
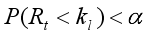 (10)
(10) For the network traffic volume, the upper threshold Vh based on the normal distribution is calculated using the standard Gaussian quantile.
 (11)
(11) Where z is the standard normal quantile corresponding to 1−α (for example, for α = 0.01, z = 2.33), μ and σ are the mean and standard deviation of traffic volume, respectively. The standard score (or z-score) at time t, which indicates how far the current volume deviates from the mean, is given by:
 (12)
(12) The lower threshold for traffic volume is then determined as:
 (13)
(13) In addition to the bounds derived above, the following additional metrics are used for more comprehensive anomaly classification:
1) Probability of Abnormal Request Count (Ppuas):
 (14)
(14) Where Rt represents the number of requests at time t, this metric assesses the probability of observing a high volume of requests under a Poisson process.
2) Standardized Deviation of Traffic Volume (zV):
Equation (
12) computes the
z-score, which measures how much the current traffic volume
Vt deviates from the average
μ. A high
z-score indicates a significant deviation, potentially signaling an anomaly.
3) Source Entropy (St):
Based on Shannon entropy, this metric evaluates the diversity of traffic sources (e.g., IP addresses). Low entropy suggests a few concentrated sources, commonly seen in DDoS attacks. Conversely, high entropy indicates distributed and uniform traffic.
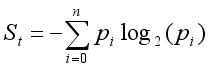 (15)
(15) Where n is the total number of unique IP addresses, and pi is the proportion of requests from the i-th IP, calculated as:
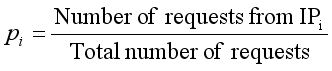 (16)
(16) 4) Average Server Response Delay (Tt):
This metric shows the average time delay between a request and its response over a specified period.
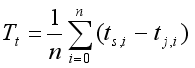 (17)
(17) Where, ts,i is the timestamp when the i-th request was sent, tj,i is the timestamp when the corresponding response was received, and n is the number of request-response pairs in the observation window.
5) Proportion of Specific Request Types (Qt):
This metric measures the proportion of specific request types (e.g., POST requests):
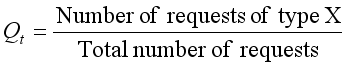 (18)
(18) Together, these indicators enable a comprehensive and multidimensional classification of network traffic anomalies.
6. Anomaly Classification
To detect abnormal network behaviors, this study classifies anomalies based on statistical deviations in the number of requests (Rt) and traffic volume (Vt) observed at a specific time (t). Using predefined upper thresholds (kh, Vh) and lower thresholds (kl, Vl), five main types of anomalies are identified.
High request rate and high traffic volume:
Rt > kh and Vt > Vh.
High request rate with normal or low traffic volume:
Rt > kh and Vl ≤ Vt ≤ Vh or Vt < Vl.
Normal request rate with high traffic volume:
kl ≤ Rt ≤ kh and Vt > Vh.
Low request rate and/or low traffic volume:
Rt < kl and/or Vt < Vl.
Entropy outliers: Even when Rt and Vt remain within normal ranges, a significant deviation in entropy St is considered anomalous.
Each anomaly class can be associated with typical network attack patterns. The following mapping defines characteristic features of common attack types:
DDoS (Distributed Denial of Service) attacks, characterized by:
1) Excessive request rate: Rt > kh;
2) High traffic volume: Vt > Vh;
3) Low entropy St, indicating repeated requests from a small set of sources.
This attack seeks to exhaust server resources by generating a high volume of requests.
Slow Attacks (e.g., Slowloris, Slow HTTP), characterized by:
1) High request rate: Rt > kh;
2) Normal or low traffic volume;
3) Increased response delay: Tt;
4) High proportion of incomplete or persistent connections.
Such attacks exploit server connection limits by holding multiple sessions open for extended periods.
Volumetric attacks, characterized by:
1) Normal request rate: kl ≤ Rt ≤ kh;
2) High traffic volume: Vt > Vh;
3) Often linked to UDP floods or oversized packets.
These attacks saturate bandwidth rather than request-handling capacity.
Service or network outage, characterized by:
1) Low request rate and traffic volume;
2) Increased latency or error messages in server logs.
Such patterns typically indicate a system fault or network disconnection.
Application Layer Attacks, characterized by:
1) High request rate: Rt (> kh);
2) Normal traffic volume;
3) Anomalously high frequency of specific queries Qt, such as database or API calls;
4) High entropy St, reflecting diverse sources.
These attacks target application logic with sophisticated, targeted queries.
Stealth Attacks, characterized by:
1) Normal Rt and Vt;
2) Anomalies detected in entropy St or in query type distribution Qt.
Stealth Attacks involve reconnaissance or exploitation attempts that avoid detection by traditional thresholding methods.
The classification criteria for each attack type are summarized in
Table 1.
Table 1. Attack detection rules based on statistical indicators.
Conditions | Attack Type |
Rt > kh, Vt > Vh, low St | DDoS |
Rt > kh, normal Vt, high Tt | Slow Attacks |
Normal Rt, Vt > Vh | Volumetric attacks |
Rt < kl, Vt < Vl | Service outage |
Rt > kh, normal Vt, high Qt | Application Layer Attacks |
Normal Rt, Vt, anomalous St/Qt | Stealth Attacks |
These rule-based classifications provide a practical framework for distinguishing between common forms of network anomalies and cyberattacks by correlating traffic behavior with statistical indicators.
7. Anomaly Detection and Classification Algorithm
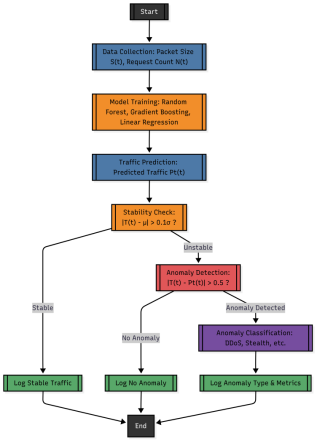
The proposed algorithm for detecting and classifying anomalous network behavior consists of five sequential stages:
1) Network Traffic Monitoring;
2) Traffic Stability Assessment;
3) Anomaly Detection;
4) Anomaly Classification;
5) Logging.
The complete process is outlined in
Figure 1, which presents the high-level structure of the anomaly detection and classification algorithm.
Figure 1. Algorithm for detecting and classifying network traffic anomalies.
Stage 1 - Network Traffic Monitoring.
In this initial stage, incoming network traffic—specifically UDP and TCP packets—is continuously captured and recorded. These raw data packets form the basis for all subsequent analysis.
Stage 2 - Traffic Stability Check.
The second stage evaluates whether the observed traffic behavior is stable. This is determined using a predefined statistical condition, referenced in Equation (
4). If the traffic is deemed stable, the information is directly stored in the system log. If instability is detected, the algorithm proceeds to the anomaly detection phase.
Stage 3 - Anomaly Detection.
In this phase, the algorithm checks for anomalies based on the conditions defined in Equation (
5). If no anomalies are found, the traffic data is logged. However, if an anomaly is detected, the algorithm transitions to the classification stage for further analysis.
Stage 4 - Anomaly Classification.
Detected anomalies are classified based on the rule set summarized in
Table 1. Each rule corresponds to a specific type of cyberattack or network issue, including:
1) Distributed Denial of Service (DDoS)
;
2) Slow-rate attacks (e.g., Slowloris);
3) Volumetric attacks;
4) Network or server outages;
5) Application-layer attacks;
6) Stealth or low-profile attacks.
The classification leverages multiple indicators, including request rate (Rt), traffic volume (Vt), entropy (St), delay (Tt), and query-type distribution (Qt), as described in Section 4.
Stage 5 - Logging and Record Keeping.
In the final stage, all relevant data—including the anomaly type (if any), the statistical indicators, and timestamped traffic snapshots—are written to a log file. This ensures traceability and supports future forensic or diagnostic efforts.
8. Results
Evaluation on Real Network Traffic
To assess the effectiveness of the proposed Rule-Based Classifier (
Table 1), experiments were conducted on both real and synthetic network traffic.
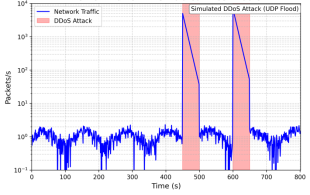
Real traffic was captured using the Wireshark tool
, which provided detailed packet-level information. In total, 1,246,311 packets were recorded over 802 seconds, with sizes ranging from 0 to 5,120 bytes. The majority of packets (~1,195,800) were within the 40-79 byte range.
This dataset contained both normal background activity and simulated DDoS (UDP flood) traffic generated via the Low Orbit Ion Cannon (LOIC) tool
| [24] | Aouedi, O. “Machine Learning-enabled network traffic analysis,” Ph. D. dissertation, Nantes Univ., 2022. |
[24]
.
Figure 2 presents a visual overview of the traffic, where noticeable spikes in packet volume correspond to attack periods, while the remaining intervals reflect typical operational behavior.
Figure 2. Network traffic overview used for testing.
For data processing, the classifier used a sliding window size of
W=30 and a smoothing coefficient
α=0.08. Detection was based on statistical thresholds for request rate (
Rt), traffic volume (
Vt), source IP entropy (
St), flow duration (
Tt), and unique protocols (
Qt) as defined in
Table 2.
The classification results for real traffic showed that the network operated in a Normal state for approximately 91% of the observation period. Stealth Attacks were detected in 1.83% of the time, DDoS activity in 3.51%, and Service Outages in 3.51%. Notably, the highest concentration of DDoS activity occurred between 20:18:56-20:19:08 and 20:19:22-20:19:38.
Table 2 lists the first eight DDoS detections, where high values of
Rt and
Vta combined with low
St triggered correct attack identification.
Table 2. Sample DDoS detection results (First 8 Entries).
Time | Rt | Vt (Mb) | St | Classification |
2025-02-21 20:18:56 | 314 | 0.02 | 0.03 | DDoS |
2025-02-21 20:18:57 | 544 | 0.03 | 0.00 | DDoS |
2025-02-21 20:18:58 | 609 | 0.04 | 0.13 | DDoS |
2025-02-21 20:18:59 | 669 | 0.04 | 0.13 | DDoS |
2025-02-21 20:19:00 | 734 | 0.04 | 0.06 | DDoS |
2025-02-21 20:19:01 | 834 | 0.05 | 0.07 | DDoS |
2025-02-21 20:19:02 | 908 | 0.05 | 0.03 | DDoS |
2025-02-21 20:19:03 | 954 | 0.05 | 0.00 | DDoS |
Evaluation on Synthetic Dataset
To further validate the approach, a synthetic dataset of approximately 9,660 flows was created. This dataset included normal traffic and multiple types of attacks: DDoS, Slow Attacks, Volumetric Attacks, Service Outage, Application Layer Attacks, and Stealth Attacks.
For Stealth Attacks, 1,380 flows were simulated with low packet rates (1-20 packets/s), long durations (1-5 s), and high source IP entropy (St between 0.5 and 1.0). These replaced 10% of the original dataset.
Key traffic features (
Rt,
Vt,
St,
Tt,
Qt) were calculated using optimized Pandas batch processing
| [25] | iPerf - The TCP, UDP, and SCTP network bandwidth measurement tool. [Online]. Available: https://iperf.fr/ |
[25]
. To address class imbalance, a RandomUnderSampler was applied, resulting in 7,728 training and 1,932 testing samples, with roughly 244-325 samples per class.
For binary classification tests (2,760 samples each: 1,380 BENIGN + 1,380 attack samples), the classifier achieved the performance metrics shown in
Table 3.
The results indicate:
- Perfect scores (F1 = 1.00) for Slow Attacks, Volumetric Attacks, and Service Outages
- High accuracy for DDoS (F1 = 0.97) and Stealth Attacks (F1 = 0.98)
- Lower performance for Application Layer Attacks (F1 = 0.79, accuracy = 0.75) due to misclassification of some BENIGN traffic as attacks and vice versa.
Table 3. Performance Metrics of Rule-Based Classifier.
Attack Type | Precision | Recall | F1-Score | Accuracy |
DDoS | 0.95 | 0.98 | 0.97 | 0.97 |
Slow attacks | 1.00 | 1.00 | 1.00 | 1.00 |
Volumetric attacks | 1.00 | 1.00 | 1.00 | 1.00 |
Service outage | 1.00 | 1.00 | 1.00 | 1.00 |
Application layer attacks | 0.69 | 0.93 | 0.79 | 0.75 |
Stealth attacks | 0.96 | 1.00 | 0.98 | 0.98 |
Computational Performance
An important advantage of the proposed method is that it requires no model training and offers near-instantaneous classification. This makes it highly suitable for real-time intrusion detection in systems with limited computational resources.
9. Discussion
The results clearly demonstrate that the Rule-Based Classifier can reliably detect multiple types of cyberattacks in both real and synthetic traffic. In real-world data, it successfully identified DDoS and Service Outage events (3.51% each) and detected Stealth Attacks in 1.83% of traffic. In the synthetic dataset, detection was flawless for Slow, Volumetric, and Service Outage attacks, and nearly perfect for DDoS and Stealth Attacks.
A particularly notable finding is the 100% recall for Stealth Attacks in synthetic tests. This is significant because such low-rate, high-entropy traffic often resembles legitimate activity, making it difficult to detect using traditional approaches.
The classifier’s main strengths include:
1) High interpretability - the detection logic is based on clear and explainable statistical thresholds.
2) Efficiency - the method avoids training overhead and operates with minimal latency.
3) Robustness - consistent performance across different traffic types and datasets.
However, the detection of Application Layer Attacks remains challenging. The lower F1-score (0.79) and accuracy (75%) are largely due to:
1) Overlapping statistical patterns with normal traffic;
2) Limited discriminative power of Qtwhen it takes binary values (0 or 1);
3) Fixed threshold values that do not adapt to dynamic traffic patterns.
In comparison to deep learning methods such as the Convolutional Recurrent Neural Network (CRNN)
| [26] | Rakhmatov, F. “Analysis of threats to web applications and existing methods of protection,” Int. Sci. J. Manage. Market. Finance, vol. 1, no. 2, pp. 96-99, 2024. Available: http://dx.doi.org/10.5281/zenodo.11380401 |
| [27] | Sheng, S. and Wang, X. “Network traffic anomaly detection method based on chaotic neural network,” Alex. Eng. J., vol. 77, pp. 567-579, 2023. Available: https://doi.org/10.1016/j.aej.2023.07.019 |
| [28] | Python (programming language). Available: https://en.wikipedia.org/wiki/Python_(programming_language) |
[26-28]
and ensemble models (LSTM, CNN, DNN)
| [29] | Dong, S., and Sarem, M. “DDoS attack detection method based on improved KNN with the degree of DDoS attack in software-defined networks,” IEEE Access, vol. 8, pp. 5039-5048, 2019. Available: https://doi.org/10.1109/ACCESS.2019.2963077 |
| [30] | Lee, S., Levanti, K. and Kim, H. S. “Network monitoring: Present and future,” Comput. Netw., vol. 65, pp. 84-98, 2014. Available: https://doi.org/10.1016/j.comnet.2014.03.007 |
| [31] | Hänsch, R. Handbook of Random Forests: Theory and Applications for Remote Sensing. Singapore: World Scientific, 2025. Available: https://doi.org/10.1142/13600 |
[29-31]
, the proposed approach offers several operational benefits. It is faster, easier to implement, consumes fewer resources, and is transparent in its decision-making process. Nevertheless, deep learning models still excel in detecting highly complex or novel patterns, albeit at the cost of higher computational demands and reduced explainability
.
Possible enhancements for the proposed method include:
1) Introducing additional traffic features, such as packet size distribution or time-based correlations;
2) Adopting adaptive thresholding rather than fixed values;
3) Combining rule-based detection with lightweight machine learning for hybrid approaches.
10. Conclusion
This study introduces a Rule-Based Classifier designed to detect and classify anomalies in network traffic, with a focus on six specific attack categories: DDoS, Slow Attacks, Volumetric Attacks, Service Outage, Application Layer Attacks, and Stealth Attacks.
The proposed method operates by applying statistical thresholds to five key network traffic features: request rate (Rt), traffic volume (Vt), source IP entropy (St), flow duration (Tt), and the number of unique protocols (Qt). By systematically analyzing these parameters, the classifier can differentiate between normal activity and various types of malicious behavior.
Experimental results confirm the method’s effectiveness. In real network traffic, the classifier correctly identified 91% of sessions as normal and accurately detected the timing of attack events. In synthetic datasets, it achieved an F1-score of at least 0.97 for all attack types, except for Application Layer Attacks, where the F1-score was 0.79.
Beyond accuracy, the classifier demonstrates high speed, low computational cost, and full interpretability, making it especially suitable for real-time network monitoring in environments with limited resources.
Looking ahead, future research will aim to:
1) Enhance detection of Application Layer Attacks by incorporating additional traffic features and implementing adaptive threshold mechanisms.
2) Evaluate the classifier on larger and more diverse real-world datasets to confirm its robustness.
3) Integrate automatic response mechanisms for immediate mitigation of detected threats.
In conclusion, the proposed Rule-Based Classifier offers a balanced combination of accuracy, simplicity, and operational efficiency, making it a practical and effective tool for real-time anomaly detection in modern network security systems.
Abbreviations
CNN | Convolutional Neural Network |
CRNN | Convolutional Recurrent Neural Network |
DDoS | Distributed Denial of Service |
DNN | Deep Neural Network |
HTTP | Hypertext Transfer Protocol |
IP | Internet Protocol |
LOIC | Low Orbit Ion Cannon |
LSTM | Long Short-Term Memory |
MB | Megabyte |
ML | Machine Learning |
MSE | Mean Squared Error |
OSI | Open Systems Interconnection |
Qt | Proportion of Specific Request Types |
R² | Coefficient of Determination |
RF | Random Forest |
Rt | Request Rate |
St | Source Entropy |
TCP | Transmission Control Protocol |
TCP/IP | Transmission Control Protocol / Internet Protocol |
UDP | User Datagram Protocol |
Vt | Traffic Volume |
W | Time Window Size |
Acknowledgments
The authors express their gratitude to Mekhriddin Rakhimov, Department of Computer Systems, Tashkent University of Information Technologies named after Muhammad al-Khwarizmi, for support in preparing and writing the article.
Author Contributions
Musaev Mukhammadjon: Conceptualization, Formal Analysis, Methodology, Writing - review & editing
Rakhmatov Furkat: Conceptualization, Methodology, Data Collection and Analysis, Writing - original draft, Writing - review & editing
Kholmuminov Oybek: Formal Analysis, Software
Karimov Norbek: Formal Analysis, Software, Visualization
Abdirazakov Fakhriddin: Formal analysis, Writing - review & editing
Funding
This work is supported by Grant No. B-2023-039, which provided financial assistance for conducting the research, analyzing the data, and preparing the manuscript for publication.
Data Availability Statement
The data is available from the corresponding author upon a reasonable request.
Conflicts of Interest
The authors declare no conflicts of interest.
References
| [1] |
Top Cybersecurity Statistics for 2025, Cobalt. io. [Online]. Available:
https://www.cobalt.io/blog/top-cybersecurity-statistics-2025
|
| [2] |
January 2025: Recent Cyber Attacks, Data Breaches, Ransomware Attacks, CM-Alliance. [Online]. Available:
https://www.cm-alliance.com/cybersecurity-blog/january-2025-recent-cyber-attacks-data-breaches-ransomware-attacks
|
| [3] |
Cloudflare, “Record-breaking 5.6 Tbps DDoS attack and global DDoS trends for 2024 Q4,” Jan. 2025. [Online]. Available:
https://blog.cloudflare.com/ddos-threat-report-for-2024-q4/
|
| [4] |
Perepelitsyn, S., Perepelitsyn, A. (2025). Compromise Between Topology Connection, Load Balance and Wireless Sensor Networks’Anomalies (WSN). American Journal of Information Science and Technology, 9(2), 79-86.
https://doi.org/10.11648/j.ajist.20250902.12
|
| [5] |
Center for Strategic and International Studies, “Significant Cyber Incidents,” 2025. [Online]. Available:
https://www.csis.org/programs/strategic-technologies-program/significant-cyber-incidents
|
| [6] |
Wang, X., Dai, H., Huang, Z., and Han, Y. “Network traffic anomaly detection based on DGBi-SA model,” Eng. Lett., vol. 33, no. 3, pp. 612-619, 2025. Available:
https://www.engineeringletters.com/issues_v33/issue_3/EL_33_3_09.pdf
|
| [7] |
Palmieri F., “Network anomaly detection based on logistic regression of nonlinear chaotic invariants,” J. Netw. Comput. Appl., vol. 148, p. 102460, 2019. Available:
https://doi.org/10.1016/j.jnca.2019.102460
|
| [8] |
Fan, C., Kaliamurthy, N. Chen, S., Jiang, H., Zhou, Y., and Campbell, C. “Detection of DDoS Attacks in Software Defined Networking Using Entropy,” Appl. Sci., vol. 12, no. 1, p. 370, 2022. Available:
https://doi.org/10.3390/app12010370
|
| [9] |
Alazab, M. “A discrete time-varying greywolf IoT botnet detection system,” Comput. Commun., vol. 192, pp. 405-416, 2022. Available:
https://doi.org/10.1016/j.comcom.2022.06.016
|
| [10] |
Abbasi, M., Shahraki, A., and Taherkordi, A. “Deep learning for network traffic monitoring and analysis (NTMA): A survey,” Comput. Commun., vol. 170, pp. 19-41, 2021. Available:
https://doi.org/10.1016/j.comcom.2021.01.021
|
| [11] |
Van Efferen, L., and Ali-Eldin, A. M. T., “A multi-layer perceptron approach for flow-based anomaly detection,” in Proc. Int. Symp. Netw. Comput. Commun. (ISNCC), IEEE, 2017, pp. 1-6. Available:
https://doi.org/10.1109/ISNCC.2017.8072036
|
| [12] |
Htet P. P., and Thanda, S., “Network traffic anomaly detection based on Apache Spark,” in Proc. Int. Conf. Adv. Inf. Technol. (ICAIT), IEEE, 2019, pp. 222-226. Available:
https://doi.org/10.1109/AITC.2019.8920897
|
| [13] |
Zhou, D., Yan, Z., Fu, Y., and Yao, Z. “A survey on network data collection,” J. Netw. Comput. Appl., vol. 116, pp. 9-23, 2018. Available:
https://doi.org/10.1016/j.jnca.2018.05.004
|
| [14] |
Rahmatov, F., and Kholmuminov, O. “Analysis of DDoS Attacks on network electronic resources,” Sci. J. Digit. Transform. Artif. Intell., vol. 2, no. 2, pp. 133-137, 2024. Available:
https://dtai.tsue.uz/index.php/dtai/article/view/v2i220
|
| [15] |
Nmap: the Network Mapper - Free Security Scanner. Available:
https://nmap.org/
|
| [16] |
Nunez-Agurto, D., Fuertes, W., Marrone, L., and Macas, M. “Machine Learning-based traffic classification in software-defined networking: A systematic literature review, challenges, and future research directions,” IAENG Int. J. Comput. Sci., vol. 49, no. 4, pp. 1002-1015, 2022. Available:
https://www.iaeng.org/IJCS/issues_v49/issue_4/IJCS_49_4_04.pdf
|
| [17] |
LOIC (Low Orbit Ion Cannon). Available:
https://github.com/NewEraCracker/LOIC
|
| [18] |
Gradient Boosting in ML. Available:
https://www.geeksforgeeks.org/ml-gradient-boosting/
|
| [19] |
Linear Regression in Machine Learning. Available:
https://www.geeksforgeeks.org/ml-linear-regression/
|
| [20] |
Poisson Distributions | Definition, Formula & Examples. Available:
https://www.scribbr.com/statistics/poisson-distribution/
|
| [21] |
Normal Distribution: What It Is, Uses, and Formula. Available:
https://www.investopedia.com/terms/n/normaldistribution.asp
|
| [22] |
Cross Validation in Machine Learning. Available:
https://www.geeksforgeeks.org/cross-validation-machine-learning/
|
| [23] |
Wireshark. Available:
https://www.wireshark.org/
|
| [24] |
Aouedi, O. “Machine Learning-enabled network traffic analysis,” Ph. D. dissertation, Nantes Univ., 2022.
|
| [25] |
iPerf - The TCP, UDP, and SCTP network bandwidth measurement tool. [Online]. Available:
https://iperf.fr/
|
| [26] |
Rakhmatov, F. “Analysis of threats to web applications and existing methods of protection,” Int. Sci. J. Manage. Market. Finance, vol. 1, no. 2, pp. 96-99, 2024. Available:
http://dx.doi.org/10.5281/zenodo.11380401
|
| [27] |
Sheng, S. and Wang, X. “Network traffic anomaly detection method based on chaotic neural network,” Alex. Eng. J., vol. 77, pp. 567-579, 2023. Available:
https://doi.org/10.1016/j.aej.2023.07.019
|
| [28] |
Python (programming language). Available:
https://en.wikipedia.org/wiki/Python_(programming_language)
|
| [29] |
Dong, S., and Sarem, M. “DDoS attack detection method based on improved KNN with the degree of DDoS attack in software-defined networks,” IEEE Access, vol. 8, pp. 5039-5048, 2019. Available:
https://doi.org/10.1109/ACCESS.2019.2963077
|
| [30] |
Lee, S., Levanti, K. and Kim, H. S. “Network monitoring: Present and future,” Comput. Netw., vol. 65, pp. 84-98, 2014. Available:
https://doi.org/10.1016/j.comnet.2014.03.007
|
| [31] |
Hänsch, R. Handbook of Random Forests: Theory and Applications for Remote Sensing. Singapore: World Scientific, 2025. Available:
https://doi.org/10.1142/13600
|
| [32] |
ENISA, “ENISA Threat Landscape 2025,” European Union Agency for Cybersecurity, Jan. 2025. [Online]. Available:
https://www.enisa.europa.eu/publications/enisa-threat-landscape-2025
|
Cite This Article
-
APA Style
Mukhammadjon, M., Furkat, R., Oybek, K., Norbek, K., Fakhriddin, A. (2025). Algorithm for Detection and Classification of Anomalies in the Traffic of Electronic Network Resources. Advances in Applied Sciences, 10(3), 88-96. https://doi.org/10.11648/j.aas.20251003.15
 Copy
|
Copy
|
 Download
ACS Style
Mukhammadjon, M.; Furkat, R.; Oybek, K.; Norbek, K.; Fakhriddin, A. Algorithm for Detection and Classification of Anomalies in the Traffic of Electronic Network Resources. Adv. Appl. Sci. 2025, 10(3), 88-96. doi: 10.11648/j.aas.20251003.15
Copy
|
Download
AMA Style
Mukhammadjon M, Furkat R, Oybek K, Norbek K, Fakhriddin A. Algorithm for Detection and Classification of Anomalies in the Traffic of Electronic Network Resources. Adv Appl Sci. 2025;10(3):88-96. doi: 10.11648/j.aas.20251003.15
Copy
|
Download
-
@article{10.11648/j.aas.20251003.15,
  author = {Musaev Mukhammadjon and Rakhmatov Furkat and Kholmuminov Oybek and Karimov Norbek and Abdirazakov Fakhriddin},
  title = {Algorithm for Detection and Classification of Anomalies in the Traffic of Electronic Network Resources
},
  journal = {Advances in Applied Sciences},
  volume = {10},
  number = {3},
  pages = {88-96},
  doi = {10.11648/j.aas.20251003.15},
  url = {https://doi.org/10.11648/j.aas.20251003.15},
  eprint = {https://article.sciencepublishinggroup.com/pdf/10.11648.j.aas.20251003.15},
  abstract = {This study addresses the challenge of detecting and classifying advanced cyber threats, including distributed denial-of-service (DDoS) and Stealth Attacks, in complex network environments. We propose a hybrid approach that combines machine learning models with a rule-based classifier to improve anomaly detection accuracy. The method uses Random Forest, Gradient Boosting, and Linear Regression to predict normal traffic volume with high precision (R² = 0.99, MSE = 0.000085). Key features include request rate, traffic volume, source IP entropy, flow duration, and protocol diversity. A deviation threshold of 0.5 standard deviations from predicted values effectively identifies anomalies under dynamic conditions. For classification, we introduce a rule-based system that utilizes thresholds, such as a request rate exceeding 100 requests per second for DDoS attacks or a source IP entropy of approximately 0.6907 for Stealth Attacks. This classifier identifies six types of anomalies: DDoS, Slow, Volumetric, Service Outage, Application Layer, and Stealth Attacks. The experimental results demonstrate the effectiveness of our hybrid approach. Compared to existing methods, it achieves higher F1-scores (0.97-1.00) across most attack types. Additionally, it correctly classifies 91% of real traffic (1,246,311 packets) as usual in a synthetic dataset containing 9,660 flows. The proposed method demonstrates strong performance in terms of precision, recall, and computational efficiency, making it suitable for real-time network monitoring.
},
 year = {2025}
}
Copy
|
Download
-
TY  - JOUR
T1  - Algorithm for Detection and Classification of Anomalies in the Traffic of Electronic Network Resources

AU  - Musaev Mukhammadjon
AU  - Rakhmatov Furkat
AU  - Kholmuminov Oybek
AU  - Karimov Norbek
AU  - Abdirazakov Fakhriddin
Y1  - 2025/09/11
PY  - 2025
N1  - https://doi.org/10.11648/j.aas.20251003.15
DO  - 10.11648/j.aas.20251003.15
T2  - Advances in Applied Sciences
JF  - Advances in Applied Sciences
JO  - Advances in Applied Sciences
SP  - 88
EP  - 96
PB  - Science Publishing Group
SN  - 2575-1514
UR  - https://doi.org/10.11648/j.aas.20251003.15
AB  - This study addresses the challenge of detecting and classifying advanced cyber threats, including distributed denial-of-service (DDoS) and Stealth Attacks, in complex network environments. We propose a hybrid approach that combines machine learning models with a rule-based classifier to improve anomaly detection accuracy. The method uses Random Forest, Gradient Boosting, and Linear Regression to predict normal traffic volume with high precision (R² = 0.99, MSE = 0.000085). Key features include request rate, traffic volume, source IP entropy, flow duration, and protocol diversity. A deviation threshold of 0.5 standard deviations from predicted values effectively identifies anomalies under dynamic conditions. For classification, we introduce a rule-based system that utilizes thresholds, such as a request rate exceeding 100 requests per second for DDoS attacks or a source IP entropy of approximately 0.6907 for Stealth Attacks. This classifier identifies six types of anomalies: DDoS, Slow, Volumetric, Service Outage, Application Layer, and Stealth Attacks. The experimental results demonstrate the effectiveness of our hybrid approach. Compared to existing methods, it achieves higher F1-scores (0.97-1.00) across most attack types. Additionally, it correctly classifies 91% of real traffic (1,246,311 packets) as usual in a synthetic dataset containing 9,660 flows. The proposed method demonstrates strong performance in terms of precision, recall, and computational efficiency, making it suitable for real-time network monitoring.

VL  - 10
IS  - 3
ER  -
Copy
|
Download