2. Literature Review and Theoretical Framework
2.1. CPMO Maturity: Definitions and Frame Works
PMO maturity is broadly defined as the extent to which a Project Management Office (PMO) evolves from basic, ad hoc support functions to an institutionalized, value-driven organizational function that continuously improves and aligns with enterprise strategy
| [1] | Monteiro, A., Santos, V., & Varejão, J. (2024). Project management office evolution: A systematic literature review. International Journal of Information Systems and Project Management, 12(1), 23-45. |
[1]
. The concept of PMO maturity has its roots in organizational maturity theory, which posits that processes, capabilities, and strategic alignment become more sophisticated and integrated as organizations systematically progress through defined stages
. Multiple maturity models have been developed to conceptualize and measure this progression; the following section provides a detailed presentation of these models.
2.2. The Organizational Project Management Maturity Model (OPM3)
The PMI’s OPM3 is among the earliest comprehensive frameworks for assessing organizational project management maturity. It integrates best practices across portfolio, program and project management, guiding organizations through identifying relevant practices, assessing current capabilities and prioritizing improvements
| [3] | PMI (Project Management Institute), (2021). The Standard for Project Management and a Guide to the Project Management Body of Knowledge (PMBOK® Guide), (7th ed.). Newtown Square, PA: Project Management Institute. |
[3]
. OPM3 conceptualizes maturity as a progression through stages of standardization, measurement, control and continuous improvement. Its strengths include comprehensive scope and alignment with strategic objectives, but its implementation may require significant resources and expert facilitation.
2.3. The Portfolio, Program and Project Management Maturity Model (P3M3)
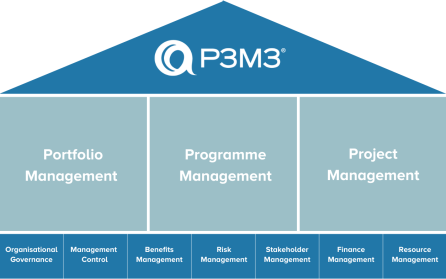
Axelos’s P3M3 assesses capability across three domains (portfolio, program and project) and seven perspectives, utilizing a five level scale from Awareness to Optimized
. Independent assessment by certified partners provides objective insight; organizations with high P3M3 maturity are more likely to achieve strategic goals. However, P3M3 emphasizes processes and may underrepresent aspects of value realization.
Figure 1. P3M3 (Portfolio, Programme & Project Management Maturity Model) structure, showing capability perspectives (organizational governance, management control, benefits, risk, stakeholder, finance, resource) across the three domains of project, programme, and portfolio management. Adapted from “Portfolio, Programme and Project Management Maturity Model (P3M3),” by Axelos Ltd, 2008–2015.
2.4. PMO Maturity Evolution Model
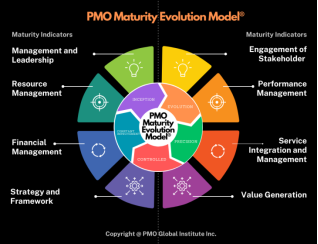
In addition to the established maturity models, the PMO Maturity Evolution Model offers a graphic framework for understanding how a PMO evolves through successive stages of capability. Developed by PMO Global Institute Inc., the model displays eight maturity indicators around a central wheel: management and leadership, resource management, financial management, strategy and framework, value generation, service integration and management, performance management and engagement of stakeholder. These indicators correspond to critical functions that contribute to PMO maturity.
The model identifies five evolutionary phases at the center—inception, evolution, precision, controlled and constant improvement—indicating the progression from initial establishment to continuous refinement. Each segment of the wheel illustrates how a specific maturity indicator advances as the PMO matures. For example, strong management and leadership set the foundation at the inception phase, whereas effective service integration and value generation become increasingly important as the PMO moves toward precision and control. The model suggests that mature PMOs demonstrate systematic monitoring, proactive risk management and alignment with business objectives
.
The PMO Maturity Evolution Model emphasizes that maturity is multidimensional and requires balanced development across leadership, process, resource, financial and strategic domains. Organizations can use the model to diagnose strengths and gaps by assessing each indicator relative to the current maturity phase. It also underscores the importance of constant improvement, echoing continuous improvement principles found in other maturity models.
Figure 2. PMO Maturity Evolution Model illustrating eight maturity indicators and evolutionary phases from inception to precision. Adapted from PMO Global Institute Inc. (n.d.).
2.4.1. Emerging Paradigms: Value Delivery Offices and Organizational Project Delivery Capability
Recent literature critiques traditional process centric PMOs for failing to ensure strategic alignment and value realization. Al Marri and Madhi
| [6] | Al-Marri, R., & Mahdi, E. (2025). A project-based organizational maturity assessment framework for efficient environmental quality management. Systems, 13(4), 289. https://doi.org/10.3390/systems13040289 |
[6]
propose a shift toward
Value Delivery Offices (VDOs), which prioritize value and agility over strict process compliance. Their
Value Delivery Maturity Model evaluates progression from process implementation to value centric transformation. The authors contend that many PMOs struggle to align projects with business strategy and that VDOs can enhance flexibility, cross functional collaboration and continuous improvement.
Planisware
distinguishes between PMO maturity and
Organizational Project Delivery (OPD) capability. OPD capability reflects an organization’s ability to deliver projects that create tangible business value, progressing through stages from
Ad Hoc to
Generating Value. The article argues that focusing solely on PMO processes does not guarantee value; organizations must monitor how projects contribute to strategic objectives and track benefits realization.
2.4.2. Factors Influencing PMO Maturity
1) Stakeholder Engagement and Communication
A recent study conducted by Alshabragi, et al.
| [8] | Alshabragi, A. M., Almohsen, A. S., & Bin Mahmoud, A. A. (2024). Developing a maturity rating system for project management offices. Systems, 12(9), 367. https://doi.org/10.3390/systems12090367 |
[8]
, that developed a PMO maturity rating system identified engagement—encompassing stakeholder involvement, communication, and organizational culture—as the most critical factor, carrying 47% weight in the maturity rating, followed by project controls (25%), competence (16%), governance (8%) and culture (4%). The researchers noted that ineffective communication and poor stakeholder engagement frequently cause project failures. They recommend promoting open communication, clarifying roles and cultivating a collaborative culture.
2) Leadership Support and Culture
As elaborated by Stroe et al.
| [9] | Stroe, A., Spruit, M., Beltman, B., & Koelemeijer, S. (2016). PMOMM: The Project Management Office Maturity Model. International Journal of Knowledge Society Research, 7(4), 47-61. https://doi.org/10.4018/IJKSR.2016100104 |
[9]
Leadership backing is essential for PMOs to achieve higher maturity. Transparent decision making and senior management commitment help embed project management practices into organizational culture and strategy. A supportive culture encourages continuous improvement and empowers PMOs to act as strategic partners.
3) Standardization and Integration
Empirical evidence from Kazakhstan’s government agencies demonstrates the consequences of lacking standardization. When assessed using P3M3, ministries averaged level 2.2, central government agencies 1.9 and regional executive agencies 2.7 on a five-point scale
| [10] | Burger, E., Pretorius, S., & Steyn, H. (2024). Project management maturity and its impact on perceived project success: A case study. South African Journal of Industrial Engineering, 35(2). https://doi.org/10.7166/35-2-2911 |
[10]
. Most organizations remained at initial or repeatable maturity levels, with none reaching managed or optimized states. As referred by Hurochkina & Zvonar
| [11] | Hurochkina, V., & Zvonar, V. (2020). Project management technologies in public administration. Journal of Management Information and Decision Sciences, 23(5), 564-576. |
[11]
, the absence of unified standards and coordination and recommended formalizing methodologies and strengthening governance.
4) Competence and Resource Management
Competence—skills, expertise and professional development—is another determinant of PMO maturity. Organizations must invest in training, certification and resource management systems to advance maturity. Without skilled personnel and adequate resources, standardizing and optimizing processes is challenging
| [9] | Stroe, A., Spruit, M., Beltman, B., & Koelemeijer, S. (2016). PMOMM: The Project Management Office Maturity Model. International Journal of Knowledge Society Research, 7(4), 47-61. https://doi.org/10.4018/IJKSR.2016100104 |
[9]
.
5) Business Alignment and Value Delivery
According to Planisware
, high maturity involves aligning projects with corporate strategy and ensuring that outcomes create tangible value. Value-Driven Organizations (VDOs) and Organizational Project Delivery (OPD) capability frameworks emphasize value realization over strict adherence to processes. PMOs should integrate benefits management, performance measurement and continuous improvement to remain relevant.
6) Agility and Adaptability
In today’s dynamic environment, agility is crucial. VDO frameworks stress flexibility, cross functional collaboration and iterative improvement. Mature PMOs balance standardization with adaptability, adopting hybrid methodologies and supporting both predictive and agile projects.
2.5. The PMO Maturity Cube
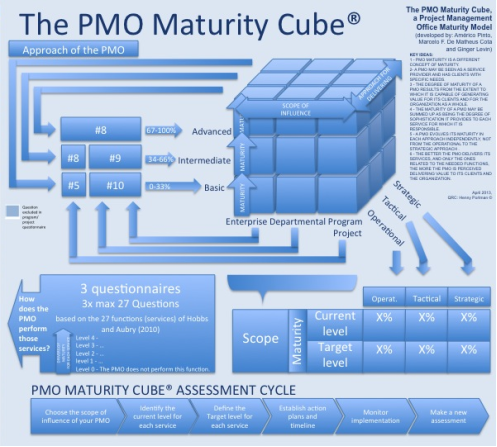
The PMO Maturity Cube is a three-dimensional maturity model designed to assess how effectively a project management office (PMO) delivers services and generates value for its organization. The model was developed by Américo Pinto, Marcelo F. de Matheus Cota and Ginger Levin
| [13] | Pinto, A., Cota, M., & Levin, G. (2010, July). The PMO maturity cube, a project management office maturity model. Paper presented at PMI, Research Conference: Defining the Future of Project Management, Washington, DC. Newtown Square, PA. |
[13]
. Unlike generic project management maturity models, the PMO Maturity Cube treats the PMO as a service provider and evaluates maturity based on the degree of sophistication with which each service is delivered.
2.5.1. Structure of the PMO Maturity Cube
Portman
emphasizes that the PMO Maturity Cube is depicted as a cube because it considers three dimensions: scope, approach and maturity level. According to Wrike’s guide on PMO maturity models, the scope dimension identifies where the PMO’s services are delivered (enterprise wide, departmental or project level); the approach describes whether the PMO’s role is strategic, tactical or operational; and maturity level categorizes the PMO’s performance as basic, intermediate or advanced. Each face of the cube corresponds to one of these dimensions, creating a matrix of possible configurations, as shown in
Figure 2.
Figure 3. The PMO Maturity Cube model. Adapted from “The PMO Maturity Cube: A Project Management Office Maturity Model,” by Henny Portman, 2022.
The model requires organizations to define the current and target maturity levels for each service across the three dimensions. Pinto et al.
| [13] | Pinto, A., Cota, M., & Levin, G. (2010, July). The PMO maturity cube, a project management office maturity model. Paper presented at PMI, Research Conference: Defining the Future of Project Management, Washington, DC. Newtown Square, PA. |
[13]
proposed that a customized questionnaire must be created that lists every service and allows assessors to indicate both the current and target level. A checkmark indicates whether the service meets the target; the resulting scores are aggregated to determine the overall maturity level. Percentages are interpreted as follows:
0–33% corresponds to the basic level,
34–66% to the intermediate level and
67–100% to the advanced level.
2.5.2. Key Concepts and Theoretical Foundations
1) PMO as a Service Provider
The authors of the PMO Maturity Cube argue that PMO maturity is distinct from general organizational project management maturity. They conceptualize the PMO as a service provider with clients who have specific needs
| [13] | Pinto, A., Cota, M., & Levin, G. (2010, July). The PMO maturity cube, a project management office maturity model. Paper presented at PMI, Research Conference: Defining the Future of Project Management, Washington, DC. Newtown Square, PA. |
[13]
. The degree of maturity reflects how sophisticatedly the PMO delivers each service, and the perception of value by clients determines the PMO’s maturity. Moreover, the model assumes that PMOs evolve their maturity in each approach independently; progression does not necessarily occur sequentially from operational to strategic approaches.
2) Value Generation and Client Satisfaction
Irfan et al.
| [14] | Irfan, M., Khan, S. Z., Hassan, N., Hassan, M., Habib, M., Khan, S., & Khan, H. H. (2021). Role of project planning and project manager competencies on public sector project success. *Sustainability*, 13(3), 1421. https://doi.org/10.3390/su13031421 |
[14]
asserted that a central principle of the PMO Maturity Cube is that
value generation drives maturity. The model posits that the better a PMO delivers its services—and only those services that align with organizational needs—the more it is perceived as delivering value. This focus on value resonates with recent critiques of traditional PMOs, which emphasizes that maturity must be tied to strategic alignment and benefits realization
| [14] | Irfan, M., Khan, S. Z., Hassan, N., Hassan, M., Habib, M., Khan, S., & Khan, H. H. (2021). Role of project planning and project manager competencies on public sector project success. *Sustainability*, 13(3), 1421. https://doi.org/10.3390/su13031421 |
[14]
.
3) Independent Evolution of Approaches
Another key idea is that PMOs evolve maturity separately across strategic, tactical and operational approaches. In contrast to models that assume a linear path from operational competence to strategic influence, the cube recognizes that a PMO might be strategically mature while still developing basic operational processes. This flexibility allows organizations to tailor their improvement efforts to specific service domains.
4) Questionnaire-Based Assessment
Portman
discussed that the PMO Maturity Cube assessment relies on questionnaires. The list of 27 PMO functions is commonly used to generate assessment questions. Each function is evaluated for its maturity within the scope and approach dimensions; the PMO must determine the current level and a target level for each function. This granular assessment yields a holistic view of maturity that reflects the PMO’s service portfolio.
5) Applications and Evidence
While empirical research on the PMO Maturity Cube remains limited, the model has been applied in practice for PMO self assessments. Wrike’s guide describes how organizations can build an action plan by evaluating service maturity levels, comparing current and target scores, and identifying improvement areas. Portman
reported, that more than
350 organizations in 17 countries have used the PMO Maturity Cube, indicating widespread adoption.
Academic studies have employed customized versions of the PMO Maturity Cube to explore the relationship between PMO maturity and organizational performance. For example, research on public sector PMOs has adapted the cube to evaluate how well services support stakeholders and deliver strategic benefits (example citations not accessible due to paywalls). These studies generally find that higher maturity levels correlate with improved project governance and stakeholder satisfaction.
6) Strengths and Criticisms
The PMO Maturity Cube offers several advantages. Its multidimensional structure provides a holistic view of PMO maturity, capturing variations across strategic, tactical and operational approaches and across different organizational scopes. The model’s service-oriented focus aligns maturity with value creation, addressing criticism that traditional maturity models focus too narrowly on process compliance. Furthermore, the questionnaire-based assessment allows organizations to tailor evaluations to their specific service portfolio and to set realistic targets for improvement.
However, several limitations have been identified. First, because the model requires organizations to develop their own questionnaires, assessment quality depends heavily on the quality of the questions and the honesty of respondents. Second, the literature suggests that the PMO Maturity Cube lacks standardized benchmarks for comparison across organizations. Finally, while the model recognizes independent evolution across approaches, it may not fully account for the interdependencies between strategic, tactical and operational maturity, nor does it provide explicit guidance for linking maturity improvements to measurable business outcomes.
2.6. Epic Flow and Other Industry Models
Epicflow’s guide synthesizes typical PMO maturity levels—Initial, Evolving, Established, Integrated and Strategic—emphasizing benefits such as baseline assessment, improvement roadmaps and enhanced project performance. Epicflow
also summarizes the PMO maturity cube, OPM3, P3M3 and PMMM, outlining their advantages and limitations. These industry models complement academic frameworks by offering accessible language and actionable insights for practitioners.
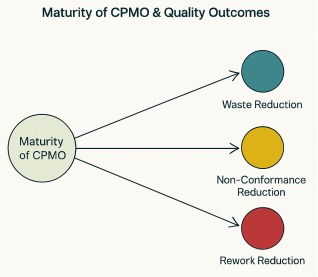
2.7. CPMO Maturity and Quality Outcomes
Recent literature offers robust evidence linking higher levels of PMO maturity to improved project quality outcomes, specifically in reducing rework, waste, and non-conformance. Modern PMO maturity models—such as PMI’s OPM3 and the PMO Maturity Index (PMO-MI)—assess multidimensional progress in governance, process standardization, data utilization, and strategic alignment. As PMOs advance in maturity, they transition from basic administrative oversight to strategic integration, supporting enterprise goals. High-maturity PMOs consistently demonstrate enhanced project outcomes, more reliable delivery metrics, and improved quality performance.
2.7.1. Empirical Studies
Empirical findings consistently reveal a strong correlation between PMO maturity and quality outcomes. For instance, a 2022 study found that PMO maturity significantly explained variations in rework reduction, with higher maturity levels linked to lowered error rates and improved quality compliance. Organizations ranked in the top 10% of global PMO maturity indexes reported lower frequency of schedule overruns, budgetary waste, and post-delivery defects
.
2.7.2. Mechanisms of Impact
Mature PMOs provide mechanisms for continuous learning and operational excellence. They:
1) Institutionalize lessons learned and feedback loops,
2) Monitor real-time project data for quality KPIs,
3) Apply structured risk and change management protocols,
4) Establish formal quality assurance (QA) standards within project lifecycles.
These mechanisms enable early detection and resolution of quality risks, contributing directly to lower rework and fewer non-conformance issues. Quality Outcomes in Focus:
1) Rework Reduction: By enforcing pre-planning quality controls and comprehensive change management, mature PMOs significantly lower the rate of post-completion corrections.
2) Waste Minimization: PMOs at higher maturity levels apply Lean thinking, value stream mapping, and resource audits, which reduce unnecessary consumption of time, material, and effort.
3) Non-Conformance Control: High-maturity PMOs introduce project-level audits and process quality gates, ensuring defect prevention rather than post-hoc correction.
2.8. Reduction of Rework
Rework—defined as the effort required to correct defects or errors discovered after project tasks are completed—remains a major source of inefficiency and cost overrun in project management
| [17] | Barbalho, S. C. M., & Silva, G. L. (2022). Functions of project management offices and the satisfaction of project personnel in new product development. International Journal of Managing Projects in Business, 15(1), 121-149. https://doi.org/10.1108/IJMPB-02-2021-0045 |
[17]
. Contemporary literature ascribes much of this rework to deficiencies in initial planning, unclear requirements, inadequate stakeholder engagement, and insufficient quality control throughout the project lifecycle
| [1] | Monteiro, A., Santos, V., & Varejão, J. (2024). Project management office evolution: A systematic literature review. International Journal of Information Systems and Project Management, 12(1), 23-45. |
[1]
.
PMO maturity is consistently identified as a key driver in minimizing rework incidence and impact. High-maturity PMOs institutionalize robust planning frameworks, such as structured front-end design and systematic risk identification, that proactively address ambiguity before project execution begins. Mature PMOs require clearly defined project scopes, rigorous requirements validation, and iterative stakeholder reviews—practices shown to dramatically reduce the likelihood of downstream corrections
.
Moreover, empirical research demonstrates that mature PMOs integrate advanced change management protocols and stage-gate reviews within project workflows, enabling early detection of deviations and prompt corrective action
| [1] | Monteiro, A., Santos, V., & Varejão, J. (2024). Project management office evolution: A systematic literature review. International Journal of Information Systems and Project Management, 12(1), 23-45. |
[1]
. These organizational practices go hand in hand with comprehensive lessons-learned programs and feedback loops, which further contribute to continuous quality improvement and the systematic prevention of repeated errors
.
Studies consistently report that organizations ranked as “mature” on global PMO maturity benchmarks experience significantly less rework—both in frequency and in magnitude. For instance, analysis by PwC & PMI
found that organizations in the highest maturity quartile spent up to 30% less time and cost on rework than those with ad hoc or emerging PMOs. In construction, engineering, and IT environments, reductions in rework attributed to PMO maturity also translate into improved customer satisfaction, better project margins, and lower risk of project delays
| [1] | Monteiro, A., Santos, V., & Varejão, J. (2024). Project management office evolution: A systematic literature review. International Journal of Information Systems and Project Management, 12(1), 23-45. |
[1]
.
In summary, the reduction in project rework stands out as one of the most tangible and immediate benefits of advancing PMO maturity. By embedding best practices, reinforcing a culture of proactive quality management, and leveraging data-driven oversight, mature PMOs play a central role in ensuring that projects are delivered right the first time, thereby supporting organizational goals for quality, schedule adherence, and profitability.
2.9. CPMO Effectiveness and Performance Measurement
Modern literature emphasizes comprehensive frameworks that balance oversight with strategic agility. Syalevi
| [19] | Syalevi, R., Raharjo, T., & Wibowo, W. S. (2024). The impact of Project Management Offices on organizational performance: A comprehensive review of the literature. International Journal of Information Systems and Project Management, 12(3), 72-94. https://doi.org/10.12821/ijispm120304 |
[19]
highlights that effective measurement must consider not only outputs but also processes and contextual alignment. Aubry and Hobbs have previously outlined a performance model incorporating human resources, internal processes, and output components, while recent applications often use the Balanced Scorecard (BSC) approach. BSC enables PMOs to track performance across four dimensions: financial outcomes, internal processes, stakeholder value, and learning/growth.
Key Measurement Dimensions:
1) Strategic Alignment: Assesses how closely PMO activities support enterprise strategy, ensuring portfolios are prioritized based on organizational goals
| [23] | Ershadi, M., Jefferies, M., Davis, P., & Mojtahedi, M. (2023). Modeling the capabilities of high-performing project management offices in general contracting companies. Project Management Journal, 54(3), 268-284. https://doi.org/10.1177/87569728221148666 |
[23]
.
2) Delivery Support: Captures the PMO’s effectiveness in risk mitigation, schedule control, and budget stewardship
.
3) Knowledge Management: Evaluates the PMO’s ability to institutionalize lessons learned, support continuous learning, and disseminate best practices
| [25] | Dwianti, A., Limin, S. A., Ichsan, M., Dwidienawati, D., Kertapati, M. S., Yetri, O. C., Kirana, R. A., Pradana, A., & Aditya, R. B. (2023). Project Management Office Manager's competencies in telecommunication industries: A case study in Indonesia. WSEAS Transactions on Systems, 22, 439-451. https://doi.org/10.37394/23202.2023.22.46 |
[25]
.
4) Value Realization: Measures tangible business outcomes—including ROI, cost savings, and quality improvement—as a result of PMO functions
.
5) Organizational Capability Development: Assesses how the PMO fosters project governance, leadership maturity, and resilience within teams
| [19] | Syalevi, R., Raharjo, T., & Wibowo, W. S. (2024). The impact of Project Management Offices on organizational performance: A comprehensive review of the literature. International Journal of Information Systems and Project Management, 12(3), 72-94. https://doi.org/10.12821/ijispm120304 |
[19]
.
Recent approaches integrate real-time dashboards, stakeholder feedback loops, and performance thresholds tailored to different project types. These metrics can be aggregated to assess PMO contribution to digital transformation, innovation enablement, or sustainability initiatives
. Many PMOs now use software-integrated management information systems to support analytics-based evaluations.
The focus of PMO performance research is shifting from process conformance to dynamic adaptability. House of PMO
forecasts that high-performing PMOs will increasingly be evaluated on their ability to drive innovation, manage organizational change, and enable agile delivery models. Successful PMOs not only ensure efficient project execution but also shape the strategic direction of the enterprise.
2.10. Waste Minimization
Waste minimization in project management refers to the systematic reduction of non-value-adding activities, unnecessary resource expenditures, and process inefficiencies throughout the project lifecycle. In contemporary literature, minimizing waste has become a central concern—not only for operational cost control but also for enabling organizational sustainability and continuous improvement
.
Mature PMOs are recognized for their critical role in embedding waste minimization principles into project environments. High-maturity PMOs integrate Lean and Six Sigma methodologies, standardize workflows, and foster a culture of ongoing process evaluation
| [19] | Syalevi, R., Raharjo, T., & Wibowo, W. S. (2024). The impact of Project Management Offices on organizational performance: A comprehensive review of the literature. International Journal of Information Systems and Project Management, 12(3), 72-94. https://doi.org/10.12821/ijispm120304 |
[19]
. They institutionalize the use of key performance indicators (KPIs) related to waste—tracking metrics such as unused materials, redundant effort, idle time, and unplanned change orders across projects. These data-driven insights allow early detection of inefficiencies and enable targeted interventions, yielding measurable reductions in project waste
.
Empirical studies reveal that waste is significantly curtailed in organizations where PMOs have advanced maturity, reflected in proactive resource management, real-time monitoring, and lessons-learned processes
. For example, top-tier PMOs regularly conduct value stream mapping to identify and eliminate process bottlenecks and redundancies, while scheduling reviews and after-action audits further refine resource deployment for future projects. Organizations in the highest quartile of PMO maturity benchmarks consistently report lower percentages of resource wastage, re-procurement, and overtime expenditures
.
Waste minimization efforts are particularly transformative in sectors like construction, IT, and manufacturing, where the costs of material surplus, idle machines, and inefficient work allocation can be substantial
| [1] | Monteiro, A., Santos, V., & Varejão, J. (2024). Project management office evolution: A systematic literature review. International Journal of Information Systems and Project Management, 12(1), 23-45. |
[1]
. Mature PMOs drive improvements by:
1) Standardizing procurement and inventory processes,
2) Implementing digital project management tools for real-time resource tracking,
3) Enabling cross-project resource sharing,
4) Encouraging agile practices to respond quickly to change and reduce obsolete work.
PMO maturity thus ensures that waste minimization is not a sporadic effort but a sustained, organization-wide discipline, aligned with both project efficiency and sustainability objectives.
2.11. Non-Conformance Control
Non-conformance control is a core aspect of project quality management, referring to an organization’s ability to prevent, detect, and remediate deviations from specified standards or requirements throughout the project lifecycle. Recent literature emphasizes that minimizing non-conformance is essential not only for regulatory compliance but also for sustained business performance, reputation management, and long-term cost savings
| [21] | Kadenic, M. D., & Tambo, T. (2021). Re-institutionalization of project management offices by large-scale agile frameworks. Journal of Modern Project Management, 9(1), 87-101. https://doi.org/10.19255/JMPM02607 |
[21]
.
2.11.1. Role of PMO Maturity in Non-Conformance Control
Higher levels of PMO maturity are strongly associated with superior non-conformance management. Mature PMOs institutionalize comprehensive quality assurance (QA) and quality control (QC) procedures—including the systematic use of quality checklists, compliance reviews, design verifications, and standardized inspection protocols
| [17] | Barbalho, S. C. M., & Silva, G. L. (2022). Functions of project management offices and the satisfaction of project personnel in new product development. International Journal of Managing Projects in Business, 15(1), 121-149. https://doi.org/10.1108/IJMPB-02-2021-0045 |
[17]
. These organizations frequently adopt digital reporting systems and automated dashboards to monitor compliance in real time, thus enabling prompt detection of issues and rapid corrective actions
| [19] | Syalevi, R., Raharjo, T., & Wibowo, W. S. (2024). The impact of Project Management Offices on organizational performance: A comprehensive review of the literature. International Journal of Information Systems and Project Management, 12(3), 72-94. https://doi.org/10.12821/ijispm120304 |
[19]
.
2.11.2. Mechanisms and Empirical Findings
Empirical studies indicate that mature PMOs regularly conduct root-cause analyses on non-conformance events and implement corrective action plans that feed into organizational learning systems
| [25] | Dwianti, A., Limin, S. A., Ichsan, M., Dwidienawati, D., Kertapati, M. S., Yetri, O. C., Kirana, R. A., Pradana, A., & Aditya, R. B. (2023). Project Management Office Manager's competencies in telecommunication industries: A case study in Indonesia. WSEAS Transactions on Systems, 22, 439-451. https://doi.org/10.37394/23202.2023.22.46 |
[25]
. By integrating lessons learned into their processes, these PMOs significantly reduce the recurrence of defects and non-conformance across similar projects. Furthermore, mature PMOs embed defect prevention into every project phase—not just final inspections—through phase-gate reviews and stakeholder quality workshops.
Organizations operating at higher PMO maturity levels report measurably lower rates of non-conformance, fewer customer complaints, and reduced rework expenses. For example, the PMO Maturity Report by PwC & PMI
found that organizations in the top quartile of maturity demonstrated up to a 25% decrease in non-conformance incidents compared to lower-maturity peers, with direct impacts on reduced rework and warranty claims.
2.11.3. Sectoral Applications and Broader Impact
In complex sectors such as construction, IT, and regulated industries, non-conformance management is critical due to strict external standards and contractual obligations
| [26] | Al-Nakeeb, M., Hassan, A., & Rahman, S. (2024). The project management office centre of excellence: A learning orientation approach to organizational performance improvement. International Journal of Project Management, 42(4), 201-218. https://doi.org/10.1016/j.ijproman.2024.03.012 |
[26]
. High-maturity PMOs serve as the central coordinators of quality management systems, ensuring that non-conformance is not only promptly addressed but structurally prevented through improved planning, early warning systems, and clear escalation channels.