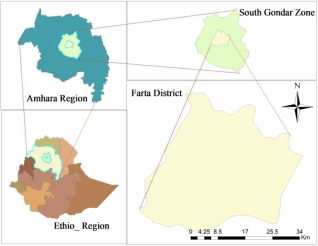
Through the use of path coefficient analysis and correlation, crop breeders can improve complex traits like grain yield through indirect selection. The current study set out to quantify the relationship between yield and traits related to yield as well as pinpoint critical features for indirect selection aimed at enhancing the grain yield of faba bean. The objective of the current study was to identify key characteristics for indirect selection targeted at increasing the grain yield of faba beans as well as quantify the relationship between yield and variables related to yield. The study was conducted at Fogera National Rice Research and Training Center at the Debre Tabor research site used a 7x7 simple lattice design with two replications to evaluate 49 faba bean genotypes during the rainy cropping season of 2022. The study found a significant positive correlation between grain yield, plant height, pod number, biomass yield, 100-seed mass, and harvest index. The study found that biomass yield and harvest index significantly impact grain yield, suggesting they can be used as indirect selection criteria to enhance faba bean grain yield.
| Published in | American Journal of BioScience (Volume 12, Issue 4) |
| DOI | 10.11648/j.ajbio.20241204.11 |
| Page(s) | 101-109 |
| Creative Commons |
This is an Open Access article, distributed under the terms of the Creative Commons Attribution 4.0 International License (http://creativecommons.org/licenses/by/4.0/), which permits unrestricted use, distribution and reproduction in any medium or format, provided the original work is properly cited. |
| Copyright |
Copyright © The Author(s), 2024. Published by Science Publishing Group |
Biomass Yield, Indirect Selection, Grain Yield, Harvest Index
Genotypes | Genotypes | ||
|---|---|---|---|
1 | Cool-0030 | 26 | EH011029-2 |
2 | EK 01002-1-1 | 27 | EK05024-2 |
3 | Cool-0025 | 28 | EH011049-2 |
4 | EH011070-1 | 29 | ET 07013-1 |
5 | EH011040-1 | 30 | EK 01006-7-1 |
6 | EH011001-1 | 31 | EK 01015-1-1 |
7 | EH011093-2 | 32 | EH011037-2 |
8 | Cool-0031 | 33 | EK 05023-1 |
9 | EK 01001-5-1 | 34 | EH 06007-2 |
10 | Cool-0018 | 35 | Coll 155/00-3 |
11 | Cool-0035 | 36 | EK05005-4 |
12 | Cool-0024 | 37 | EH01048-1 |
13 | EK 01001-8-1 | 38 | Gora(S.C) |
14 | EK 05014-3 | 39 | EH99051-3 |
15 | EK05027-5 | 40 | EK 01004-2-1 |
16 | EK 01001-9-2 | 41 | EH 06028-1 |
17 | EK 01001-10-5 | 42 | EH95073-1 |
18 | EH96009-1 | 43 | EK 01019-7-5 |
19 | EH95078-6 | 44 | EH00102-4-1 |
20 | EK 01007-2-6 | 45 | R-878-3 |
21 | CSR02010-4-3 | 46 | EK 01024-1-1 |
22 | CSR02012-2-3 | 47 | EH96049-2 |
23 | EH011089-3 | 48 | EK 01021-4-1 |
24 | EK 01019-2-1 | 49 | ET 07005-1 |
25 | Numan (S.C) |
Traits | DF | DM | NB | GFP | PH | PPP | SPP | BY | HI | HSW | CS | GY |
|---|---|---|---|---|---|---|---|---|---|---|---|---|
DF | 1 | 0.33 * | -0.22 | 0.33* | -0.45 ** | -0.17 | 0.08 | 0.39 ** | -0.13 | 0.18 | 0.25 | -0.28* |
DM | 0.24* | 1 | 0.11 | 0.55 ** | -0.29* | -0.16 | -0.16 | -0.27 | 0.04 | -0.2 | 0.12 | -15 |
NB | -0.24* | 0.11 | 1 | -0.07 | 0.19 | 0.13 | 0.08 | 0.26 | 0.2 | 0.05 | -0.33* | 0.29 * |
GFP | 0.29 ** | 0.41 ** | -0.07 | 1 | -0.14 | -0.23 | -0.15 | -0.32* | -0.14 | -0.25 | 0.12 | -0.23 |
PH | -0.36** | -0.25* | 0.17 | -0.12 | 1 | 0.7** | 0.31 * | 0.8** | 0.3* | 0.24 | -0.38** | 0.69** |
PPP | -0.12 | -0.1 | 0.11 | -0.18 | 0.6** | 1 | 0.31* | 0.8** | 0.6** | 0.45** | -0.49** | 0.85** |
SPP | 0.05 | -0.15 | 0.05 | -0.08 | 0.15 | 0.21* | 1 | 0.18 | 0.34* | 0.04 | -0.35* | 0.35* |
BY | -0.31** | -0.2* | 0.22* | -0.28** | 0.71** | 0.64** | 0.04 | 1 | 0.25 | 0.37** | -0.46** | 0.73** |
HI | -0.09 | -0.02 | 0.17 | -0.12 | 0.17 | 0.52** | 0.27** | 0.06 | 1 | 0.23 | -0.35* | 0.83** |
HSW | 0.17 | -0.19 | 0.04 | -0.24* | 0.19 | 0.4** | 0.04 | 0.33** | 0.2* | 1 | -0.34* | 0.39** |
CS | 0.21 * | 0.08 | -0.3** | 0.13 | -0.34** | -0.41** | -0.25* | -0.36 ** | -0.29** | -0.3** | 1 | -0.53** |
GY | -0.25* | -0.14 | 0.27** | -0.23* | 0.62** | 0.78** | 0.24* | 0.63** | 0.76** | 0.37** | -0.48** | 1 |
DF | DM | NB | GFP | PH | PPP | SPP | BY | HI | HSW | CS | rp | |
|---|---|---|---|---|---|---|---|---|---|---|---|---|
DF | -0.00275 | -0.00069 | -0.00505 | 0.00475 | -0.01615 | 0.00042 | 0.00012 | -0.1673 | -0.06908 | 0.0075 | -0.00467 | -0.25* |
DM | -0.00068 | -0.00728 | 0.00231 | 0.00681 | -0.01105 | 0.00035 | -0.00036 | -0.11838 | -0.01572 | -0.00831 | -0.00188 | -0.14 |
NB | 0.00067 | -0.00031 | 0.02077 | -0.00125 | 0.00753 | -0.00038 | 0.00012 | 0.12533 | 0.11861 | 0.00174 | 0.00657 | 0.27** |
GFP | -0.0008 | -0.00116 | -0.00159 | 0.01626 | -0.00054 | 0.00061 | -0.00019 | -0.14264 | -0.0839 | -0.01017 | -0.00289 | -0.23* |
PH | 0.00101 | 0.0007 | 0.00355 | -0.002 | 0.04402 | -0.00197 | 0.00036 | 0.43857 | 0.12459 | 0.00817 | 0.00732 | 0.62** |
PPP | 0.00035 | 0.0003 | 0.00243 | -0.00303 | 0.02661 | -0.00327 | 0.00049 | 0.36967 | 0.36285 | 0.01706 | -0.00894 | 0.78** |
SPP | -0.00014 | 0.00043 | 0.00112 | -0.00135 | 0.00681 | -0.00069 | 0.00233 | 0.03895 | 0.19297 | 0.00191 | 0.00547 | 0.24* |
BY | 0.00081 | 0.00058 | 0.00457 | -0.00407 | 0.0339 | -0.00212 | 0.00016 | 0.70589 | 0.05259 | 0.01325 | 0.00842 | 0.63** |
HI | 0.00027 | 0.00006 | 0.00354 | -0.00196 | 0.00788 | -0.0017 | 0.00064 | 0.04305 | 0.69565 | 0.00875 | 0.00631 | 0.76** |
HSW | -0.00049 | 0.00055 | 0.00086 | -0.00392 | 0.00852 | -0.00132 | 0.00011 | 0.17868 | 0.14414 | 0.04222 | 0.00666 | 0.37** |
CS | -0.0006 | -0.00024 | -0.00639 | 0.0022 | -0.01509 | -0.00137 | -0.00059 | -0.22469 | -0.20584 | -0.01317 | -0.02133 | -0.48** |
DF | DM | NB | GFP | PH | PPP | SPP | BY | HI | HSW | CS | Rg | |
|---|---|---|---|---|---|---|---|---|---|---|---|---|
DF | 0.05791 | -0.05804 | 0.03822 | 0.12288 | 0.30259 | 0.20355 | 0.01329 | -0.8185 | -0.1654 | 0.01171 | 0.00852 | -0.28* |
DM | 0.01756 | -0.19146 | -0.01994 | 0.20369 | 0.20017 | 0.18871 | -0.02586 | -0.57218 | 0.05239 | -0.01371 | 0.00426 | -0.15 |
NB | -0.0132 | -0.02276 | -0.1677 | -0.02905 | -0.13237 | -0.15612 | 0.0126 | 0.54796 | 0.26411 | 0.00327 | -0.01152 | 0.29* |
GFP | 0.01956 | -0.10719 | 0.01339 | 0.36384 | 0.09584 | 0.26248 | -0.02382 | -0.66811 | -0.18314 | -0.01609 | 0.00424 | -0.23 |
PH | -0.02606 | 0.057 | -0.03301 | -0.05186 | -0.67243 | -0.80252 | 0.04971 | 1.78807 | 0.38815 | 0.01559 | -0.01294 | 0.69** |
PPP | -0.01041 | 0.03192 | -0.02313 | -0.08437 | -0.47676 | -1.13188 | 0.04901 | 1.71622 | 0.07707 | 0.02813 | -0.01685 | 0.85** |
SPP | 0.00495 | 0.03183 | -0.01359 | -0.0557 | -0.21488 | -0.35659 | 0.15556 | 0.38122 | 0.43067 | 0.00262 | -0.01205 | 0.354 * |
BY | -0.02311 | 0.05341 | -0.0448 | -0.11851 | -0.58619 | -0.94707 | 0.02891 | 2.05113 | 0.31744 | 0.02314 | -0.01564 | 0.73** |
HI | -0.00757 | -0.00793 | -0.03501 | -0.05267 | -0.20629 | -0.68951 | 0.05295 | 0.51463 | 1.26519 | 0.01483 | -0.01218 | 0.83** |
HSW | 0.01085 | 0.042 | -0.00879 | -0.09368 | -0.16782 | -0.50961 | 0.00652 | 0.75966 | 0.30032 | 0.06249 | 0.01153 | -0.39** |
CS | 0.01455 | -0.02407 | 0.05699 | 0.0455 | 0.25667 | 0.56262 | -0.05532 | -0.94633 | -0.45457 | -0.02126 | -0.03389 | -0.53** |
EIAR | Ethiopian Institute of Agricultural Research |
| [1] | Alamir Ayenew, Dejen Bikis, Solomon Sharie, Yasin Taye, and Zewdu Addisu. 2023. Participatory variety selection of fababean (Vicia faba L.) for yield and yield components in Gunabegemidir District, North Western Ethiopia. 4 (4): 63–70. |
| [2] | Andualem Muche Hiwotu, Alemu Abate, and Fisseha Worede. 2023. Correlation and Path coefficient analysis of yield and yield components of some Ethiopian faba bean (Vicia faba L.) accessions, 1–11. |
| [3] | Arya, R. K. 2018. Evaluation of faba bean genotypes for seed yield under haryana conditions. Forage Res, 44(1): 60-62. |
| [4] | Bullo Neda., Tileye Feyissa., Kifle Dagne and Ermias Assefa. 2021. The study of Morphological characteristics and statistics of the phenotypes and correlation in faba bean (Vicia faba L.) Germplasm. Plant Breeding and Biotech, 2021(2). |
| [5] | Chaurasia H., Arya R. K. and Choudhary R. R. 2022. Genetic variability, correlation and path analysis in faba bean ( Vicia faba ) for yield and its attributing traits under semi-arid conditions. 11(4): 530–537. |
| [6] | Dewangan N. K., Dahiya G. S., Janghel D. K. and Arya R. K. 2019. Correlation and path analysis in exotic and indigenous types of faba bean for yield and its component traits. August 2020. |
| [7] | Dewey D. R. and Lu, K. H. 1959. A correlation and path coefficient analysis of components of crested wheat grass seed production. Agronomy Journal. 5: 515-518. |
| [8] | Esho K. B. and Salih, M. M. 2021. Correlation and path coefficient analysis in faba bean (Vicia faba L.). Plant cell biotechnology and molecular biology, 22(29-30): 53-62. |
| [9] | Gizachew Yilma., Gebeyaw Achenef and Temesgen Abo. 2022. Genetic variability and character association of faba bean (Vicea faba L.) genotypes, southeastern, Ethiopia. Asian Journal of Research in Crop Science, 7(2), 38-47. |
| [10] | Johnson H. W., H. F. Robinson and R. E. Comstock. 1955. Estimation of genetic and environmental variability in soybean. Journal, 47(7): 314-318. |
| [11] | Miller P. A., Williams J. C. and Robinson H. F. 1958. Variety environmental interaction in cotton variety tests. Agronomy Journal, 51: 132-134. |
| [12] | Sharma J. R. 1998. Statistical and biometrical techniques in plant breeding. New age International limited publishers, New Delhi. Pp. 432. |
| [13] | Skovbjerg C. K., Angra D., Robertson-Shersby-Harvie T., Kreplak J., Keeble-Gagnère G., Kaur, S., Ecke W., Windhorst A., Nielsen L. K., Schiemann A., Knudsen J., Gutierrez N., Tagkouli V., Fechete L. I., Janss L., Stougaard J., Warsame A., Alves S., Khazaei H., Andersen S. U. 2023. Genetic analysis of global faba bean diversity, agronomic traits and selection signatures. Theoretical and Applied Genetics, 136(5): 1–27. |
| [14] | Tesfaye Walle, Firew Mekbib, Berhanu Amsalu, and Melaku Gedil. 2018. Correlation and path coefficient analyses of cowpea (Vigna Unguiculata L.) landraces in Ethiopia. American Journal of Plant Sciences 9(13): 2794–2812. |
APA Style
Shferaw, S. S., Tarekegne, W. (2024). Correlation and Path Coefficient Analysis of Yield and Yield Components in Faba Bean (Vicia faba L.) Genotypes. American Journal of BioScience, 12(4), 101-109. https://doi.org/10.11648/j.ajbio.20241204.11
ACS Style
Shferaw, S. S.; Tarekegne, W. Correlation and Path Coefficient Analysis of Yield and Yield Components in Faba Bean (Vicia faba L.) Genotypes. Am. J. BioScience 2024, 12(4), 101-109. doi: 10.11648/j.ajbio.20241204.11
AMA Style
Shferaw SS, Tarekegne W. Correlation and Path Coefficient Analysis of Yield and Yield Components in Faba Bean (Vicia faba L.) Genotypes. Am J BioScience. 2024;12(4):101-109. doi: 10.11648/j.ajbio.20241204.11
@article{10.11648/j.ajbio.20241204.11,
  author = {Solomon Sharie Shferaw and Wossen Tarekegne},
  title = {Correlation and Path Coefficient Analysis of Yield and Yield Components in Faba Bean (Vicia faba L.) Genotypes
},
  journal = {American Journal of BioScience},
  volume = {12},
  number = {4},
  pages = {101-109},
  doi = {10.11648/j.ajbio.20241204.11},
  url = {https://doi.org/10.11648/j.ajbio.20241204.11},
  eprint = {https://article.sciencepublishinggroup.com/pdf/10.11648.j.ajbio.20241204.11},
  abstract = {Through the use of path coefficient analysis and correlation, crop breeders can improve complex traits like grain yield through indirect selection. The current study set out to quantify the relationship between yield and traits related to yield as well as pinpoint critical features for indirect selection aimed at enhancing the grain yield of faba bean. The objective of the current study was to identify key characteristics for indirect selection targeted at increasing the grain yield of faba beans as well as quantify the relationship between yield and variables related to yield. The study was conducted at Fogera National Rice Research and Training Center at the Debre Tabor research site used a 7x7 simple lattice design with two replications to evaluate 49 faba bean genotypes during the rainy cropping season of 2022. The study found a significant positive correlation between grain yield, plant height, pod number, biomass yield, 100-seed mass, and harvest index. The study found that biomass yield and harvest index significantly impact grain yield, suggesting they can be used as indirect selection criteria to enhance faba bean grain yield.
},
 year = {2024}
}
TY  - JOUR
T1  - Correlation and Path Coefficient Analysis of Yield and Yield Components in Faba Bean (Vicia faba L.) Genotypes

AU  - Solomon Sharie Shferaw
AU  - Wossen Tarekegne
Y1  - 2024/08/06
PY  - 2024
N1  - https://doi.org/10.11648/j.ajbio.20241204.11
DO  - 10.11648/j.ajbio.20241204.11
T2  - American Journal of BioScience
JF  - American Journal of BioScience
JO  - American Journal of BioScience
SP  - 101
EP  - 109
PB  - Science Publishing Group
SN  - 2330-0167
UR  - https://doi.org/10.11648/j.ajbio.20241204.11
AB  - Through the use of path coefficient analysis and correlation, crop breeders can improve complex traits like grain yield through indirect selection. The current study set out to quantify the relationship between yield and traits related to yield as well as pinpoint critical features for indirect selection aimed at enhancing the grain yield of faba bean. The objective of the current study was to identify key characteristics for indirect selection targeted at increasing the grain yield of faba beans as well as quantify the relationship between yield and variables related to yield. The study was conducted at Fogera National Rice Research and Training Center at the Debre Tabor research site used a 7x7 simple lattice design with two replications to evaluate 49 faba bean genotypes during the rainy cropping season of 2022. The study found a significant positive correlation between grain yield, plant height, pod number, biomass yield, 100-seed mass, and harvest index. The study found that biomass yield and harvest index significantly impact grain yield, suggesting they can be used as indirect selection criteria to enhance faba bean grain yield.

VL  - 12
IS  - 4
ER  -
Ethiopian Institute of Agricultural Research (EIAR), Fogera National Rice Research and Training Center, Bahir Dar, Ethiopia
Department of Plant Sciences, College of Agriculture and Environmental Sciences, Bahir Dar University, Bahir Dar, Ethiopia
Information