The objective of this study was to evaluate the influence of raw material, decolourizing earth and temperature on the colour of bleached palm oil. Two types of decolourizing earth (American and Indian) were used. A four-factor centered composite response surface design was used to determine the effects of the different mentioned factors on the colour response of bleached palm oil at two DOBIs (2.3 and 1.3). The results obtained indicate that Indian earth with DOBI 2.3 oil has the colour variation contour lines at the high level of 16.0 red and at low level of 15.3 red. The decrease in colour around 15.4 is influenced by the effect of opposite temperature levels. The increase in color depends on the bleaching earth used. The temperature influences the colour of the bleached oil depending on the raw material. The bleaching temperature with American earth and a DOBI 1.3 oil, when it is at its high level (120°C) and at its low level (110°C), gives a colour of 15.8 red and 17.6 red, respectively. The optimal discoloration conditions (18.57 red) of CPO palm oil (P ≤ 0.05) are for American earth (with DOBI 1.3 oil): 92°C and 0.035% for temperature and percentage of phosphoric acid; 105°C and 0.6% for temperature and percentage of decolourizing earth. For Indian earth (with DOBI 2.3 oil), we have the optimum (18.66 red): 105°C and 0.035% for temperature and percentage of phosphoric acid; 118.5°C and 0.88% for temperature and percentage of decolourizing earth.
| Published in | American Journal of Chemical Engineering (Volume 13, Issue 1) |
| DOI | 10.11648/j.ajche.20251301.13 |
| Page(s) | 20-35 |
| Creative Commons |
This is an Open Access article, distributed under the terms of the Creative Commons Attribution 4.0 International License (http://creativecommons.org/licenses/by/4.0/), which permits unrestricted use, distribution and reproduction in any medium or format, provided the original work is properly cited. |
| Copyright |
Copyright © The Author(s), 2025. Published by Science Publishing Group |
Decolourizing Earth, Colour, Temperature, Palm Oil, Optimization, Experimental Design
Parameters | Earth 1 | Earth 2 | Standard |
|---|---|---|---|
Moisture (g of water/100g dry matter) | 11.76±0.06a | 9.57±0.24 b | 11% max |
pH | 7.22±0.02 a | 8.12±0.02 b | 6.5±1.0 |
Acidity | 0.29±0.01 a | 0.12’±0.01c | 0.3% max H2SO4 |
Types of decolourizing earth | Red color of the BPO |
|---|---|
Earth 1 | 15.13±0.15a |
Earth 2 | 15.78±0.49 b |
Inputs | Mass (g) | DOBI | FFA | Temperature (°C) | Percentage (%) |
|---|---|---|---|---|---|
CPO | 50 | 2.3 and 1.3 | 5.2 | ||
H3PO4 | 100 | 0.05 | |||
Decolourizing earth | 120 | 1.2 |
Products | Standards |
|---|---|
BPO | 20 red max |
RBD | 3 red max |
Oléine | 4 red max |
Real variables | Coded variables | ||||||
|---|---|---|---|---|---|---|---|
- | -1 | 0 | +1 | + | Xi | ||
Introduction temperature of phosphoric acid (°C) | X1 | 85 | 90 | 95 | 100 | 105 | 10 |
% phosphoric acid | X2 | 0.035 | 0.050 | 0.065 | 0.080 | 0.095 | 0.030 |
Introduction temperature of decolourizing earth (°C) | X3 | 105 | 110 | 115 | 120 | 125 | 10 |
% decolourizing earth | X4 | 0.6 | 0.8 | 1.0 | 1.2 | 1.4 | 0.4 |
Red colour response | Yi | ||||||
Coded values | Real values | Responses | |||||||
|---|---|---|---|---|---|---|---|---|---|
No | X1 | X2 | X3 | X4 | U1 | U2 | U3 | U4 | Y |
1 | 0 | 0 | + α | 0 | 95 | 0.065 | 125 | 1 | YAde1 |
2 | - α | 0 | 0 | 0 | 85 | 0.065 | 115 | 1 | YAde2 |
3 | + α | 0 | 0 | 0 | 105 | 0.065 | 115 | 1 | YAde3 |
4 | +1 | -1 | +1 | -1 | 100 | 0.05 | 120 | 0.8 | YAde4 |
5 | 0 | 0 | - α | 0 | 95 | 0.065 | 105 | 1 | YAde5 |
6 | -1 | +1 | +1 | +1 | 90 | 0.08 | 120 | 1.2 | YAde6 |
7 | -1 | -1 | +1 | -1 | 90 | 0.05 | 120 | 0.8 | YAde7 |
8 | 0 | 0 | 0 | 0 | 95 | 0.065 | 115 | 1 | YAde8 |
9 | 0 | 0 | 0 | 0 | 95 | 0.065 | 115 | 1 | YAde9 |
10 | -1 | -1 | -1 | +1 | 90 | 0.05 | 110 | 1.2 | YAde10 |
11 | +1 | +1 | -1 | -1 | 100 | 0.08 | 110 | 0.8 | YAde11 |
12 | 0 | 0 | 0 | 0 | 95 | 0.065 | 115 | 1 | YAde12 |
13 | 0 | + α | 0 | 0 | 95 | 0.095 | 115 | 1 | YAde13 |
14 | +1 | +1 | +1 | +1 | 100 | 0.08 | 120 | 1.2 | YAde14 |
15 | 0 | 0 | 0 | + α | 95 | 0.065 | 115 | 1.4 | YAde15 |
16 | -1 | +1 | -1 | +1 | 90 | 0.08 | 110 | 1.2 | YAde16 |
17 | +1 | +1 | +1 | -1 | 100 | 0.08 | 120 | 0.8 | YAde17 |
18 | -1 | +1 | +1 | -1 | 90 | 0.08 | 120 | 0.8 | YAde18 |
19 | 0 | 0 | 0 | - α | 95 | 0.065 | 115 | 0.6 | YAde19 |
20 | -1 | +1 | -1 | -1 | 90 | 0.08 | 110 | 0.8 | YAde20 |
21 | +1 | -1 | -1 | -1 | 100 | 0.05 | 110 | 0.8 | YAde21 |
22 | -1 | -1 | +1 | +1 | 90 | 0.05 | 120 | 1.2 | YAde22 |
23 | +1 | +1 | -1 | +1 | 100 | 0.08 | 110 | 1.2 | YAde23 |
24 | -1 | -1 | -1 | -1 | 90 | 0.05 | 110 | 0.8 | YAde24 |
25 | 0 | 0 | 0 | 0 | 95 | 0.065 | 115 | 1 | YAde25 |
26 | +1 | -1 | -1 | +1 | 100 | 0.05 | 110 | 1.2 | YAde26 |
27 | 0 | 0 | 0 | 0 | 95 | 0.065 | 115 | 1 | YAde27 |
28 | 0 | - α | 0 | 0 | 95 | 0.035 | 115 | 1 | YAde28 |
29 | 0 | 0 | 0 | 0 | 95 | 0.065 | 115 | 1 | YAde29 |
30 | +1 | -1 | +1 | +1 | 100 | 0.05 | 120 | 1.2 | YAde30 |
Coded values | Real values | Responses | |||||||
|---|---|---|---|---|---|---|---|---|---|
No | X1 | X2 | X3 | X4 | U1 | U2 | U3 | U4 | Y |
1 | 0 | 0 | 0 | 0 | 95 | 0.065 | 115 | 1 | YIde1 |
2 | 0 | 0 | 0 | 0 | 95 | 0.065 | 115 | 1 | YIde2 |
3 | +1 | -1 | +1 | -1 | 100 | 0.05 | 120 | 0.8 | YIde3 |
4 | 0 | + α | 0 | 0 | 95 | 0.095 | 115 | 1 | YIde4 |
5 | 0 | 0 | 0 | - α | 95 | 0.065 | 115 | 0.6 | YIde5 |
6 | + α | 0 | 0 | 0 | 105 | 0.065 | 115 | 1 | YIde6 |
7 | -1 | -1 | -1 | +1 | 90 | 0.05 | 110 | 1.2 | YIde7 |
8 | -1 | -1 | +1 | -1 | 90 | 0.05 | 120 | 0.8 | YIde8 |
9 | +1 | +1 | -1 | -1 | 100 | 0.08 | 110 | 0.8 | YIde9 |
10 | +1 | +1 | -1 | +1 | 100 | 0.08 | 110 | 1.2 | YIde10 |
11 | 0 | 0 | - α | 0 | 95 | 0.065 | 105 | 1 | YIde11 |
12 | 0 | 0 | 0 | + α | 95 | 0.065 | 115 | 1.4 | YIde12 |
13 | - α | 0 | 0 | 0 | 85 | 0.065 | 115 | 1 | YIde13 |
14 | 0 | 0 | 0 | 0 | 95 | 0.065 | 115 | 1 | YIde14 |
15 | -1 | -1 | -1 | -1 | 90 | 0.05 | 110 | 0.8 | YIde15 |
16 | -1 | +1 | +1 | +1 | 90 | 0.08 | 120 | 1.2 | YIde16 |
17 | -1 | +1 | -1 | -1 | 90 | 0.08 | 110 | 0.8 | YIde17 |
18 | -1 | +1 | -1 | +1 | 90 | 0.08 | 110 | 1.2 | YIde18 |
19 | 0 | 0 | 0 | 0 | 95 | 0.065 | 115 | 1 | YIde19 |
20 | -1 | +1 | +1 | -1 | 90 | 0.08 | 120 | 0.8 | YIde20 |
21 | +1 | +1 | +1 | -1 | 100 | 0.08 | 120 | 0.8 | YIde21 |
22 | -1 | -1 | +1 | +1 | 90 | 0.05 | 120 | 1.2 | YIde22 |
23 | 0 | - α | 0 | 0 | 95 | 0.035 | 115 | 1 | YIde23 |
24 | +1 | -1 | -1 | -1 | 100 | 0.05 | 110 | 0.8 | YIde24 |
25 | +1 | -1 | +1 | +1 | 100 | 0.05 | 120 | 1.2 | YIde25 |
26 | +1 | -1 | -1 | +1 | 100 | 0.05 | 110 | 1.2 | YIde26 |
27 | 0 | 0 | 0 | 0 | 95 | 0.065 | 115 | 1 | YIde27 |
28 | +1 | +1 | +1 | +1 | 100 | 0.08 | 120 | 1.2 | YIde28 |
29 | 0 | 0 | + α | 0 | 95 | 0.065 | 125 | 1 | YIde29 |
30 | 0 | 0 | 0 | 0 | 95 | 0.065 | 115 | 1 | YIde30 |
 with
with 
 with
with 
Experiment design with American decolourizing earth | ||||||
|---|---|---|---|---|---|---|
No | X1(°C) | X2(%H3PO4) | X3(°C) | X4(%Earth) | Y experimental | Y theoretical |
1 | 95 | 0.065 | 125 | 1 | 16.4 | 16.2542 |
2 | 85 | 0.065 | 115 | 1 | 16.3 | 16.1208 |
3 | 105 | 0.065 | 115 | 1 | 15.7 | 15.5375 |
4 | 100 | 0.05 | 120 | 0.8 | 16.3 | 16.3833 |
5 | 95 | 0.065 | 105 | 1 | 17 | 16.8042 |
6 | 90 | 0.08 | 120 | 1.2 | 15.8 | 15.9125 |
7 | 90 | 0.05 | 120 | 0.8 | 16.5 | 16.6625 |
8 | 95 | 0.065 | 115 | 1 | 17 | 16.8833 |
9 | 95 | 0.065 | 115 | 1 | 16.9 | 16.8833 |
10 | 90 | 0.05 | 110 | 1.2 | 16.8 | 16.9125 |
11 | 100 | 0.08 | 110 | 0.8 | 15.6 | 15.7333 |
12 | 95 | 0.065 | 115 | 1 | 17 | 16.8833 |
13 | 95 | 0.095 | 115 | 1 | 15.4 | 15.2042 |
14 | 100 | 0.08 | 120 | 1.2 | 15.8 | 15.8833 |
15 | 95 | 0.065 | 115 | 1.4 | 16.4 | 16.3042 |
16 | 90 | 0.08 | 110 | 1.2 | 15.7 | 15.75 |
17 | 100 | 0.08 | 120 | 0.8 | 15.8 | 15.8958 |
18 | 90 | 0.08 | 120 | 0.8 | 16 | 16.05 |
19 | 95 | 0.065 | 115 | 0.6 | 17.3 | 17.0542 |
20 | 90 | 0.08 | 110 | 0.8 | 16 | 16.1625 |
21 | 100 | 0.05 | 110 | 0.8 | 17 | 17.0958 |
22 | 90 | 0.05 | 120 | 1.2 | 16.2 | 16.2 |
23 | 100 | 0.08 | 110 | 1.2 | 15.4 | 15.4458 |
24 | 90 | 0.05 | 110 | 0.8 | 17.6 | 17.65 |
25 | 95 | 0.065 | 115 | 1 | 16.8 | 16.8833 |
26 | 100 | 0.05 | 110 | 1.2 | 16.4 | 16.4833 |
27 | 95 | 0.065 | 115 | 1 | 16.8 | 16.8833 |
28 | 95 | 0.035 | 115 | 1 | 17 | 16.8542 |
29 | 95 | 0.065 | 115 | 1 | 16.8 | 16.8833 |
30 | 100 | 0.05 | 120 | 1.2 | 16 | 16.0458 |
 +0.03125X1X2+0.06875X1X3+0.03125X1X4-0.213542
  +0.21875X2X3+0.08125X2X4-0.0885417
  +0.06875X3X4-0.0510417
  (1)
(1)  : 15.90% (quadratic term; introduction temperature of phosphoric acid), X2X3: 10.95% (% phosphoric acid/ introduction temperature of decolourizing earth),
  : 10.44% (quadratic term; % phosphoric acid), X4: 8.05% (% decolourizing earth), X1: 4.87% (introduction temperature of phosphoric acid), X3: 4.33% (introduction temperature of decolourizing earth). These five terms contribute 93.49% to the discolouration of palm oil during crude oil refining. The interactions
  , X1X2, X1X4 which have insignificant weights on the response (0.60%: 0.22%, 0.22% respectively) must be taken away from the model equation.
 Factors | Coefficient | Squared coefficient | % effect |
|---|---|---|---|
Constant | 16.8833 | ||
X1 | -0.145833 | 0.02126726 | 4.86837924 |
X2 | -0.4125 | 0.17015625 | 38.9511861 |
X3 | -0.1375 | 0.01890625 | 4.32790957 |
X4 | -0.1875 | 0.03515625 | 8.04776573 |
| -0.263542 | 0.06945439 | 15.8990969 |
X1X2 | 0.03125 | 0.00097656 | 0.22354905 |
X1X3 | 0.06875 | 0.00472656 | 1.08197739 |
X1X4 | 0.03125 | 0.00097656 | 0.22354905 |
| -0.213542 | 0.04560019 | 10.4385312 |
X2X3 | 0.21875 | 0.04785156 | 10.9539034 |
X2X4 | 0.08125 | 0.00660156 | 1.51119157 |
| -0.0885417 | 0.00783963 | 1.79460343 |
X3X4 | 0.06875 | 0.00472656 | 1.08197739 |
| -0.0510417 | 0.00260526 | 0.59637996 |
|
 +0.06875X1X3-0.213542
  +0.21875X2X3+0.08125X2X4-0.0885417
  +0.06875X3X4(2)
 Factors | X1 | X2 | X3 | X4 | Yoptimum |
|---|---|---|---|---|---|
Coded values | -0,56 | -1,99 | -2 | -1,99 | |
Real values | 92.2°C | 0.035% | 105°C | 0.6% | 18.5658 |
Validation elements | Obtained values | Standards values | Acceptable values |
|---|---|---|---|
R2 | 0.96 | 1 | ≥ 0.90 |
Ajusted R2 | 0.92 | 1 | ≥0.80 |
AADM | 0.00657329 | 0 | 0 – 0.3 |
Bf | 1.000025194 | 1 | 0.75 – 1.25 |
Af | 1.000025194 | 1 | 0.75 – 1.25 |
Experiment design with Indian decolourizing earth | ||||||
|---|---|---|---|---|---|---|
No | X1 (°C) | X2 (%H3PO4) | X3 (°C) | X4 (%Earth) | Y experimental | Y theoretical |
1 | 95 | 0.065 | 115 | 1 | 16.4 | 16.4 |
2 | 95 | 0.065 | 115 | 1 | 16.4 | 16.4 |
3 | 100 | 0.05 | 120 | 0.8 | 17 | 17.0917 |
4 | 95 | 0.095 | 115 | 1 | 16.2 | 16.2458 |
5 | 95 | 0.065 | 115 | 0.6 | 16 | 15.7792 |
6 | 105 | 0.065 | 115 | 1 | 17 | 16.7792 |
7 | 90 | 0.05 | 110 | 1.2 | 14.5 | 14.1625 |
8 | 90 | 0.05 | 120 | 0.8 | 15.2 | 15.2958 |
9 | 100 | 0.08 | 110 | 0.8 | 15.6 | 15.4917 |
10 | 100 | 0.08 | 110 | 1.2 | 15.9 | 15.7458 |
11 | 95 | 0.065 | 105 | 1 | 15.2 | 15.3458 |
12 | 95 | 0.065 | 115 | 1.4 | 15 | 15.0625 |
13 | 85 | 0.065 | 115 | 1 | 14.8 | 14.8625 |
14 | 95 | 0.065 | 115 | 1 | 16.4 | 16.4 |
15 | 90 | 0.05 | 110 | 0.8 | 15.3 | 15.3583 |
16 | 90 | 0.08 | 120 | 1.2 | 15.9 | 15.6625 |
17 | 90 | 0.08 | 110 | 0.8 | 16 | 15.9458 |
18 | 90 | 0.08 | 110 | 1.2 | 15.5 | 15.625 |
19 | 95 | 0.065 | 115 | 1 | 16.4 | 16.4 |
20 | 90 | 0.08 | 120 | 0.8 | 15.7 | 15.7583 |
21 | 100 | 0.08 | 120 | 0.8 | 15.4 | 15.6792 |
22 | 90 | 0.05 | 120 | 1.2 | 14 | 14.325 |
23 | 95 | 0.035 | 115 | 1 | 16.4 | 16.1958 |
24 | 100 | 0.05 | 110 | 0.8 | 16.6 | 16.7792 |
25 | 100 | 0.05 | 120 | 1.2 | 16.7 | 16.6958 |
26 | 100 | 0.05 | 110 | 1.2 | 16 | 16.1583 |
27 | 95 | 0.065 | 115 | 1 | 16.4 | 16.4 |
28 | 100 | 0.08 | 120 | 1.2 | 16 | 16.1583 |
29 | 95 | 0.065 | 125 | 1 | 16 | 15.6958 |
30 | 95 | 0.065 | 115 | 1 | 16.4 | 16.4 |
 -0.46875X1X2+0.09375X1X3+0.14375X1X4-0.0447917
  -0.03125X2X3+0.21875X2X4-0.219792
  +0.05625X3X4-0.244792
  (3)
(3)  : 8.54% (quadratic term; % decolourizing earth),
  : 6.88% (quadratic term; introduction temperature of decolourizing earth), X2X4: 6.82% (% phosphoric acid/% decolourizing earth). These five terms contribute 86.25% to the discolouration of palm oil during crude oil refining. The factor X2 (% phosphoric acid) and the interactions X3X4,
  , X2X3 which have insignificant weights on the response (0.02%, 0.45%, 0.29%, 0.14% respectively) must be removed from the model equation.
 Factors | Coefficient | Squared coefficient | % effect |
|---|---|---|---|
Constant | 16.4 | ||
X1 | 0.479167 | 0.22960101 | 32.7118756 |
X2 | 0.0125 | 0.00015625 | 0.02226136 |
X3 | 0.0875 | 0.00765625 | 1.09080658 |
X4 | -0.179167 | 0.03210081 | 4.57348952 |
| -0.144792 | 0.02096472 | 2.98690066 |
X1X2 | -0.46875 | 0.21972656 | 31.3050359 |
X1X3 | 0.09375 | 0.00878906 | 1.25220144 |
X1X4 | 0.14375 | 0.02066406 | 2.94406471 |
| -0.0447917 | 0.0020063 | 0.28584246 |
X2X3 | -0.03125 | 0.00097656 | 0.13913349 |
X2X4 | 0.21875 | 0.04785156 | 6.81754115 |
| -0.219792 | 0.04830852 | 6.88264559 |
X3X4 | 0.05625 | 0.00316406 | 0.45079252 |
| -0.244792 | 0.05992312 | 8.53740897 |
|
 -0.46875X1X2+0.09375X1X3+0.14375X1X4+0.21875X2X4-0.219792
  -0.244792
  (4)
(4) Factors | X1 | X2 | X3 | X4 | Yoptimum |
|---|---|---|---|---|---|
Coded values | +2 | -2 | +0.71 | -0.58 | |
Real values | 105°C | 0.035% | 118.5°C | 0.88% | 18.6643 |
Validation elements | Obtained values | Standard values | Acceptable values |
|---|---|---|---|
R2 | 0.95 | 1 | ≥ 0.90 |
ajusted R2 | 0.90 | 1 | ≥0.80 |
AADM | 0.00789217 | 0 | 0 – 0.3 |
Bf | 1.0000546 | 1 | 0.75 – 1.25 |
Af | 1.0000546 | 1 | 0.75 – 1.25 |
CPO | Crude Palm Oil |
BPO | Bleached Palm Oil |
DOBI | Deterioration of Bleachability Index |
DOBI 1.3 | Deterioration of Bleachability Index 1.3 |
DOBI 2.3 | Deterioration of Bleachability Index 2.3 |
RBD | Refined Bleached Deodorized Oil |
YAde | American Decolourizing Earth Response |
YIde | Indian Decolourizing Earth Response |
R2 | Correlation Coefficient |
AAMD | Absolute Mean Deviation Analysis |
Bf | Bias Factor |
Af | Accuracy Factor |
| [1] | Amiri, A. Synthèse et caractérisation de la bentonite imprégnée par le vanadium. Mémoire de Master, Université des Sciences et de la Technologie Houari Boumediene, 2011. |
| [2] | Baș D., Boyaci, I. H. Modeling and optimization I: Usability of response surface methodology. Journal of Food Engineering. 2007, 78, 836-845. |
| [3] | Brou, S. A. Influence des facteurs d’exposition domestique sur la stabilité des huiles végétales comestibles: cas de l’huile de palme en Côte d’Ivoire. Mémoire de Master en développement, Université Senghor, 2021. |
| [4] | De Almeida, E. S., da Silva Damaceno, D., Carvalho, L., Victor, P. A., dos Passos, R. M., de Almeida Pontes, P. V., Cunha-Filho, M., Sampaio, K. A., Monteiro, S. Thermal and Physical Properties of Crude Palm Oil with Higher Oleic Content. Applied Sciences. 2021, 11, 7094. 7094. |
| [5] | Djohan, Y. F. Influence d’un régime riche en huile de palme sur le statut antioxydant, la fonction mitochondriale et les désordres métaboliques associées à l’obésité. Thèse de Doctorat en biologie santé, Université de Montpellier, 2017. |
| [6] | Dufour M. Regard d’expert sur l’huile de palme-Etudes. Mirova, Paris, 2014, 17p. |
| [7] | Ejikeme Ebere, M., Egbuna, S. O., Ejikeme, P. C. N. Optimal Bleaching Performance of Acid Activated ‘Ngwulangwu’ Clay. International Journal of Engineering and Innovative Technology. 2013, 3(5), 13-19. |
| [8] | Hasibuan, H. A. Deterioration of bleachability index of crude palm oil: review material and recommendation for SNI 01-2901-2006. Bahan review. 2016, 25-34. |
| [9] |
Investir au Cameroun, Huile de palme: quatre nouvelles raffineries annoncées au Cameroun, dans une filière en panne de matière première. Available from:
https://www.investiraucameroun.com/agriculture/ [Accessed 27 march 2024]. |
| [10] | ISO 17932 Norme internationale. Huile de palme — Détermination de la détérioration de l’indice de blanchiment (DOBI) et de la teneur en carotène. Deuxième édition, Génève, 2011, 9p. |
| [11] | Lecerf, J. M. L’huile de palme: aspects nutritionnels et métaboliques. Rôle sur le risque cardiovasculaire. Oilseeds and fats, Crops and Lipids. 2013, 20(3), 147-159. |
| [12] | Mancini, A., Imperlini, E., Nigro, E., Montagnese, C., Daniele, A., Orrù, S., Buono, P. Biological and Nutritional Properties of Palm Oil and Palmitic Acid: Effects on Health. Molecules. 2015, 20, 17339-17361. |
| [13] | Mba, O. I., Dumont, M. J., Ngadi, M. Palm oil: Processing, characterization and utilization in the food industry-A review. Food Biosciences. 2015, 10, 26-41. |
| [14] | Nkouam G. B., Didja, P., Tchankou Leudeu, C. B., Tchatchueng, J. B., Kapseu C., Barth D. Optimisation of decolourizing earth and temperature use in the decolourisation of palm oil, International Journal of Agriculture Innovations and Research. 2017, 6(2), 268-274. |
| [15] | Nwabanne, J. T., Ekwu, F. C. Experimental Design Methodology applied to Bleaching of Palm Oil Using Local Clay. International Journal of Applies Sciences and Technology. 2013, 3(4), 69-77. |
| [16] | Rébéna, A., Rafflegeau, S., Kansci, G., Nanda, D., Genot, C. Enquêtes sur la consommation, la perception et les utilisations de l’huile de palme rouge chez les ménagères et restauratrices de Yaoundé, Cameroun. Cahiers Agricultures. 2019, 28(27), 1-7. |
| [17] | Renard, C. M. G. C., Caris-Veyrat, C., Dufour, C., Le Bourvellec, C. Le devenir des polyphénols et caroténoïdes dans les fruits et légumes traités thermiquement. Innovations Agronomiques. 2014, 42, 125-137. |
| [18] | Wafa, J. Décoloration des huiles végétales sur des argiles: étude de la stabilité physicochimique des huiles décolorées. Mémoire en vue de l’obtention Diplôme d’Etudes Approfondies en chimie organique, Université de SFAX, 2002. |
APA Style
Didja, P., Nkouam, G. B., Balike, M., Tchatchueng, J. B., Missang, C. E., et al. (2025). Optimization of Raw Material, Decolourizing Earth and Temperature Use in the Decolourization of Palm Oil. American Journal of Chemical Engineering, 13(1), 20-35. https://doi.org/10.11648/j.ajche.20251301.13
ACS Style
Didja, P.; Nkouam, G. B.; Balike, M.; Tchatchueng, J. B.; Missang, C. E., et al. Optimization of Raw Material, Decolourizing Earth and Temperature Use in the Decolourization of Palm Oil. Am. J. Chem. Eng. 2025, 13(1), 20-35. doi: 10.11648/j.ajche.20251301.13
@article{10.11648/j.ajche.20251301.13,
  author = {Pascaline Didja and Gilles Bernard Nkouam and Musongo Balike and Jean Bosco Tchatchueng and Crépin Ella Missang and César Kapseu and Danielle Barth},
  title = {Optimization of Raw Material, Decolourizing Earth and Temperature Use in the Decolourization of Palm Oil
},
  journal = {American Journal of Chemical Engineering},
  volume = {13},
  number = {1},
  pages = {20-35},
  doi = {10.11648/j.ajche.20251301.13},
  url = {https://doi.org/10.11648/j.ajche.20251301.13},
  eprint = {https://article.sciencepublishinggroup.com/pdf/10.11648.j.ajche.20251301.13},
  abstract = {The objective of this study was to evaluate the influence of raw material, decolourizing earth and temperature on the colour of bleached palm oil. Two types of decolourizing earth (American and Indian) were used. A four-factor centered composite response surface design was used to determine the effects of the different mentioned factors on the colour response of bleached palm oil at two DOBIs (2.3 and 1.3). The results obtained indicate that Indian earth with DOBI 2.3 oil has the colour variation contour lines at the high level of 16.0 red and at low level of 15.3 red. The decrease in colour around 15.4 is influenced by the effect of opposite temperature levels. The increase in color depends on the bleaching earth used. The temperature influences the colour of the bleached oil depending on the raw material. The bleaching temperature with American earth and a DOBI 1.3 oil, when it is at its high level (120°C) and at its low level (110°C), gives a colour of 15.8 red and 17.6 red, respectively. The optimal discoloration conditions (18.57 red) of CPO palm oil (P ≤ 0.05) are for American earth (with DOBI 1.3 oil): 92°C and 0.035% for temperature and percentage of phosphoric acid; 105°C and 0.6% for temperature and percentage of decolourizing earth. For Indian earth (with DOBI 2.3 oil), we have the optimum (18.66 red): 105°C and 0.035% for temperature and percentage of phosphoric acid; 118.5°C and 0.88% for temperature and percentage of decolourizing earth.
},
 year = {2025}
}
TY  - JOUR
T1  - Optimization of Raw Material, Decolourizing Earth and Temperature Use in the Decolourization of Palm Oil

AU  - Pascaline Didja
AU  - Gilles Bernard Nkouam
AU  - Musongo Balike
AU  - Jean Bosco Tchatchueng
AU  - Crépin Ella Missang
AU  - César Kapseu
AU  - Danielle Barth
Y1  - 2025/02/10
PY  - 2025
N1  - https://doi.org/10.11648/j.ajche.20251301.13
DO  - 10.11648/j.ajche.20251301.13
T2  - American Journal of Chemical Engineering
JF  - American Journal of Chemical Engineering
JO  - American Journal of Chemical Engineering
SP  - 20
EP  - 35
PB  - Science Publishing Group
SN  - 2330-8613
UR  - https://doi.org/10.11648/j.ajche.20251301.13
AB  - The objective of this study was to evaluate the influence of raw material, decolourizing earth and temperature on the colour of bleached palm oil. Two types of decolourizing earth (American and Indian) were used. A four-factor centered composite response surface design was used to determine the effects of the different mentioned factors on the colour response of bleached palm oil at two DOBIs (2.3 and 1.3). The results obtained indicate that Indian earth with DOBI 2.3 oil has the colour variation contour lines at the high level of 16.0 red and at low level of 15.3 red. The decrease in colour around 15.4 is influenced by the effect of opposite temperature levels. The increase in color depends on the bleaching earth used. The temperature influences the colour of the bleached oil depending on the raw material. The bleaching temperature with American earth and a DOBI 1.3 oil, when it is at its high level (120°C) and at its low level (110°C), gives a colour of 15.8 red and 17.6 red, respectively. The optimal discoloration conditions (18.57 red) of CPO palm oil (P ≤ 0.05) are for American earth (with DOBI 1.3 oil): 92°C and 0.035% for temperature and percentage of phosphoric acid; 105°C and 0.6% for temperature and percentage of decolourizing earth. For Indian earth (with DOBI 2.3 oil), we have the optimum (18.66 red): 105°C and 0.035% for temperature and percentage of phosphoric acid; 118.5°C and 0.88% for temperature and percentage of decolourizing earth.

VL  - 13
IS  - 1
ER  -
Department of Chemical Engineering, School of Chemical Engineering and Mineral Industries, University of Ngaoundere, Ngaoundere, Cameroon
Department of Chemical Engineering, School of Chemical Engineering and Mineral Industries, University of Ngaoundere, Ngaoundere, Cameroon
Department of Chemical Engineering, School of Chemical Engineering and Mineral Industries, University of Ngaoundere, Ngaoundere, Cameroon
Department of Applied Chemistry, National Advanced School of Agro-Industrial Sciences, University of Ngaoundere, Ngaoundere, Cameroon
Institut National Supérieur d’Agronomie et de Biotechnologies, Université des Sciences et Techniques de Masuku, Franceville, Gabon, Central Africa
Department of Process Engineering, National Advanced School of Agro-Industrial Industries, The University of Ngaoundere, Ngaoundere, Cameroon
Laboratoire Réactions et Génie des Procédés UMR CNRS 7274, Ecole Nationale Supérieure des Industries Chimiques, Université de Lorraine, 1, rue Grandville Nancy, France
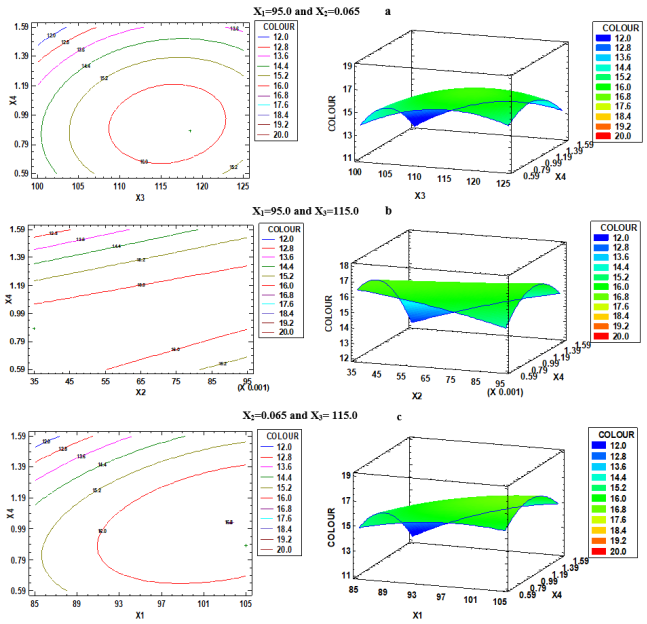
Figure 1. Iso-response and surface response 3-D curves of colour variation with Indian earth and a DOBI 2.3 raw material.
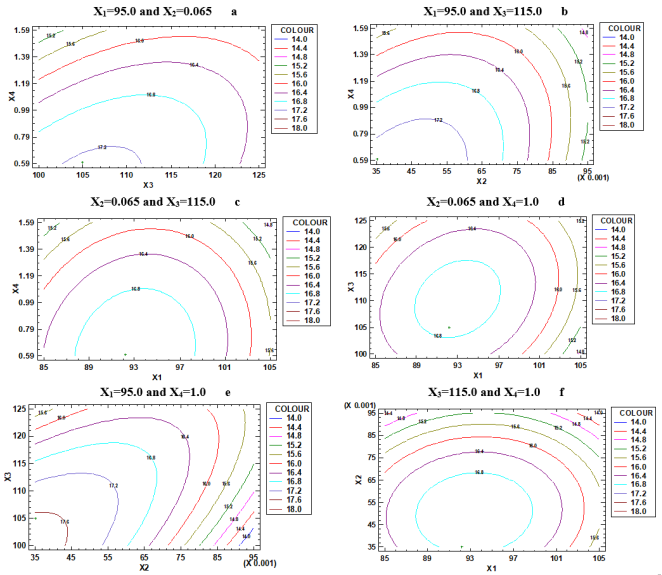
Figure 2. Iso-response curves of colour variation with American earth and a DOBI 1.3 raw material.
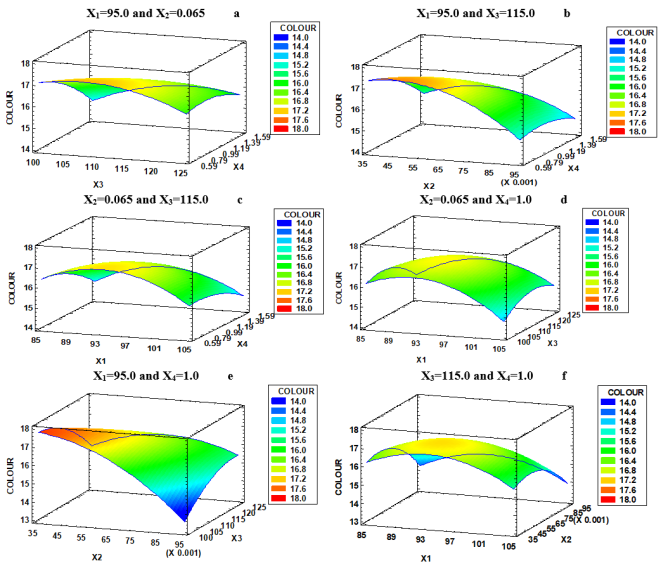
Figure 3. Surface response 3-D curves of colour variation with American earth and a DOBI 1.3 raw material.
Information


 =0.43684485


 = 0.70188887