Research Article | | Peer-Reviewed

Mapping the Field of Quantum Dots Literature: Bibliographic Coupling and Cited Reference

Received: 25 November 2024     Accepted: 12 December 2024     Published: 31 December 2024
Views:       Downloads:
Abstract

The science of quantum dots has evolved rapidly in recent years. A quantitative and comprehensive examination of the research domain is required to identify research trends and directions in the field. This work, a systematic review of 4176 scientific articles published in the Web of Science database between 2014 and 2023, results from collaborative efforts. The results, based on two citation analysis methods- bibliographic coupling and cited reference method- identify some of the most active and influential documents, authors, countries, cited references, and keywords in the field. The study reveals rankings, collaboration networks, and clusters of contributions to the literature. The study found that the most bibliographic coupling documents were Lim, 2015, and the countries with the most publications and collaborations have been China and the USA. Specifically, the fourth cluster of authors is linked with each cluster, and the most frequently cited reference is Murray CB, 1993, Journal of the American Chemical Society VII5, P8706. Quantum dots stand out prominently, ranking second in occurrences with 1864 mentions and relative influence. This research is a testament to the collaborative nature of scientific inquiry in understanding the current state and future directions of quantum dots research.

Published in American Journal of Information Science and Technology (Volume 8, Issue 3)
DOI 10.11648/j.ajist.20240804.11
Page(s) 98-110
Creative Commons

This is an Open Access article, distributed under the terms of the Creative Commons Attribution 4.0 International License (http://creativecommons.org/licenses/by/4.0/), which permits unrestricted use, distribution and reproduction in any medium or format, provided the original work is properly cited.

Copyright

Copyright © The Author(s), 2024. Published by Science Publishing Group

Keywords

Quantum Dots, Bibliometrics, Bibliographic Coupling, Cited Reference, Social Network Analysis, and VOSviewer

1. Introduction
Quantum dots, a subject of intense interdisciplinary research in the 21st century, offer unique advantages over traditional fluorescent dyes. The term ‘quantum dots’ (QDs) was first introduced in a glass matrix in 1981 . In 1985, Brus at Bell Labs discovered QDs in colloidal materials . Reed et al. (1988) coined the term “quantum dot” to describe zero-dimensional nanosemiconductor materials. This technology enables engineers to create numerous nanometer-sized building blocks for faster, smaller computer circuits or more efficient light-emitting devices. Recent advances in quantum dots (QDs) have shown that these nanometer-sized semiconductor particles can be covalently linked with biorecognition molecules such as peptides, antibodies, nucleic acids, or small-molecule ligands for use as biological labels. Bailey, Smith and Nie (2004) discussed recent advances in quantum dots (QDs), noting that these nanometer-sized semiconductor particles can be covalently linked with biorecognition molecules such as peptides, antibodies, nucleic acids, or small-molecule ligands for use as biological labels. Furthermore, QDs are the composition and dimension of the nanostructure of emission light Colloidal luminescent semiconductor nanocrystals, also known as quantum dots (QDs), have received a lot of attention in recent decades because of their unique advantages over traditional fluorescent dyes, such as size-tunable emission, broad photoexcitation combined with narrow photoemission, strong fluorescence, and high photobleaching resistance . In addition, QDs are being used to detect physical variables, notably radiation, electromagnetic quantities, temperature, and chemical compounds . QDs are well-known for their wide excitation range and ability to emit small, symmetrical peaks 8].
Recently, QDs have been used as effective tracers for cancer diagnosis and therapy as well as QDs are widely used to develop various biosensors due to their excellent optical properties, photostability, favourable biocompatibility and promise for many biological applications . Moreover, QDs can be used for brain-targeted drug delivery and to visualize brain structures and mechanisms . Researchers have recently focused on exploring QDs toxicity, toxic mechanisms, and biosafety in clinical applications. Many studies have found that QDs can cause DNA damage, elevated reactive oxygen species (ROS) levels, and decreased cell viability 13]. Also, recent literature reveals that quantum effect particles smaller than 100 nm exhibit atom-like behaviour . In addition, Coccia (2022) examined the technological trajectory of growth in quantum computing to design a quantum ecosystem for industrial change. Jiang and Chen (2021) found that quantum technologies bring transformative changes to our society and ecosystem, synergizing social, scientific, and technological activities. Quantum computation has become an eye-catching subfield in recent years due to its high and intensive knowledge engagements. However, few researchers have systematically analyzed the evolution of scientific output in this domain.
In addition to many scientometric and bibliometric publications and extensive quantum dots research, universities, institutions, scientists, and countries define science policies by analyzing scientific research to address global innovation needs. Hence, developing an outlook for the future quantum market, policies, and semiconductor industries involves identifying key research areas in the field of quantum dots. Gupta, et al. (2021) studied quantum dots research in India from 2000 to 2019 and observed significant growth. India published 4,946 publications, with an average of 247.3 publications per year. India registered a 22.46% growth compared to 8.86% worldwide. China and the USA hold the first and second positions globally, with 23.46% and 22.13% growth, respectively, securing India in the third position. Wei et al. (2022) conducted a critical study using bibliometric analysis of the Science Citation Index Expanded database from 2000 to 2021. Over the past two decades, there have been 1,557 publications in the field of quantum dots-sensitized solar cells (QDSSCs). The study found that the top journal for these publications was Electrochemical Acta, which accounted for 6.48% of the total publications. The most scientifically productive nations were China (47.4%), South Korea (12.3%), and India (9%), respectively. Zhong et al. (2021) found that China had the highest number of publications (2,233) and an H-index of 119. The USA secured the second position in terms of quality of the research. The first position was in Liu Y 106 publications and Hardman R co-citations (304).
Further studies by Wang, Shen and Zhou (2021) conducted a bibliometric analysis of quantum computing from 2016 to 2020. The study found that the United States and China had the highest scholarly output, with 7,272 and 6,272 publications, respectively. The most cited authors were Jianwei Pan of the University of Science and Technology of China, with 3,293 documents, and Mikhail D. Lukin of Harvard University, with 3,293 cited documents. Gupta et al. 2021) found that China and the USA are at the forefront of global Quantum Communication & Networking (QCN) research, contributing 37.82% and 17.92% of the world's share, respectively. The leading organizations in the collaborative network include Österreichische Academic der Wissenschaften in Austria (97), the University of Vienna, Austria (85), and the University of Science and Technology of China (71).
In some studies on innovations, Gupta et al. (2022) found that India contributed 2,108 publications to quantum optics research, constituting 3.13% of the world's share and 30% of publications with funding support. The Indian Institute of Science, Bangalore (96 publications), and the University of Calcutta (80 publications) secured the first and second positions, respectively. Gupta et al. (2021) examined quantum cryptography research output from 1992 to 2019. The study found an annual average growth rate of 24.76% and an average of 23.01 citations per paper (CPP). The researchers also identified that China leads the global ranking of top countries with a 27.65% share, followed by the USA with a 17.92% share. In quantum machine learning, Dhawan (2021) explored integrating quantum technology into other domains. Scheidsteger et al. (2021) conducted a citation analysis on quantum dots literature Rajendran and Jeyshankar (2022) . They used similar approaches for knowledge domain visualization and social network analysis. These studies were particularly important for the research output of the Web of Science database between 2000 and May 2011, as noted by Ding et al. (2001) .
2. Literature Review
"Bibliometric" is described as "the application of statistical and mathematical methods to books and other means of communication . According to Ferreira , bibliometrics is "the quantitative study of physical published units, bibliographic units, or surrogates for either". In addition, Bibliometrics involves organizing and linking fundamental information from publications, including citations, authors, co-authors, journals, and keywords, to analyze and track research development , and bibliometric analysis uses many methodologies, such as bibliographic coupling, and co-citation network analysis, and co-occurrences analysis . Specifically, bibliometrics is one of the most accurate interdisciplinary research fields to extend to all scientific fields , and the bibliometric examination has been utilized in different exploration fields of development . It is used to address and understand the intricacies of scientific areas using bibliometric tools and approaches. However, bibliographic coupling linkages are similar approaches employed in frameworks of science mapping, and for bibliographic coupling, documents are coupled based on the number of references they share . It is considered that the two typical methodologies used together are bibliographic coupling analysis and co-citation analysis . In other words, bibliographic coupling happens when two documents include a third term as a reference . The ever-growing use of bibliographic coupling has been studied in the literature for analysis in multiple research relevant to the different disciplines of science, such as the following: SMART City and Economy ; Using big data for co-innovation processes ; Nephrology publications of bibliographic coupling and co-authorship networks . Bibliographic coupling methods now assess the similarities between two articles by counting their number of references. Articles that mention similar sources are likely to have conceptual overlap, and the more references two articles share, the stronger their relationship in a bibliographic network .
3. Objectives of the Study
1) To determine the trendline of the quantum dots research output and citations;
2) To explore the bibliographical coupling documents in the quantum dots literature;
3) To determine the country's collaboration.
4) To determine cited reference analysis.
5) To identify the most significant of keywords and author keywords;
4. Methodology
This work aims to map and analyze the current usage of the phrase "quantum dots literature" and its bibliographic coupling and cited references on the Web of Science Core Collection. A bibliographic coupling study on the related topic of quantum dots was not discovered. This study used scoping review methodologies to examine the literature's current state of quantum dots. Bibliometric mapping research approach by Svobodová & Bednarska-Olejniczak, (2020) and visualizing bibliometric networks by van Eck & Waltman, (2014) were adopted in this review-based article.
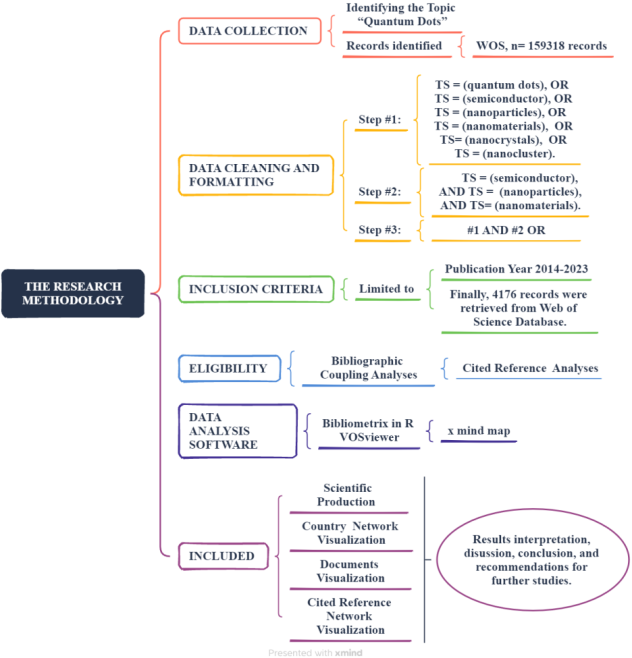
Figure 1. Flow Diagram shows the Research Design and Methodology.
5. Results
Figure 2 represents the trendline of the quantum dots research output 2014-2023. The number of papers published each year has generally decreased from 485 in 2014 to 249 in 2023, and the total citation count has also decreased over the years, from 25094 in 2014 to just 473 in 2023. Furthermore, it is observed that the average citations per paper have seen a significant decline from 51.74 in 2014 to 1.90 in 2023, indicating that fewer papers are being published, and each paper is receiving fewer citations on average. However, it is increasingly recognized that 2018 (519) publications, both the citation count (25094) and ACPP (51.74%) 2014 finally, although the trendline would likely show a downward trend over the years in terms of the number of published papers, citation counts, and ACPP
Average Citation per Paper (ACPP)

Download: Download full-size image

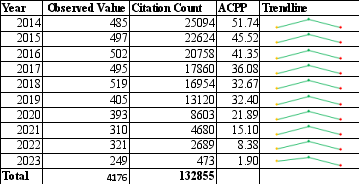
Figure 2. Trendline of the Quantum Dots Research Output and Citations.
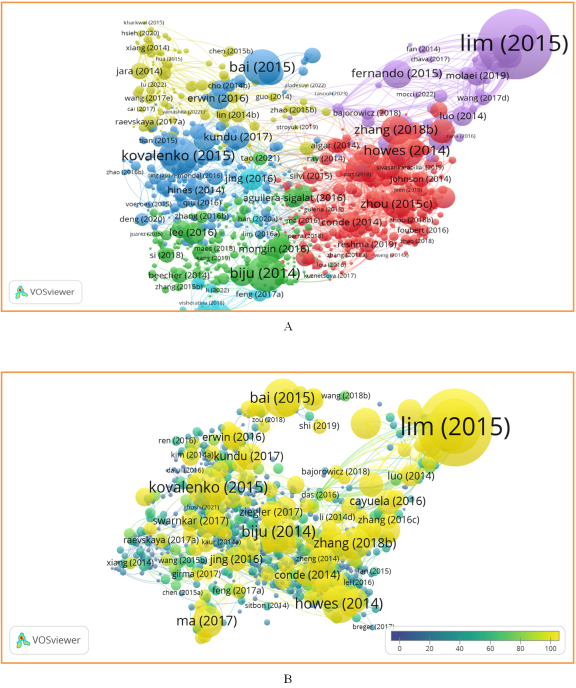
Figure 3. (A) Network Visualization Avg. Publication Documents; (B) Overlay Visualization Citation Documents.
Figure 3 (A and B) shows the bibliographic coupling for the authors that cite the same document based on citation weight. The different coloured circles are co-linked with the same coloured links, and the size of the circle represents the citation score of the document network and overlay visualization. The minimum number selected is 5 citations for documents. Of the 4174 docu ments, 3245 meet the threshold, item 1000, clusters 6, links 218070, and total link strength 467692. It is found that Lim (2015) secured the highest cited document entitled: Carbon Quantum Dots (CQDs) and their Applications, from Chemical Society Reviews 44 (1) 362–381, year 2015. Moreover, the (A) purple and (B) yellow colour cluster is the most cited document (link 206, total TLS 1561, citations 3372, norm. Citations 74.08).
Table 1. Bibliographic Coupling Country.

S No

Country

Documents

Citations

CPP

PEI

total link strength

1

China

1329

51812

38.9857

1.06889

46662.79

2

USA

714

31519

44.1443

1.21033

38269.27

3

India

556

13395

24.0917

0.66054

25427.26

4

Germany

270

7919

29.3296

0.80415

14048.97

5

Russia

222

3507

15.7973

0.43312

8145.48

6

South Korea

215

7604

35.3674

0.96969

11495.55

7

Japan

170

4627

27.2176

0.74624

7718.22

8

France

157

6418

40.879

1.1208

10654.75

9

Canada

148

6602

44.6081

1.22305

11433.19

10

Spain

123

7753

63.0325

1.7282

7964.73

Citation Per Paper (CPP); Publication Efficiency Index (PEI)
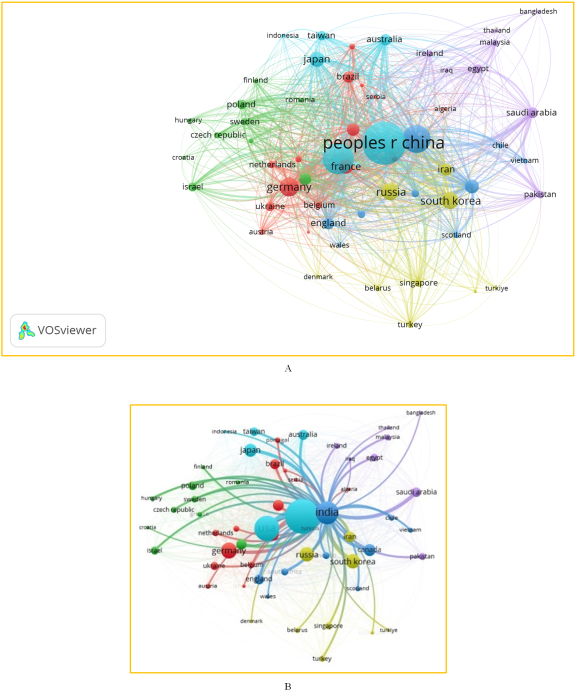
Figure 4. (A) Bibliographic Coupling Countries; (B) Bibliographic Coupling India.
A country must have a minimum of five papers and citations; 58 of the 95 countries meet this requirement. The strength of each country's bibliographic coupling ties with other countries will be calculated. Table 1 and Figure 4 present the highest number of articles written and countries' collaboration in China and the USA's first and second positions. While the highest CPP and PEI in the USA, Canada, and Spain impactful research. However, Spain has the lowest number of publications; it has the highest CPP and PEI, indicating highly efficient and impactful research, followed by India, Germany, and Russia, with the lowest CPP and PEI, suggesting potential areas for improving research impact and efficiency. Moreover, different colours indicate different clusters and the size of the circles shows the counts of documents and citations as well as the distance between the two circles, which means their correlation.
Figure 4 (B) represents the bibliometric analysis of India's country collaboration map. There are 53 countries that collaborate with India, and the total link strength is 25427.26. Different colours indicate different clusters, and the size of circles indicates the number of documents and citations. Moreover, the thickness of the lines represents the link strength of India's collaborators with other countries.
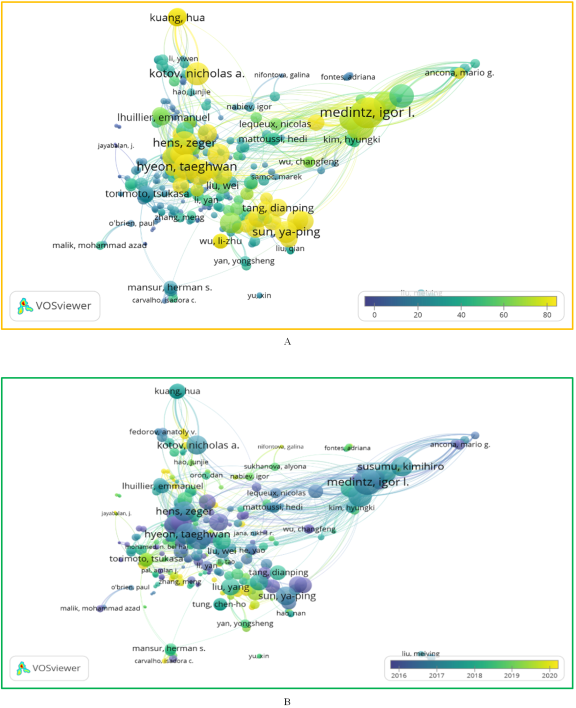
Figure 5. (A) Overlay Visualization Map of the Author Citations; (B) Overlay Visualization Map of the Author Publications.
Figure 5 (A and B) shows the author's overlay visualization mapping of bibliographic coupling in quantum dots research. A total of 17565 writers published research articles, with a minimum number of selected documents and citations per author of 5. The fractional counting approach was chosen; only 324 authors fit the criteria. However, there were 71512.51 overall link strengths and 18 clusters totaling 44975 linkages. As can be seen, there is a significant cluster of authors with high indices of bibliographic connection. There was a group of primary writers with high bibliographic coupling indices: Figure 5 (A) citation authors (yellow cluster), Figure 5 (B) citation authors' average publications (blue-green and purple clusters). Specifically, the fourth cluster of authors linked with each cluster is Medintz, Igor I, Susumu Kimihiro, Algar W. Russ, and Kim Hyungki. The remaining clusters have seven to two authors; in addition, some authors represented each cluster as Rosei Federico, Krull, Ulrich J. (cluster 1), Rogach Andrey i, Torimoto, Tuskasa (cluster 2), Koto, Nicholas A, and Kuang Hua (cluster 3) .
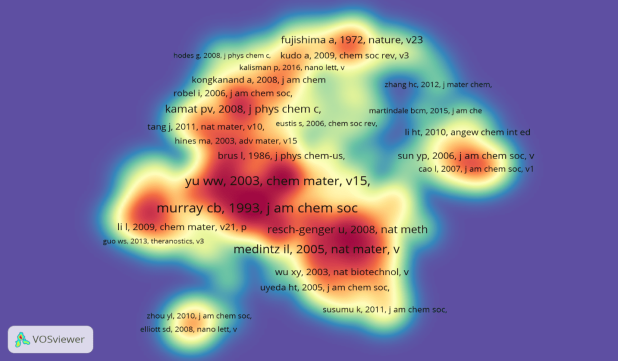
Figure 6. Density Visualization of Co-citation: Cited Reference.
Figure 6 illustrates the density map of the cited reference in the quantum dots literature. The relationships between the cited references were examined using co-citation analysis. The minimum number of citations for cited references is set at twenty. A total of 156096 citation references were generated, 822 cited references were meet the threshold, and there were 7 clusters, 119670 links, and 15934.22 total link strengths. Table 1 clearly shows Murray CB, 1993, Journal of the American Chemical Society VII5, P8706 appeared as the highest link strength (364), citations (366). Followed by Bruchez M., 1998, Science, V281, P2013, citations 340, total link strength 340, and Yu Ww, 2003, Chemistry of Materials, V15, P2854, citations 304, 297 total link strength. Especially most co-citations cited reference sources in science journals .
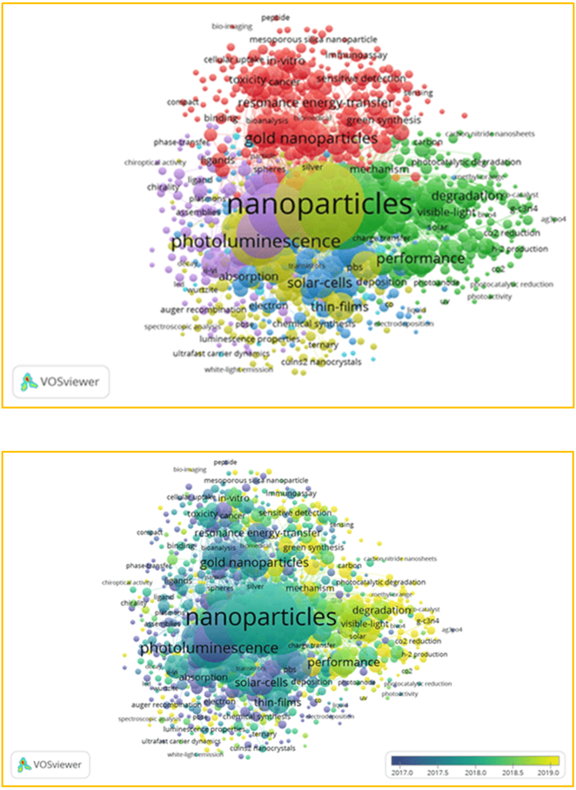
Figure 7. Main areas of Quantum Dots Research (co-occurrence network of keywords).
Figure 7 illustrate the relationship of keyword co-occurrence among different keywords using VOSviewer. The total number of keywords identified in 1331 to 2007. The overall strength of co-occurrence linkages between the 1331 keywords will be determined as well as the maximum total link strength (TLS) will be selected with 1000 keywords, which have a frequency minimum number of occurrences of keywords 5, as well as total links 57191, total link strength 131822. The 2007 keywords of data analytics research were divided into 7 clusters. The utmost five clusters: the first cluster red colour links 560, TLS 2381, occurrence 264 and 270 items, (keywords: fluorescence, semiconductor quantum dots, gold nanoparticles) second cluster green colour links 982, TLS 13910, occurrence 1864 items 214 (keywords: quantum dots, semiconductor nanocrystal, water, photocatalysis), third cluster blue colour links 534, TLS 1848, occurrence 224, items 173, and fourth cluster yellow colour links 981, TLS 14986, occurrence 1990, item 164 (keyword nanoparticles, semiconductor, stability, optical properties, thin-films), fifth cluster purple colour links 858, TLS 6140, occurrence 808, items 141 (keywords: nanocrystal, semiconductor nanocrystals, emission, energy transfer, growth, nanoclusters) .
Table 2. Relative Influence of Quantum Dots Keywords.

Keyword

Occurrences

Relative Influence

Total Link Strength

Betweenness

Closeness

PageRank

Nanoparticles

1990

1

14986

108.25

0.02

0.12

Quantum dots

1864

2

13910

43.99

0.02

0.09

Nanocrystals

808

3

6140

13.17

0.02

0.05

Semiconductor nanocrystals

655

4

4922

9.40

0.02

0.04

Photoluminescence

579

5

4738

4.50

0.02

0.04

Optical-properties

426

6

3295

3.79

0.02

0.03

Semiconductor

415

7

3384

2.73

0.02

0.03

Gold nanoparticles

337

8

2381

3.37

0.02

0.02

Luminescence

299

9

2479

1.08

0.02

0.02

Size

295

10

2298

1.47

0.02

0.02

Growth

278

11

2120

1.16

0.02

0.02

Fluorescence

275

12

2281

1.27

0.02

0.02

Semiconductor quantum dots

264

13

1855

1.49

0.02

0.02

Performance

258

14

2096

1.72

0.02

0.02

Cdse

248

15

2025

0.15

0.02

0.02

Table 2 illustrates that nanoparticles emerge as the most frequently mentioned keyword, underscoring their significant presence within the analyzed context, with 1990 occurrences. Their significant relative influence and network structure further strengthen their significance. Moreover, nanoparticles exhibit the highest total link strength of 14986, indicating robust connections. Their centrality suggests that nanoparticles lie on many shortest paths between other keywords. Quantum dots also stand out prominently, ranking second in occurrences with 1864 mentions and relative influence. They have strong links with other terms, as seen by their high total link strength of 13910. Their centrality underscores their role in bridging different parts of the network. Nanocrystals, ranking third in relative influence, exhibit a moderate total link strength of 6140 and betweenness centrality. This indicates their importance within the network, albeit not as central as nanoparticles or quantum dots. However, their closeness centrality and PageRank fall within a similar range among the top 15 keywords, suggesting their central position despite potentially lesser direct connections or authority compared to others. .
6. Discussions
The article mainly aims to visualize quantum dots in the literature. Bibliographic coupling and cited reference analysis were conducted using VOSviewer and the Bibiometrix package of R to achieve the same. In the context of Bibliographic coupling, and co-citation cited reference total linked strength of documents, countries, authors, and co-citation cited reference, co-occurrence is analyzed as well as these methods were conducted on 4174 documents retrieved from the Web of Science database using Boolean searching methods.
The present study identified that the number of papers published each year has generally decreased from 485 in 2014 to 249 in 2023, and the total citation count has also decreased over the years, from 25094 in 2014 to just 473 in 2023. It is increasingly recognized that 2018 (519) publications, both the citation count (25094) and ACPP (51.74%) 2014. The study further indicated that Quantum Optics' global output is 67,274 publications, which increased from 718 publications in 1996 to 3073 in 2021 annual average growth.
Our analyses focused exclusively on the quantum dots literature in the bibliographic coupling analysis leads to identifying leading documents; Lim, 2015 secured the highest cited document entitled: Carbon Quantum Dots (CQDs) and their Applications, from Chemical Society Reviews 44 (1) 362–381, the year 2015. They further emphasized that methodologically deviate from the conventional approach, such as quantum probability theory . Guleria & Kaur. (2021) investigated the bibliometric analysis of ecopreneurship using VOSviewer and R Studio bibliometric, 1989-2019 and the unit analysis of bibliographic coupling for the authors that cited documents. The study found that the topmost circle, the citation score Dream (2007) in orange colour, is coupled to Cohen (2007), Meek (2010), etc., while Schaltegger (2011) in blue colour is linked to Santini (2017), Cral (2005).
The current study's primary collaborator countries and papers were China and the United States, followed by India, Germany, and Russia. Secured the first and second - position citations for China and the USA. Additionally, the number of collaborators with India is 53 countries, and the highest country total link strength is 25427.26. Yu et al., 2020 focused on identifying recent research on COVID-19 global literature 2019–2020, which was retrieved from the WOS database. The researcher identified 44 collaborators with China; the total connection strength is 487, including 838 publications. China's key partners are the United States, England, and Germany. Furthermore, in the study identified, Gupta et al. (2021) conducted a bibliometric assessment of quantum dots research in India. The study found that China received the most citations (61,790) and the highest H-index (119). The United States placed second in both citation frequency (48,664) and H-index (112) .
The study highlights the leading authors in bibliographic coupling. It was found that Figure 6 (A) citation authors (yellow cluster), Figure 6 (B) citation authors' average publications (blue-green and purple clusters). Specifically, the fourth cluster of authors linked with each cluster is Medintz, Igor I, Susumu Kimihiro, Algar W. Russ, and Kim Hyungki. Previous research (28) found that Khare A is ranked first, receiving 8463 total link strength, followed by Gupta S and Das G, who received 7347 and 4857 total link strength, respectively .
This research shows that a total of 156096 citation references were generated, 822 cited references were meet the threshold, and there were 7 clusters, 119670 links, and 15934.22 total link strengths. The study found that the top most cited reference, Murray CB, 1993, Journal of the American Chemical Society VII5, p. 8706, appeared to have the highest link strength (364) and citations (366). Consequently, previous research aimed at Li et al. 2014 investigated bibliometric analysis of Nanosafety research (2003–2013). Carried in this study allows a significant Wick, Peter, wrote “The degree and kind of agglomeration affect carbon nanotube cytotoxicity” in Toxicology Letters in 2007. It is the most referenced publication, and the paper was mentioned 318 times between 2007 and 2014.
7. Research Implications
The findings of this study are of significant importance and have several implications:
1) Researchers: The study highlights key research areas, such as (specific areas), influential authors, and countries, helping them identify potential collaborators and important research directions.
2) Policymakers: The leading countries can guide policy decisions to foster international collaborations and funding allocations.
3) Industry Stakeholders: Understanding quantum dots research trends and key contributors can empower you to make strategic decisions from beneficial partnerships and identify promising investment opportunities.
8. Conclusion
Regarding practical ramifications, academics should perform more studies on broader issues, with findings that may benefit more stakeholders. Establishing an appropriate science and technology network among researchers worldwide may be necessary, particularly in poor countries. In terms of policy recommendations, governments around the world, including developing countries, should implement policies and programs to expand research and the network for quantum dots marketing. The approach used in this study is recommended for future research on even quantum dots. However, the further development of quantum dots research in the featured countries, such as China, the USA, India, Germany, Russia, and other countries, has now put great effort into increasing the country's collaboration.
Abbreviations

ACPP

Average Citation Per Paper

CPP

Citations Per Paper

PEI

Publication Efficiency Index

ROS

Reactive Oxygen Species

QCN

Quantum Communication & Networking

QDs

Quantum Dots

QDSSCs

Quantum Qots-sensitized Solar Cells

TLS

Total Link Strength

Conflicts of Interest
The authors declare no conflicts of interest.
References
[1] Xu J, Zheng J. Quantum dots and nanoclusters. Nano-inspired Biosensors for Protein Assay with Clinical Applications. Elsevier Inc.; 2018. 67–90 p.
[2] Brus LE. Electron-electron and electron-hole interactions in small semiconductor crystallites: The size dependence of the lowest excited electronic state. J Chem Phys. 1984; 80(9): 4403–9.
[3] Bailey RE, Smith AM, Nie S. Quantum dots in biology and medicine. Phys E Low-Dimensional Syst Nanostructures. 2004; 25(1): 1–12.
[4] Medintz IL, Uyeda HT, Goldman ER, Mattoussi H. Quantum dot bioconjugates for imaging, labelling and sensing. Nat Mater. 2005; 4(6): 435–46.
[5] He Y, Lu HT, Sai LM, Su YY, Hu M, Fan CH, et al. Microwave synthesis of water-dispersed CdTe/CdS/ZnS core-shell-shell quantum dots with excellent photostability and biocompatibility. Adv Mater. 2008; 20(18): 3416–21. https://doi.org/10.1002/adma.200701166
[6] Bogue R. Quantum dots: A bright future for photonic nanosensors. Sens Rev. 2010; 30(4): 279–84.
[7] Klostranec JM, Chan WCW. Quantum dots in biological and biomedical research: Recent progress and present challenges. Adv Mater. 2006; 18(15): 1953–64.
[8] Liu J, Lau SK, Varma VA, Moffitt RA, Caldwell M, Liu T, et al. Molecular mapping of tumor heterogeneity on clinical tissue specimens with multiplexed quantum dots. ACS Nano. 2010; 4(5): 2755–65.
[9] Zhang H, Yee D, Wang C. Quantum dots for cancer diagnosis and therapy: Biological and clinical perspectives. Nanomedicine. 2008; 3(1): 83–91.
[10] Michalet X, Pinaud FF, Bentolila LA, Tsay JM, Doose S, Li JJ, et al. Quantum dots for live cells, in vivo imaging, and diagnostics. Science (80-). 2005; 307(5709): 538–44.
[11] Utkin YN. Brain and Quantum Dots: Benefits of Nanotechnology for Healthy and Diseased Brain. Cent Nerv Syst Agents Med Chem. 2018; 18(3): 193–205.
[12] Wu T, Tang M. Toxicity of quantum dots on respiratory system. Inhal Toxicol. 2014; 26(2): 128–39.
[13] Zhang T, Wang Y, Kong L, Xue Y, Tang M. Threshold dose of three types of quantum dots (QDs) induces oxidative stress triggers DNA damage and apoptosis in mouse fibroblast L929 cells. Int J Environ Res Public Health. 2015; 12(10): 13435–54.
[14] Mohamed Riyas Z, Gayathri R, Prabhu MR, Velsankar K, Sudhahar S. Green synthesis and biomedical behavior of Mg-doped ZnO nanoparticle using leaf extract of Ficus religiosa. Ceram Int. 2022; 48(17): 24619–28.
[15] Coccia M. Technological trajectories in quantum computing to design a quantum ecosystem for industrial change. Technol Anal Strateg Manag. 2022; 1–16.
[16] Jiang SY, Chen SL. Exploring landscapes of quantum technology with Patent Network Analysis. Technol Anal Strateg Manag. 2021; 33(11): 1317–31.
[17] Gupta BM, Dhawan SM, Kumar A, Walke R. Quantum dots research in India: A bibliometric study of the publications output for the period 2000-2019. Int J Inf Dissem Technol. 2021; 11(1): 44–9.
[18] Wei T, Liu W, Zheng Z, Chen Y, Shen M, Li C. Bibliometric Analysis of Research Trends on 3-Monochloropropane-1,2-Diol Esters in Foods. J Agric Food Chem. 2022; 70(49): 15347–59.
[19] Zhong L, Zhang L, Li Y, Liang X, Kong L, Shen X, et al. Assessment of the toxicity of quantum dots through biliometric analysis. Int J Environ Res Public Health. 2021 Jun 1; 18(11).
[20] Wang J, Shen L, Zhou W. A bibliometric analysis of quantum computing literature: mapping and evidences from scopus. Technol Anal Strateg Manag. 2021; 33(11): 1347–63.
[21] Gupta BM, Dhawan SM, Mamdapur GMN, Visakhi R. Quantum Communication & Networking (QCN): A Scientometric Assessment of Global Publications during 1997–20. Int J Inf Dissem Technol. 2021; 11(2): 71–9.
[22] Gupta BM, Kappi M, Walke R, Biradar BS. Quantum Optics: A Scientometric Assessment of India’s Publications during 1996-2021. J Data Sci Inf Cit Stud. 2022; 1(1): 12–21.
[23] Gupta BM, Dhawan SM, Mamdapur GM. Quantum Cryptography Research: A Scientometric Assessment of Global Publications during 1992-2019. Sci Technol Libr. 2021; 40(3): 282–300.
[24] Dhawan S. M., Gupta B. M. GMNM. Quantum Machine Learning: A Scientometric Assessment of Global Publications during 1999-2020. Int J Knowl Content Dev Technol 2021; 11(3): 29–44.
[25] Scheidsteger T, Haunschild R, Bornmann L, Ettl C. Bibliometric analysis in the field of quantum technology. Quantum Reports. 2021 Sep 1; 3(3): 549–75.
[26] Rajendran S, Jeyshankar R. Citation Analysis on Quantum Dots literature during 2006-2020. 2022 Jun 10
[27] Ding Y, Chowdhury GG, Foo S. Bibliometric cartography of information retrieval research by using co-word analysis. Inf Process Manag. 2001; 37(6): 817–42.
[28] van Eck NJ, Waltman L. Software survey: VOSviewer, a computer program for bibliometric mapping. Scientometrics. 2010; 84(2): 523–38.
[29] Ferreira FAF. Mapping the field of arts-based management: Bibliographic coupling and co-citation analyses. J Bus Res. 2018; 85 (September 2015): 348–57.
[30] Koseoglu MA, Rahimi R, Okumus F, Liu J. Bibliometric studies in tourism. Ann Tour Res. 2016; 61: 180–98.
[31] Sahu MK. Bibliographic coupling and co-citation networking analysis determining research contributions of business school between 1965-June, 2020: With special reference to Indian Institute of Management, India. Libr Philos Pract. 2021; 2021 (March): 14.
[32] Glänzel W, Thijs B. Using “core documents” for detecting and labelling new emerging topics. Scientometrics. 2012; 91(2): 399–416.
[33] Subandi Y, Amini DS, Nurgiyanti T, Nuswantoro BS, Wiratma HD. Research on Covid-19 Human Security Disaster Management in Indonesia Using VOSviewer Bibliometrics. RSF Conf Proceeding Ser Med Heal Sci. 2023; 2(1): 58–67.
[34] Gupta BM, Bhattacharya S. Bibliometric approach towards mapping the dynamics of science and technology. DESIDOC Bull Inf Technol. 2004; 24(1): 3–8.
[35] Martinho VJPD. Bibliographic Coupling Links: Alternative Approaches to Carrying Out Systematic Reviews about Renewable and Sustainable Energy. Environ - MDPI. 2022; 9(2).
[36] Phan Tan L. Bibliometrics of social entrepreneurship research: Cocitation and bibliographic coupling analyses. Cogent Bus Manag. 2022; 9(1).
[37] Batagelj V. On fractional approach to analysis of linked networks. Scientometrics 2020; 123(2): 621–33.
[38] Svobodová L, Bednarska-Olejniczak D. SMART City and Economy: Bibliographic Coupling and Co-occurrence. Lect Notes Comput Sci. 2020; 12066 LNCS: 102–13.
[39] Bresciani S, Ciampi F, Meli F, Ferraris A. Using big data for co-innovation processes: Mapping the field of data-driven innovation, proposing theoretical developments and providing a research agenda. Int J Inf Manage. 2021; 60 (March): 102347.
[40] Velmurugan C, Ramasamy G. Nephrology Publications of Bibliographic Coupling and Co-authorship Network using VOS viewer: A Scientometric Profile. Libr Philos Pract. 2021; 2021.
[41] Thanuskodi S. Bibliometric analysis of the journal library philosophy and practice from 2005-2009. Libr Philos Pract. 2010; 2010 (OCTOBER): 1–6.
[42] Montecchi M, Plangger K, West DC. Supply chain transparency: A bibliometric review and research agenda. Int J Prod Econ. 2021; 238 (April): 108152.
[43] Nishavathi E,, R. Jeyshankar, Oh DG. Evaluating Research Output Using Scientometric and Social Network Analysis: A Case of Alagappa University, India. Int J Inf Sci Manag. 2022 Dec 1; 20(2): 325–45.
[44] van Eck NJ, Waltman L. Visualizing Bibliometric Networks. Measuring Scholarly Impact. 2014. 285–320 p.
[45] Sargunapathi, R., Vinayagamoorthy, P., Sumathi, P., & Sirajunissa Begum, S. (2020). Mapping of Scientific Articles on Brain Tumors: A Scientometric Study. Indian Journal of Information Sources and Services, 10(2), 26-34.
[46] Bhattacharya S, Shilpa, Bhati M. China and India: The two new players in the nanotechnology race. Scientometrics. 2012; 93(1): 59–87.
[47] Phan Tan L. Mapping the social entrepreneurship research: Bibliographic coupling, co-citation and co-word analyses. Cogent Bus Manag. 2021; 8(1).
[48] Li J, Guo X, Jovanovic A. Bibliometrics Analysis of Nanosafety Research. Collnet J Sci Inf Manag. 2014; 8(2): 437–55.
[49] Sargunapathi R, Jeyshankar R, and Thanuskodi S. Bibliometric Analysis of Scientific Collaboration in Quantum Dots Literature. Indian Jou of Infor Sou and Services 2024; 14(2): 178-185 p.
[50] Chen X, Chen J, Wu D, Xie Y, Li J. Mapping the Research Trends by Co-word Analysis Based on Keywords from Funded Project. Procedia Comput Sci. 2016; 91(Itqm): 547–55.
[51] Bhattacharya S, Basu PK. Mapping a research area at the micro level using co-word analysis. Scientometrics. 1998; 43(3): 359–72.
[52] Hancock TO, Broekaert J, Hess S, Choudhury CF. Quantum probability: A new method for modelling travel behaviour. Transp Res Part B Methodol. 2020; 139: 165–98.
[53] Haghani M, Bliemer MCJ, Hensher DA. The landscape of econometric discrete choice modelling research. J Choice Model. 2021; 40 (January): 100303.
[54] Guleria D, Kaur G. Bibliometric analysis of ecopreneurship using VOSviewer and RStudio Bibliometrix, 1989–2019. Libr Hi Tech. 2021; 39(4): 1001–24.
[55] Yu Y, Li Y, Zhang Z, Gu Z, Zhong H, Zha Q, et al. A bibliometric analysis using VOSviewer of publications on COVID-19. Ann Transl Med. 2020; 8(13): 816–816.
[56] Rofaie NSA, Phoong SW, Talib MA, Sulaiman A. Light-emitting diode (LED) research: A bibliometric analysis during 2003–2018. Qual Quant. 2023; 57(1): 173–91.
[57] Rostami C, Nemati-Anaraki L, Asadzandi S, Saberi MK. Bibliometric Analysis and Visualization of Scientific Publications of Iran University of Medical Sciences during 1980-2020. Int J Inf Sci Manag. 2024; 22(1): 223–40.
Cite This Article
  • APA Style

    Rajendran, S., Ramalingam, J., Shanmugam, T. (2024). Mapping the Field of Quantum Dots Literature: Bibliographic Coupling and Cited Reference. American Journal of Information Science and Technology, 8(3), 98-110. https://doi.org/10.11648/j.ajist.20240804.11

    Copy | Download

    ACS Style

    Rajendran, S.; Ramalingam, J.; Shanmugam, T. Mapping the Field of Quantum Dots Literature: Bibliographic Coupling and Cited Reference. Am. J. Inf. Sci. Technol. 2024, 8(3), 98-110. doi: 10.11648/j.ajist.20240804.11

    Copy | Download

    AMA Style

    Rajendran S, Ramalingam J, Shanmugam T. Mapping the Field of Quantum Dots Literature: Bibliographic Coupling and Cited Reference. Am J Inf Sci Technol. 2024;8(3):98-110. doi: 10.11648/j.ajist.20240804.11

    Copy | Download

  • @article{10.11648/j.ajist.20240804.11,
      author = {Sargunapathi Rajendran and Jeyshankar Ramalingam and Thanuskodi Shanmugam},
      title = {Mapping the Field of Quantum Dots Literature: Bibliographic Coupling and Cited Reference
    },
      journal = {American Journal of Information Science and Technology},
      volume = {8},
      number = {3},
      pages = {98-110},
      doi = {10.11648/j.ajist.20240804.11},
      url = {https://doi.org/10.11648/j.ajist.20240804.11},
      eprint = {https://article.sciencepublishinggroup.com/pdf/10.11648.j.ajist.20240804.11},
      abstract = {The science of quantum dots has evolved rapidly in recent years. A quantitative and comprehensive examination of the research domain is required to identify research trends and directions in the field. This work, a systematic review of 4176 scientific articles published in the Web of Science database between 2014 and 2023, results from collaborative efforts. The results, based on two citation analysis methods- bibliographic coupling and cited reference method- identify some of the most active and influential documents, authors, countries, cited references, and keywords in the field. The study reveals rankings, collaboration networks, and clusters of contributions to the literature. The study found that the most bibliographic coupling documents were Lim, 2015, and the countries with the most publications and collaborations have been China and the USA. Specifically, the fourth cluster of authors is linked with each cluster, and the most frequently cited reference is Murray CB, 1993, Journal of the American Chemical Society VII5, P8706. Quantum dots stand out prominently, ranking second in occurrences with 1864 mentions and relative influence. This research is a testament to the collaborative nature of scientific inquiry in understanding the current state and future directions of quantum dots research.
    },
     year = {2024}
    }
    

    Copy | Download

  • TY  - JOUR
    T1  - Mapping the Field of Quantum Dots Literature: Bibliographic Coupling and Cited Reference
    
    AU  - Sargunapathi Rajendran
    AU  - Jeyshankar Ramalingam
    AU  - Thanuskodi Shanmugam
    Y1  - 2024/12/31
    PY  - 2024
    N1  - https://doi.org/10.11648/j.ajist.20240804.11
    DO  - 10.11648/j.ajist.20240804.11
    T2  - American Journal of Information Science and Technology
    JF  - American Journal of Information Science and Technology
    JO  - American Journal of Information Science and Technology
    SP  - 98
    EP  - 110
    PB  - Science Publishing Group
    SN  - 2640-0588
    UR  - https://doi.org/10.11648/j.ajist.20240804.11
    AB  - The science of quantum dots has evolved rapidly in recent years. A quantitative and comprehensive examination of the research domain is required to identify research trends and directions in the field. This work, a systematic review of 4176 scientific articles published in the Web of Science database between 2014 and 2023, results from collaborative efforts. The results, based on two citation analysis methods- bibliographic coupling and cited reference method- identify some of the most active and influential documents, authors, countries, cited references, and keywords in the field. The study reveals rankings, collaboration networks, and clusters of contributions to the literature. The study found that the most bibliographic coupling documents were Lim, 2015, and the countries with the most publications and collaborations have been China and the USA. Specifically, the fourth cluster of authors is linked with each cluster, and the most frequently cited reference is Murray CB, 1993, Journal of the American Chemical Society VII5, P8706. Quantum dots stand out prominently, ranking second in occurrences with 1864 mentions and relative influence. This research is a testament to the collaborative nature of scientific inquiry in understanding the current state and future directions of quantum dots research.
    
    VL  - 8
    IS  - 3
    ER  - 

    Copy | Download

Author Information