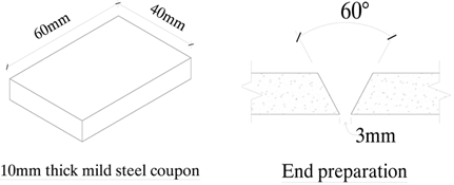
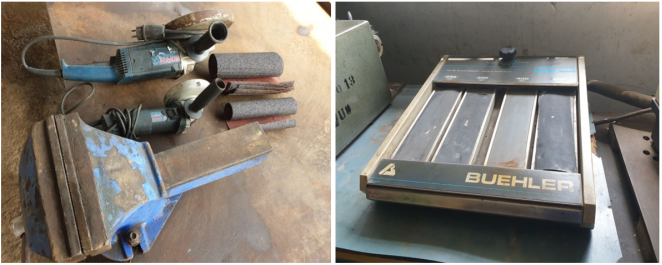
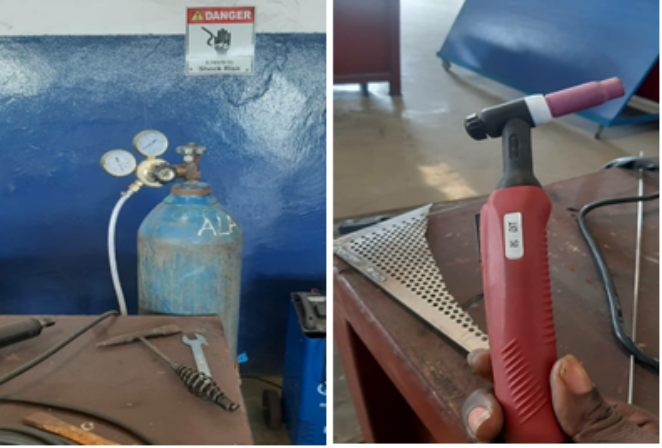
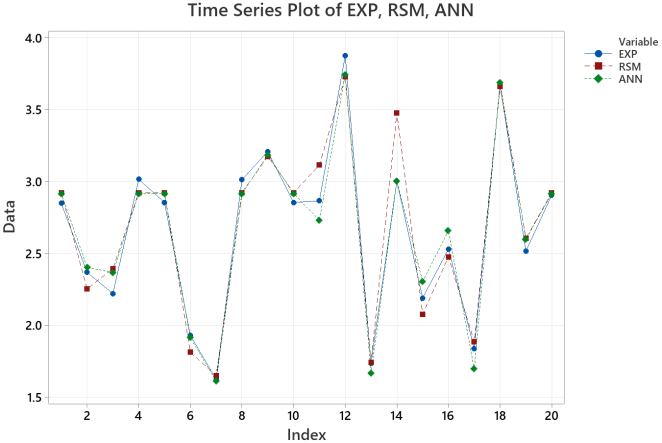
This study compares the effectiveness of Response Surface Methodology (RSM) and Artificial Neural Networks (ANN) in optimizing the thermal diffusivity of mild steel Tungsten Inert Gas (TIG) welds. The analysis evaluates the predictive accuracy and optimization efficiency of both techniques, providing insights into their suitability for modeling thermal behavior in welding applications. The set of tools, including power hacksaw cutting and grinding machines, mechanical vice, emery (sand) paper and sander was used to prepare the mild steel coupons for welding. The produced coupons were evaluated for their Thermal Diffusivity. The two expert systems used to determine the effect of the interaction of welding current, welding voltage and gas flowrate on the Thermal Diffusivity were the Response Surface Methodology and Artificial Neural Network. The models were validated using the model summary values between the experimental results compared to RSM (R2 = 94.49%) and ANN (R2 = 97.83%) values. This shows that ANN is a better predictor as compared to RSM.
| Published in | American Journal of Mechanical and Materials Engineering (Volume 9, Issue 2) |
| DOI | 10.11648/j.ajmme.20250902.11 |
| Page(s) | 43-49 |
| Creative Commons |
This is an Open Access article, distributed under the terms of the Creative Commons Attribution 4.0 International License (http://creativecommons.org/licenses/by/4.0/), which permits unrestricted use, distribution and reproduction in any medium or format, provided the original work is properly cited. |
| Copyright |
Copyright © The Author(s), 2025. Published by Science Publishing Group |
Thermal Diffusivity, Mild Steel, TIG, Gas Flowrate, Current, Voltage
S/N | I Amp | E, Volt | GFR L/min |
|---|---|---|---|
1 | 165.000 | 17.500 | 14.500 |
2 | 180.000 | 16.000 | 16.000 |
3 | 150.000 | 19.000 | 16.000 |
4 | 165.000 | 17.500 | 14.500 |
5 | 165.000 | 17.500 | 14.500 |
6 | 165.000 | 20.023 | 14.500 |
7 | 180.000 | 19.000 | 16.000 |
8 | 165.000 | 17.500 | 14.500 |
9 | 150.000 | 19.000 | 13.000 |
10 | 165.000 | 17.500 | 14.500 |
11 | 180.000 | 16.000 | 13.000 |
12 | 139.773 | 17.500 | 14.500 |
13 | 180.000 | 19.000 | 13.000 |
14 | 165.000 | 14.977 | 14.500 |
15 | 190.227 | 17.500 | 14.500 |
16 | 165.000 | 17.500 | 11.977 |
17 | 165.000 | 17.500 | 17.023 |
18 | 150.000 | 16.000 | 13.000 |
19 | 150.000 | 16.000 | 16.000 |
20 | 165.000 | 17.500 | 14.500 |
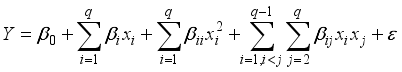 (1)
(1) 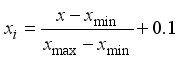 (2)
(2) S | R-sq | R-sq(adj) |
|---|---|---|
0.146883 | 94.49% | 94.18% |
S/N | Input parameters | Exp | RSM prediction | ANN | ||
|---|---|---|---|---|---|---|
Responses | Prediction | |||||
Current | voltage | GFR | Thermal Diffusivity | Thermal Diffusivity | Thermal Diffusivity | |
1 | 165.000 | 17.500 | 14.500 | 2.849 | 2.924 | 2.916 |
2 | 180.000 | 16.000 | 16.000 | 2.370 | 2.253 | 2.405 |
3 | 150.000 | 19.000 | 16.000 | 2.221 | 2.395 | 2.368 |
4 | 165.000 | 17.500 | 14.500 | 3.016 | 2.924 | 2.916 |
5 | 165.000 | 17.500 | 14.500 | 2.855 | 2.924 | 2.916 |
6 | 165.000 | 20.023 | 14.500 | 1.931 | 1.813 | 1.914 |
7 | 180.000 | 19.000 | 16.000 | 1.625 | 1.651 | 1.612 |
8 | 165.000 | 17.500 | 14.500 | 3.014 | 2.924 | 2.916 |
9 | 150.000 | 19.000 | 13.000 | 3.210 | 3.175 | 3.186 |
10 | 165.000 | 17.500 | 14.500 | 2.855 | 2.924 | 2.916 |
11 | 180.000 | 16.000 | 13.000 | 2.867 | 3.115 | 2.732 |
12 | 139.773 | 17.500 | 14.500 | 3.877 | 3.729 | 3.746 |
13 | 180.000 | 19.000 | 13.000 | 1.737 | 1.741 | 1.665 |
14 | 165.000 | 14.977 | 14.500 | 3.004 | 3.479 | 3.005 |
15 | 190.227 | 17.500 | 14.500 | 2.191 | 2.078 | 2.305 |
16 | 165.000 | 17.500 | 11.977 | 2.531 | 2.476 | 2.659 |
17 | 165.000 | 17.500 | 17.023 | 1.839 | 1.885 | 1.696 |
18 | 150.000 | 16.000 | 13.000 | 3.666 | 3.661 | 3.691 |
19 | 150.000 | 16.000 | 16.000 | 2.5161 | 2.605 | 2.599 |
20 | 165.000 | 17.500 | 14.500 | 2.905 | 2.924 | 2.916 |
ANN | Artificial Neural Network |
CCD | Central Composite Design |
DoE | Design of Experiment |
EXP | Experiment |
GFR | Gas Flowrate |
RSM | Response Surface Methodology |
| [1] | Jafar Z, Behdad M, Hiroki I (2013) Combustion and flame spread on fuel-soaked porous solids progress in energy and combustion science volume 39, issue 4, august 2013, pages 320-339. |
| [2] | Chao CHY, Wang JH, Wenjun K (2004) Effects of fuel properties on the combustion behavior of different types of porous beds soaked with combustible liquid, International Journal of Heat and Mass Transfer 47 (2004) 5201–5210. |
| [3] | Chao, T. T., Ma, Y. Y., Li, M. W. (2019) Hydrocarbon Characteristics of Inter-Salt System in Qian 3 Member of Qianjiang Sag, Jianghan Basin and Their Indication. Journal of Xi’an Shiyou University (Natural Science Edition), 34, 25-30. |
| [4] | Chen, H. M, Wang Q, Geng D. L, Wang H. P (2021). Specific heat, Thermal Diffusivity, and thermal conductivity of Ag–Si alloys within a wide temperature range of 293–823 K, Journal of Physics and Chemistry of Solids Volume 153, June 2021, 109997. |
| [5] | Adam Adamowicz (2022), determination of Thermal Diffusivity values based on the inverse problemof heat conduction – numerical analysis, acta mechanica et automatica, vol. 16 no. 4 (2022) 399. |
| [6] | PHuda M. Kamal, P PMarah Mohamed (2021) Determination of Thermal Conductivity, Thermal Diffusivity and Thermal Effusivity in Fired Clay Bricks, International Journal of Innovative Science, Engineering & Technology, Vol. 8 Issue 10, October 2021 ISSN (Online) 2348 – 7968. |
| [7] | Ali SK, musto- onuaha, orazulike d. m., (2004) Thermal Diffusivity estimates in the chad basin, N. E. nigeria-implications for petroleum exploration, ASSET An International Journal Series B (2004) 3(1): 155-171. |
| [8] | Magee TRA. And Bransburg T (1995) Measurement of Thermal Diffusivity of potato, malt bread and wheat flour Journal of Food Engineering Volume 25, Issue 2, 1995, Pages 223-232. |
| [9] | Tsuyoshi N, Hiroyuki S, Koichi T, Hiromichi O, Yoshio W, (2002) Measurement of Thermal Diffusivity of Steels at Elevated Temperature by a Laser Flash Method ISIJ International 42(5): 498-503. |
| [10] | Nuran, B. (2007) The Response Surface Methodology. Master of Science in Applied Mathematics and Computer Science, PhD Dissertation, Faculty of the Indiana University, South Bend. |
| [11] | Igbinake, A. O., Achebo, J. I., Obahiagbon, K. O. and Ozigagun, A.; (2023) application of expert methods to enhance the impact energy of v-butt weldment journal of Engineering for Development, Vol. 15(1), March (2023) pp. 26-36. |
| [12] | Sinan, M. T; Beytullah, E and Asude, A (2011), Prediction of adsorption efficiency for the removal of Ni(II) ions by zeolite using artificial neural network (ANN) approach, Fresenius Environmental Bulletin, vol. 20(12), pp; 3158-3165. |
APA Style
Igbinake, A. O. (2025). Comparison of Response Surface Methodology (RSM) and Artificial Neural Networks (ANN) in Optimisation of the Thermal Diffusivity of Mild Steel TIG Welding. American Journal of Mechanical and Materials Engineering, 9(2), 43-49. https://doi.org/10.11648/j.ajmme.20250902.11
ACS Style
Igbinake, A. O. Comparison of Response Surface Methodology (RSM) and Artificial Neural Networks (ANN) in Optimisation of the Thermal Diffusivity of Mild Steel TIG Welding. Am. J. Mech. Mater. Eng. 2025, 9(2), 43-49. doi: 10.11648/j.ajmme.20250902.11
@article{10.11648/j.ajmme.20250902.11,
  author = {Augustine Oghenekevwe Igbinake},
  title = {Comparison of Response Surface Methodology (RSM) and Artificial Neural Networks (ANN) in Optimisation of the Thermal Diffusivity of Mild Steel TIG Welding},
  journal = {American Journal of Mechanical and Materials Engineering},
  volume = {9},
  number = {2},
  pages = {43-49},
  doi = {10.11648/j.ajmme.20250902.11},
  url = {https://doi.org/10.11648/j.ajmme.20250902.11},
  eprint = {https://article.sciencepublishinggroup.com/pdf/10.11648.j.ajmme.20250902.11},
  abstract = {This study compares the effectiveness of Response Surface Methodology (RSM) and Artificial Neural Networks (ANN) in optimizing the thermal diffusivity of mild steel Tungsten Inert Gas (TIG) welds. The analysis evaluates the predictive accuracy and optimization efficiency of both techniques, providing insights into their suitability for modeling thermal behavior in welding applications. The set of tools, including power hacksaw cutting and grinding machines, mechanical vice, emery (sand) paper and sander was used to prepare the mild steel coupons for welding. The produced coupons were evaluated for their Thermal Diffusivity. The two expert systems used to determine the effect of the interaction of welding current, welding voltage and gas flowrate on the Thermal Diffusivity were the Response Surface Methodology and Artificial Neural Network. The models were validated using the model summary values between the experimental results compared to RSM (R2 = 94.49%) and ANN (R2 = 97.83%) values. This shows that ANN is a better predictor as compared to RSM.},
 year = {2025}
}
TY  - JOUR
T1  - Comparison of Response Surface Methodology (RSM) and Artificial Neural Networks (ANN) in Optimisation of the Thermal Diffusivity of Mild Steel TIG Welding
AU  - Augustine Oghenekevwe Igbinake
Y1  - 2025/03/28
PY  - 2025
N1  - https://doi.org/10.11648/j.ajmme.20250902.11
DO  - 10.11648/j.ajmme.20250902.11
T2  - American Journal of Mechanical and Materials Engineering
JF  - American Journal of Mechanical and Materials Engineering
JO  - American Journal of Mechanical and Materials Engineering
SP  - 43
EP  - 49
PB  - Science Publishing Group
SN  - 2639-9652
UR  - https://doi.org/10.11648/j.ajmme.20250902.11
AB  - This study compares the effectiveness of Response Surface Methodology (RSM) and Artificial Neural Networks (ANN) in optimizing the thermal diffusivity of mild steel Tungsten Inert Gas (TIG) welds. The analysis evaluates the predictive accuracy and optimization efficiency of both techniques, providing insights into their suitability for modeling thermal behavior in welding applications. The set of tools, including power hacksaw cutting and grinding machines, mechanical vice, emery (sand) paper and sander was used to prepare the mild steel coupons for welding. The produced coupons were evaluated for their Thermal Diffusivity. The two expert systems used to determine the effect of the interaction of welding current, welding voltage and gas flowrate on the Thermal Diffusivity were the Response Surface Methodology and Artificial Neural Network. The models were validated using the model summary values between the experimental results compared to RSM (R2 = 94.49%) and ANN (R2 = 97.83%) values. This shows that ANN is a better predictor as compared to RSM.
VL  - 9
IS  - 2
ER  -
Department of Production Engineering, University of Benin, Benin City, Nigeria
Information