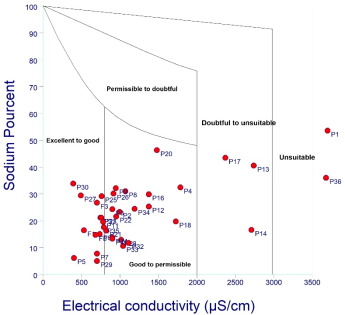
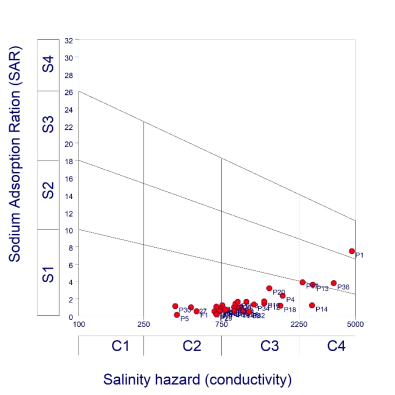
Water resource availability in quantity and quality is a primary factor which influences the development of various human activities worldwide. In most countries in Africa, due to the scarcity and poor quality of surface water, groundwater is the main natural resource used to relieve the increasing water demands of population. In Diourbel region (central Senegal), groundwater is an important resource used for economic activities. This study aims to evaluate groundwater quality and suitability for drinking and irrigation purposes. Thirty-seven (37) samples (boreholes and dug wells) were collected and major ions were analyzed. Classification of groundwater using TDS (Total Dissolved Solids) and TH (Total Hardness) showed respectively that 81.08% fall in the fresh water type, suggesting suitability for drinking water purpose. Moreover, most of groundwater samples fall in hard (21.62%) and very hard (75.68%) category of water. Furthermore, the computed values of WQI indicate majority of groundwater samples (76%) falls under good to excellent water, suggesting that the groundwater is suitable for drinking and other domestic uses. Data Wilcox and US Salinity Laboratory (USSL) plots show that the majority of groundwater samples are suitable for irrigation.% N, SAR, KR, PI, and RSC show that groundwater samples are suitable for irrigation except MR (Magnesium Ratio). This study shows a good quality of groundwater for consumption and irrigation purposes and thus contributes to the rural and urban development of the study area where the most productive aquifer is limited by the presence of brackish water.
| Published in | American Journal of Water Science and Engineering (Volume 12, Issue 1) |
| DOI | 10.11648/j.ajwse.20261201.12 |
| Page(s) | 13-26 |
| Creative Commons |
This is an Open Access article, distributed under the terms of the Creative Commons Attribution 4.0 International License (http://creativecommons.org/licenses/by/4.0/), which permits unrestricted use, distribution and reproduction in any medium or format, provided the original work is properly cited. |
| Copyright |
Copyright © The Author(s), 2026. Published by Science Publishing Group |
Drinking and Irrigation Suitability, Groundwater Quality, Water Quality Index, Diourbel, Senegal
Chemical Parameters | Units | WHO standard 2006 and 2011 | Weight (wi) | Relative weight (Wi) |
|---|---|---|---|---|
pH | - | 6.5 -8.5 | 3 | 0.075 |
TDS | mg/L | 500 | 5 | 0.125 |
TH | mg/L | 200 | 3 | 0.075 |
Ca2+ | mg/L | 75 | 3 | 0.075 |
Mg2+ | mg/L | 30 | 3 | 0.075 |
Na+ | mg/L | 200 | 2 | 0.05 |
K+ | mg/L | 12 | 1 | 0.025 |
HCO3- | mg/L | 350 | 3 | 0.075 |
SO42- | mg/L | 250 | 3 | 0.075 |
NO3- | mg/L | 50 | 5 | 0.125 |
F- | mg/L | 1.5 | 5 | 0.125 |
Cl- | mg/L | 250 | 4 | 0.1 |
|
|
Libellé | Samples | Aquifer | pH | CE | HCO3- | Cl- | SO42- | NO3- | F- | Na+ | K+ | Mg2+ | Ca2+ | Fe2+ |
|---|---|---|---|---|---|---|---|---|---|---|---|---|---|---|
P33 | Baity | eocene | 7.9 | 1040 | 445.3 | 75.03 | 104.5 | 0.58 | 0.27 | 24.13 | 3.23 | 49.92 | 109.82 | 0.21 |
P12 | Boundou | eocene | 7.36 | 1375 | 366 | 161.77 | 178.56 | 1.24 | 0.2 | 75.95 | 7.28 | 66.74 | 96.14 | 0.06 |
P27 | Bousrah | eocene | 6.89 | 490 | 67.1 | 85.49 | 6.91 | 66.4 | 0.15 | 30.09 | 1.77 | 12.72 | 44.06 | 1.38 |
P2 | Coky Ndiaguène | eocene | 7.24 | 997 | 244 | 135.1 | 105.23 | 0.81 | 0.31 | 45.77 | 7.23 | 45.96 | 68.35 | 0.11 |
P18 | Darou Ndiaye | eocene | 7.88 | 1727 | 378.2 | 162.55 | 320.77 | 3.45 | 0.4 | 71.55 | 8.46 | 86.47 | 129.67 | 0.21 |
P22 | Darou Salam Typ | eocene | 7.72 | 950 | 195.2 | 133.9 | 0.92 | 119.8 | 0.24 | 39.14 | 6.26 | 19.99 | 103.09 | 0.46 |
P4 | diokoul 2 | eocene | 6.91 | 1786 | 610 | 270.02 | 65.32 | 2.06 | 0.41 | 133.65 | 9.51 | 80.28 | 119.86 | 0.83 |
P28 | Diorel | eocene | 7.92 | 1015 | 475.8 | 75.1 | 47.96 | 3.68 | 0.23 | 28.97 | 2.44 | 53.76 | 91.5 | 0.07 |
P25 | Fassel | eocene | 7.7 | 760 | 152.5 | 94.5 | 98.7 | 0.72 | 0.18 | 46.53 | 4.53 | 9.27 | 88.74 | 0.14 |
P21 | Gallé | eocene | 7.33 | 818 | 335.5 | 71.78 | 38.77 | 0.61 | 0.2 | 26.93 | 4.08 | 18.01 | 102.35 | 0.18 |
P3 | Keur Awa Loumene | eocene | 7.21 | 900 | 253.15 | 80.83 | 57.7 | 62.56 | 0.35 | 41.65 | 6.82 | 33.93 | 68.14 | 0.14 |
P8 | Keur Mousseu | eocene | 7.41 | 1070 | 366 | 136.2 | 92.08 | 0.63 | 0.3 | 73.82 | 6.21 | 44.75 | 76.34 | 0.07 |
F3 | Kewré | eocene | 7.68 | 700 | 262.3 | 75.26 | 13.84 | 3.09 | 0.17 | 41.43 | 3.65 | 7.43 | 91.77 | 0.16 |
P31 | Khandiar | eocene | 7.88 | 745 | 311.1 | 53.83 | 26.44 | 8.55 | 0.24 | 32.27 | 2.68 | 8.51 | 96 | 0.12 |
P23 | Koba Diop | eocene | 8.09 | 754 | 268.4 | 72.06 | 23.86 | 17.16 | 0.19 | 30.83 | 3.87 | 17.10 | 79.86 | 0.31 |
F1 | Lappe | eocene | 7.41 | 530 | 237.9 | 54.03 | 3.1 | 1.17 | 0.24 | 18.5 | 3.14 | 7.14 | 78.25 | 0.14 |
P36 | Lougoul | eocene | 6.73 | 3680 | 128.1 | 1263.37 | 131.6 | 5.73 | 0.39 | 300.4 | 16.96 | 183.63 | 177.73 | 0.12 |
P16 | Magagne | eocene | 7.83 | 1376 | 384.3 | 180.18 | 120.22 | 2.78 | 0.37 | 82.89 | 8.33 | 42.22 | 110.5 | 0.15 |
P6 | Mbarane Thiam | eocene | 7.55 | 737 | 305 | 71.85 | 22.03 | 2.151 | 0.28 | 21.8 | 5.6 | 24.23 | 84.12 | 0.07 |
P34 | Mbary 2 | eocene | 7.95 | 1190 | 427 | 126 | 79.56 | 1.91 | 0.25 | 64.47 | 3.78 | 37.33 | 118.55 | 0.18 |
P13 | Medina Touré | eocene | 7.15 | 2740 | 109.8 | 541.29 | 11.9 | 577.81 | 0.48 | 229.4 | 14.82 | 55.81 | 212.13 | 0.08 |
P11 | Merina Dieng | eocene | 7.33 | 780 | 292.8 | 82.8 | 43.72 | 3.15 | 0.27 | 32.17 | 5.3 | 32.47 | 72.55 | 0.17 |
P26 | Ndary Diop | eocene | 7.8 | 915 | 341.6 | 107.84 | 17.26 | 2.59 | 0.25 | 57.55 | 6.61 | 9.91 | 107.69 | 0.46 |
F5 | Ndiégué | eocene | 7.79 | 681 | 305 | 57.59 | 5.42 | 0.65 | 0.23 | 20.32 | 3.02 | 9.72 | 96 | 0.05 |
P7 | Ndjiss | eocene | 7.46 | 700 | 366 | 21.73 | 28.85 | 0.42 | 0.3 | 10.78 | 3.12 | 36.98 | 70.6 | 0.18 |
P20 | Ngaraf Mbayène | eocene | 7.54 | 1480 | 274.5 | 135.7 | 285.24 | 3.7 | 0.3 | 141.35 | 8.1 | 13.72 | 125.29 | 0.12 |
P1 | Ngascop | eocene | 7.29 | 4750 | 381.25 | 1447.91 | 165.12 | 1.78 | 0.41 | 576.62 | 30.17 | 135.96 | 224.2 | 0.07 |
P29 | Ngogom | eocene | 8.1 | 700 | 384.3 | 28.8 | 3.47 | 5.12 | 0.14 | 6.92 | 1.89 | 26.94 | 87.65 | 0.49 |
P17 | Peulh Ndiaye | eocene | 8.25 | 2370 | 427 | 287.74 | 485.8 | 2.59 | 0.45 | 233.17 | 11.42 | 65.71 | 163.84 | 0.28 |
P24 | Sakal | eocene | 7.77 | 901 | 427 | 54.15 | 43.92 | 0.49 | 0.21 | 27.6 | 2.19 | 33.51 | 103.91 | 0.03 |
P19 | Sandatou | eocene | 7.37 | 898 | 335.5 | 45 | 95.9 | 4.45 | 0.23 | 24.24 | 3.23 | 41.22 | 80.15 | 0.28 |
P35 | Sandiara | eocene | 8 | 790 | 396.5 | 32.44 | 29.01 | 3.76 | 0.18 | 31.05 | 1.89 | 30.22 | 81.34 | 0.1 |
P30 | Satte | eocene | 7.27 | 390 | 128.1 | 64.76 | 3.32 | 0.41 | 0.08 | 29.45 | 2.03 | 6.32 | 41.6 | 0.37 |
P5 | Siguidiadji | eocene | 7.2 | 400 | 183 | 21.6 | 12.78 | 2.19 | 0.22 | 4.68 | 1.34 | 17.19 | 43.7 | 0.03 |
P9 | Thialle | eocene | 8.26 | 946 | 298.9 | 126.34 | 79.81 | 1.36 | 0.29 | 69.14 | 6.69 | 38.63 | 70.41 | 0.21 |
P14 | Touba Guédé | eocene | 7.33 | 2710 | 314.15 | 628.69 | 39.4 | 181.02 | 0.33 | 92.6 | 13.16 | 125.22 | 232.04 | 0.25 |
P32 | Touba Mboul | eocene | 7.28 | 1110 | 198.25 | 150.21 | 26.6 | 120.09 | 0.33 | 25.55 | 2.92 | 25.70 | 137.7 | 0.07 |
Parameters | Range | Water type | Number of samples | % of samples |
|---|---|---|---|---|
TH [18] | ˂ 75 | Soft | 0 | 0 |
75 - 150 | Moderately hard | 1 | 2.7 | |
150 - 300 | Hard | 8 | 21.62 | |
˃ 300 | Very hard | 28 | 75.68 | |
TDS [20] | ˂ 1000 | Fresh | 30 | 81.08 |
1000 – 10 000 | Brackish | 7 | 18.92 | |
10000 – 100 000 | Saline | 0 | 0 | |
˃ 100 000 | Brine | 0 | 0 |
WQI values | Water quality status | Number of samples | % of samples |
|---|---|---|---|
˂50 | Excellent water | 3 | 8 |
50 – 100 | Good water | 25 | 67.5 |
100 – 200 | Poor water | 5 | 13.5 |
200 – 300 | Very poor water | 4 | 11 |
˃300 | Unsuitable water for drinking | - | - |
Parameters | Range | Water type | Number of samples | % of samples |
|---|---|---|---|---|
SAR | ˂ 10 | Excellent | 37 | 100 |
10 - 18 | Good | - | - | |
18 - 26 | Fair | - | - | |
˃ 26 | Unsuitable | - | - | |
% N | ˂ 20 | Excellent | 16 | 43.24 |
20 - 40 | Good | 17 | 45.95 | |
40 - 60 | Permissible | 4 | 10.81 | |
60 - 80 | Doubtful | - | - | |
˃ 80 | Unsuitable | - | - | |
PI | ˃ 75% | Class I | - | - |
75 - 25% | Class II | 36 | 97 | |
˃ 25% | Class III | 1 | 3 | |
RSC | ˂ 1.25 | Good | 37 | 100 |
1.25 – 2.50 | Doubtful | - | - | |
˃ 2.50 | Unsuitable | - | - | |
KR | ˂ 1 | suitable | 36 | 97.3 |
˃ 1 | unsuitable | 1 | 2.7 | |
MR | ˂ 50% | Unsuitable | 32 | 86.49 |
˃ 50% | Suitable | 5 | 13.51 |
% N | Sodium Percent |
ANSD | National Agency of Statistics and Demography |
EC | Electrical Conductivity |
KR | Kelly Ratio |
MR | Magnesium Ratio |
PI | Permeability Index |
RSC | Residual Sodium Carbonate |
SAR | Sodium Absorption Ratio |
TDS | Total Dissolved Solids |
TH | Total Hardness |
WHO | World Health Organisation |
WQI | Water Quality Index |
| [1] | S. Salehi, M. Chizari, H. Sadighi, et M. Bijani, «Assessment of agricultural groundwater users in Iran: a cultural environmental bias», Hydrogeol J, vol. 26, no 1, p. 285-295, févr. 2018, |
| [2] | G. Yasmin, D. Islam, M. Islam, M. ShariotUllah, et A. Adham, «Evaluation of groundwater quality for irrigation and drinking purposes in Barishal district of Bangladesh», Fundam Appl Agric, vol. 4, no 1, p. 632, 2019, |
| [3] | N. Kura, M. Ramli, W. Sulaiman, S. Ibrahim, A. Aris, et A. Mustapha, «Evaluation of Factors Influencing the Groundwater Chemistry in a Small Tropical Island of Malaysia», IJERPH, vol. 10, no 5, p. 1861-1881, mai 2013, |
| [4] | P. J. Sajil Kumar, L. Elango, et E. J. James, «Assessment of hydrochemistry and groundwater quality in the coastal area of South Chennai, India», Arab J Geosci, vol. 7, no 7, p. 2641-2653, juill. 2014, |
| [5] | N. Subba Rao, «Seasonal variation of groundwater quality in a part of Guntur District, Andhra Pradesh, India», Environ Geol, vol. 49, no 3, p. 413-429, janv. 2006, |
| [6] | S. Varol et A. Davraz, «Assessment of geochemistry and hydrogeochemical processes in groundwater of the Tefenni plain (Burdur/Turkey)», Environ Earth Sci, vol. 71, no 11, p. 4657-4673, juin 2014, |
| [7] | V. Amiri, N. Sohrabi, et M. A. Dadgar, «Evaluation of groundwater chemistry and its suitability for drinking and agricultural uses in the Lenjanat plain, central Iran», Environ Earth Sci, vol. 74, no 7, p. 6163-6176, oct. 2015, |
| [8] | T. Kaur, R. Bhardwaj, et S. Arora, «Assessment of groundwater quality for drinking and irrigation purposes using hydrochemical studies in Malwa region, southwestern part of Punjab, India», Appl Water Sci, vol. 7, no 6, p. 3301-3316, oct. 2017, |
| [9] | M. Kumar, K. Kumari, Al. Ramanathan, et R. Saxena, «A comparative evaluation of groundwater suitability for irrigation and drinking purposes in two intensively cultivated districts of Punjab, India», Environ Geol, vol. 53, no 3, p. 553-574, oct. 2007, |
| [10] | P. Li, J. Wu, et H. Qian, «Assessment of groundwater quality for irrigation purposes and identification of hydrogeochemical evolution mechanisms in Pengyang County, China», Environ Earth Sci, vol. 69, no 7, p. 2211-2225, août 2013, |
| [11] | D. A. Sharma, M. S. Rishi, et T. Keesari, «Evaluation of groundwater quality and suitability for irrigation and drinking purposes in southwest Punjab, India using hydrochemical approach», Appl Water Sci, vol. 7, no 6, p. 3137-3150, oct. 2017, |
| [12] |
ANDS, «Economic and social situation of the region of Diourbel », Ntional Agency for Statistics and Demography, Diourbel, Economic and social situation of the region, 2023. Available on:
https://www.ansd.sn/sites/default/files/2025-07/SES-Diourbel_2022-2023.pdf |
| [13] | ANSD, «Economic and social situation of the region of Diourbel», National Agency for Statistics and Demography, Diourbel, Rapport définitif, 2013. Available on: |
| [14] |
ANSD, «Economic and social situation of the region of Diourbel», National Agency for Statistics and Demography, Diourbel, Economic and social situation of the region, 2014.. Available on:
https://www.ansd.sn/sites/default/files/2022-11/SES-Diourbel_%202014.pdf |
| [15] | B. Sarr, «Contribution to the hydrogeological study of aquifers in the western Senegal basin», 'These of the 3rd cycle in geology (Mention Hydrogeology), UCAD, Department of Geology, 2000. |
| [16] | M. M. Diaw, Evaluation of the potentialities of superficial and intermediate aquifers in the region of Diourbel with a view to dilution and/or transfer into the groundnut basin», Department of Geology/UCAD, 2018. |
| [17] | A. W. Hounslow, Water Quality Data: Analysis and Interpretation, 1re éd. CRC Press, 2018. |
| [18] | S. Selvam, «Irrigational Feasibility of Groundwater and Evaluation of Hydrochemistry Facies in the SIPCOT Industrial Area, South Tamilnadu, India: A GIS Approach», Water Qual Expo Health, vol. 7, no 3, p. 265-284, sept. 2015, |
| [19] | D. Marghade, D. B. Malpe, et A. B. Zade, «Geochemical characterization of groundwater from northeastern part of Nagpur urban, Central India», Environ Earth Sci, vol. 62, no 7, p. 1419-1430, avr. 2011, |
| [20] | Md. M. Islam et al., «Environmental Study on a Coastal River of Bangladesh with Reference to Irrigation Water Quality Assessment: A Case Study on Shailmari River, Khulna», GEP, vol. 04, no 10, p. 41-64, 2016, |
| [21] | M. Youssef, M. Ahmed, et S. Mohamed, «Application of DrinkingWwater Quality Index for Assessing Groundwater Quality of The Quaternary Aquifer in El-Marashda Area, Qena, Egypt», Journal of Environmental Studies and Researches, vol. 11, no 2, p. 315-322, juin 2021, |
| [22] | N. Adimalla, R. Dhakate, A. Kasarla, et A. K. Taloor, «Appraisal of groundwater quality for drinking and irrigation purposes in Central Telangana, India», Groundwater for Sustainable Development, vol. 10, p. 100334, avr. 2020, |
| [23] | S. Deepa et S. Venkateswaran, «Appraisal of groundwater quality in upper Manimuktha sub basin, Vellar river, Tamil Nadu, India by using Water Quality Index (WQI) and multivariate statistical techniques», Model. Earth Syst. Environ., vol. 4, no 3, p. 1165-1180, sept. 2018, |
| [24] | S. Gopinath, K. Srinivasamoorthy, K. Saravanan, R. Prakash, et D. Karunanidhi, «Characterizing groundwater quality and seawater intrusion in coastal aquifers of Nagapattinam and Karaikal, South India using hydrogeochemistry and modeling techniques», Human and Ecological Risk Assessment: An International Journal, vol. 25, no 1-2, p. 314-334, févr. 2019, |
| [25] | C. R. Ramakrishnaiah, C. Sadashivaiah, et G. Ranganna, «Assessment of Water Quality Index for the Groundwater in Tumkur Taluk, Karnataka State, India», Journal of Chemistry, vol. 6, no 2, p. 523-530, janv. 2009, |
| [26] | M. A. Talib, Z. Tang, A. Shahab, J. Siddique, M. Faheem, et M. Fatima, «Hydrogeochemical Characterization and Suitability Assessment of Groundwater: A Case Study in Central Sindh, Pakistan», IJERPH, vol. 16, no 5, p. 886, mars 2019, |
| [27] | M. Vasanthavigar et al., «Application of water quality index for groundwater quality assessment: Thirumanimuttar sub-basin, Tamilnadu, India», Environ Monit Assess, vol. 171, no 1-4, p. 595-609, déc. 2010, |
| [28] | World Health Organization, Éd., Guidelines for drinking-water quality, 4th ed. Geneva: World Health Organization, 2011. |
| [29] | M. Diedhiou, S. Ndoye, H. Celle, S. Faye, S. Wohnlich, et P. Le Coustumer, «Hydrogeochemical Appraisal of Groundwater Quality and Its Suitability for Drinking and Irrigation Purposes in the West Central Senegal», Water, vol. 15, no 9, p. 1772, mai 2023, |
| [30] | E. Y. T. Benam-Beltoungou, I. Bassene, H. C. Emvoutou, K. V. Akpataku, D. M. L. Diongue, et S. Faye, «Groundwater quality assessed using water quality indices and geostatistical methods in the Thiaroye aquifer, Senegal», Water Science, vol. 39, no 1, p. 151-170, déc. 2025, |
| [31] | K. Arumugam et K. Elangovan, «Hydrochemical characteristics and groundwater quality assessment in Tirupur Region, Coimbatore District, Tamil Nadu, India», Environ Geol, vol. 58, no 7, p. 1509, oct. 2009, |
| [32] | L. V. Wilcox, Classification and Use of Irrigation Waters, U.S. Department of Agriculture, 1955. Universite de l’Illinois à Urbana-Champaign: United States. Department of Agriculture, 1955. [En ligne]. Disponible sur: |
| [33] | L. A. Richards, « Diagnosis and Improvement of Saline and Alkali Soils »:, Soil Science, vol. 78, no 2, p. 154, août 1954, |
| [34] | L. D. Doneen, «Water Quality for Irrigated Agriculture», in Plants in Saline Environments, vol. 15, A. Poljakoff-Mayber et J. Gale, Éd., in Ecological Studies, vol. 15., Berlin, Heidelberg: Springer Berlin Heidelberg, 1975, p. 56-76. |
| [35] | W. P. Kelley, «USE OF SALINE IRRIGATION WATER»:, Soil Science, vol. 95, no 6, p. 385-391, juin 1963, |
| [36] | K. V. Palliwal, «Irrigation with saline water», in Monograph, New Delhi, 1972, p. 198. |
| [37] | G. Castany, Principles and methods of hydrogeology, DUNOD. PARIS. Paris, 1982. |
| [38] | R. Aravena, M. Auge, N. Bucich, et M. Nagy, «Evaluation of the origin of groundwater nitrate in the city of La Plata—Argentina, using isotope techniques», in In Proceeding XXIX IAH Congress, Bratislava, September 6–10, 2002. |
| [39] |
J. Chippaux, S. Houssier, P. Gross, C. Bouvier, et F. Brissaud, «Study of groundwater pollution in the city of Niamey, Niger» Bulletin de la Société de Pathologie Exotique, p. 119-123, 2002. Available on:
https://horizon.documentation.ird.fr/exl-doc/pleins_textes/divers12-10/010029229.pdf |
| [40] | J. Groen, J. B. Schuchmann, et W. Geirnaert, «The occurence of high nitrate concentration in groundwater in villages in Northwestern Burkina Faso», Journal of African Earth Sciences (and the Middle East), vol. 7, no 7-8, p. 999-1009, janv. 1988, |
| [41] | C. N. Rivers, M. H. Barrett, K. M. Hiscock, P. F. Dennis, N. A. Feast, et D. N. Lerner, «Use Of Nitrogen Isotopes To Identify Nitrogen Contamination Of The Sherwood Sandstone Aquifer Beneath The City Of Nottingham, United Kingdom», HYJO, vol. 4, no 1, p. 90-102, janv. 1996, |
| [42] |
K. Voudouris, A. Panagopoulos, et I. Koumantakis, «Nitrate pollution in the coastal aquifer system of the korinthos prefecture (greece)», Global Nest: the Int. J., p. 31-38, 2004. [En ligne]. Disponible sur:
https://journal.gnest.org/sites/default/files/Journal%20Papers/voudouris.pdf |
| [43] | Y. J. C. Bellion, «Post-paleozoic geodynamic history of West Africa according to the study of some sedimentary basins (Senegal, Taoudenni, Iullemmeden, Chad)», Thesis, University of Avignon and Vaucluse countries, France, 1987. |
| [44] | C. Sawyer, Chemistry for Sanitary Engineers, 2e éd. Universite du Michigan: McGraw-Hill, 1967, 1967. [En ligne]. Disponible sur: |
| [45] | WHO, «Guidelines for drinking-water quality. 1: Recommendations», 3. ed., Geneva: World Health Organization, 2009. |
| [46] | R. A. Freeze et J. A. Cherry, Groundwater. Englewood Cliffs, N. J: Prentice-Hall, 1979. |
| [47] | P. Sahu et P. K. Sikdar, «Hydrochemical framework of the aquifer in and around East Kolkata Wetlands, West Bengal, India», Environ Geol, vol. 55, no 4, p. 823-835, août 2008, |
| [48] | S. Krishna Kumar, A. Logeshkumaran, N. S. Magesh, P. S. Godson, et N. Chandrasekar, «Hydro-geochemistry and application of water quality index (WQI) for groundwater quality assessment, Anna Nagar, part of Chennai City, Tamil Nadu, India», Appl Water Sci, vol. 5, no 4, p. 335-343, 2015, |
| [49] | A. Nagaraju, A. Thejaswi, et Z. Sharifi, «Assessment of groundwater quality and its suitability for agricultural usage in and around Rangampeta area, Andhra Pradesh, south India», J. Water Chem. Technol., vol. 38, no 6, p. 358-365, nov. 2016, |
APA Style
Diaw, M. M., Diedhiou, M., Diouf, O. C., Diaw, M., Faye, S. (2026). Groundwater Quality Assessment and Its Suitability for Drinking and Irrigation Purposes in the Eocene Aquifer of Diourbel-center Senegal. American Journal of Water Science and Engineering, 12(1), 13-26. https://doi.org/10.11648/j.ajwse.20261201.12
ACS Style
Diaw, M. M.; Diedhiou, M.; Diouf, O. C.; Diaw, M.; Faye, S. Groundwater Quality Assessment and Its Suitability for Drinking and Irrigation Purposes in the Eocene Aquifer of Diourbel-center Senegal. Am. J. Water Sci. Eng. 2026, 12(1), 13-26. doi: 10.11648/j.ajwse.20261201.12
@article{10.11648/j.ajwse.20261201.12,
  author = {Mouhamet Moustapha Diaw and Mathias Diedhiou and Ousmane Coly Diouf and Moctar Diaw and Serigne Faye},
  title = {Groundwater Quality Assessment and Its Suitability for Drinking and Irrigation Purposes in the Eocene Aquifer of Diourbel-center Senegal},
  journal = {American Journal of Water Science and Engineering},
  volume = {12},
  number = {1},
  pages = {13-26},
  doi = {10.11648/j.ajwse.20261201.12},
  url = {https://doi.org/10.11648/j.ajwse.20261201.12},
  eprint = {https://article.sciencepublishinggroup.com/pdf/10.11648.j.ajwse.20261201.12},
  abstract = {Water resource availability in quantity and quality is a primary factor which influences the development of various human activities worldwide. In most countries in Africa, due to the scarcity and poor quality of surface water, groundwater is the main natural resource used to relieve the increasing water demands of population. In Diourbel region (central Senegal), groundwater is an important resource used for economic activities. This study aims to evaluate groundwater quality and suitability for drinking and irrigation purposes. Thirty-seven (37) samples (boreholes and dug wells) were collected and major ions were analyzed. Classification of groundwater using TDS (Total Dissolved Solids) and TH (Total Hardness) showed respectively that 81.08% fall in the fresh water type, suggesting suitability for drinking water purpose. Moreover, most of groundwater samples fall in hard (21.62%) and very hard (75.68%) category of water. Furthermore, the computed values of WQI indicate majority of groundwater samples (76%) falls under good to excellent water, suggesting that the groundwater is suitable for drinking and other domestic uses. Data Wilcox and US Salinity Laboratory (USSL) plots show that the majority of groundwater samples are suitable for irrigation.% N, SAR, KR, PI, and RSC show that groundwater samples are suitable for irrigation except MR (Magnesium Ratio). This study shows a good quality of groundwater for consumption and irrigation purposes and thus contributes to the rural and urban development of the study area where the most productive aquifer is limited by the presence of brackish water.},
 year = {2026}
}
TY  - JOUR
T1  - Groundwater Quality Assessment and Its Suitability for Drinking and Irrigation Purposes in the Eocene Aquifer of Diourbel-center Senegal
AU  - Mouhamet Moustapha Diaw
AU  - Mathias Diedhiou
AU  - Ousmane Coly Diouf
AU  - Moctar Diaw
AU  - Serigne Faye
Y1  - 2026/03/10
PY  - 2026
N1  - https://doi.org/10.11648/j.ajwse.20261201.12
DO  - 10.11648/j.ajwse.20261201.12
T2  - American Journal of Water Science and Engineering
JF  - American Journal of Water Science and Engineering
JO  - American Journal of Water Science and Engineering
SP  - 13
EP  - 26
PB  - Science Publishing Group
SN  - 2575-1875
UR  - https://doi.org/10.11648/j.ajwse.20261201.12
AB  - Water resource availability in quantity and quality is a primary factor which influences the development of various human activities worldwide. In most countries in Africa, due to the scarcity and poor quality of surface water, groundwater is the main natural resource used to relieve the increasing water demands of population. In Diourbel region (central Senegal), groundwater is an important resource used for economic activities. This study aims to evaluate groundwater quality and suitability for drinking and irrigation purposes. Thirty-seven (37) samples (boreholes and dug wells) were collected and major ions were analyzed. Classification of groundwater using TDS (Total Dissolved Solids) and TH (Total Hardness) showed respectively that 81.08% fall in the fresh water type, suggesting suitability for drinking water purpose. Moreover, most of groundwater samples fall in hard (21.62%) and very hard (75.68%) category of water. Furthermore, the computed values of WQI indicate majority of groundwater samples (76%) falls under good to excellent water, suggesting that the groundwater is suitable for drinking and other domestic uses. Data Wilcox and US Salinity Laboratory (USSL) plots show that the majority of groundwater samples are suitable for irrigation.% N, SAR, KR, PI, and RSC show that groundwater samples are suitable for irrigation except MR (Magnesium Ratio). This study shows a good quality of groundwater for consumption and irrigation purposes and thus contributes to the rural and urban development of the study area where the most productive aquifer is limited by the presence of brackish water.
VL  - 12
IS  - 1
ER  -
Geology Department, Cheikh Anta Diop University of Dakar, Dakar, Senegal
Geology Department, Cheikh Anta Diop University of Dakar, Dakar, Senegal
Geology Department, Cheikh Anta Diop University of Dakar, Dakar, Senegal
Geology Department, Cheikh Anta Diop University of Dakar, Dakar, Senegal
Geology Department, Cheikh Anta Diop University of Dakar, Dakar, Senegal
Information