Abstract
Standardized diets for laboratory rodents become increasingly important. Dietary imbalances can negatively impact experimental outcomes. Commercially available diets often include ingredients that cannot be experimentally manipulated and may not meet all nutritional and experimental requirements. Current growth and maintenance diets for experimental animals are regulated by the American Institute for Nutrition (AIN). In our laboratory, we developed a diet based on egg-white protein (EWP) using endogenous ingredients that are safe for experimental rats and can be experimentally manipulated according to AIN standards. Therefore, this study aims to test and validate the nutritional quality of the EWP diet for the Dahl-SS rat strain, which is known to be nutrient-sensitive and genetically predisposed to develop hypertension. 14 pairs of Dahl-SS rats (14 females and 14 males) were used for mating. The rats were randomly divided into two groups: 7 pairs were fed a commercial standard diet, and the other 7 pairs were fed an EWP diet. From here, 10 pregnant rats (5 from each group), 14 weeks of age, and 1 week of gestation, were selected for the study and were fed their respective diets. The offspring were weighed at birth and weaned at 4 weeks of age. Five pups were randomly selected from each group (standard diet group and EWP diet group) and continued with their mother’s respective diets for an additional 6 weeks. During the study they were subjected to Biological (clinical-behavioral status, metabolic analysis, relative organ-weight), Biochemical (mineral analysis, hemogram, protein analysis) and Physiological parameters analysis (Blood Pressure determination, enzymatic activity of Na+ and Na/K+ pump in renal cortex). To complete analysis of the different parameters, at 10 weeks, the rats were sacrificed by exsanguination via cardiac puncture under intraperitoneal anesthesia with thiopental sodium (20-25 mg/kg). Blood was collected in heparinized and centrifuged tubes at 3500 g for 10 minutes at 4°C. Plasma was separated and stored at -20°C until analysis. The kidneys, heart, spleen, and liver were collected and weighed. Dahl-SS rats fed the EWP diet showed normal behavioral, motor and metabolic values, faster and greater body weight gain, blood and urine biochemistry values within normal range, stable blood pressure, normal enzyme activity, and adequate kidney function in comparison to the rats fed the standard diet. According to the parameters assessed, it was possible to conclude that the EWP diet has proven to be a suitable option for supporting maintenance, growth, and blood pressure regulation in Dahl-SS rats.
|
Published in
|
Animal and Veterinary Sciences (Volume 13, Issue 2)
|
|
DOI
|
10.11648/j.avs.20251302.11
|
|
Page(s)
|
31-44 |
|
Creative Commons
|

This is an Open Access article, distributed under the terms of the Creative Commons Attribution 4.0 International License (http://creativecommons.org/licenses/by/4.0/), which permits unrestricted use, distribution and reproduction in any medium or format, provided the original work is properly cited.
|
|
Copyright
|
Copyright © The Author(s), 2025. Published by Science Publishing Group
|
Keywords
Dahl SS Rats, Semi-Purified Diet, Egg-White Protein, Blood Pressure
1. Introduction
As scientific research advances, the need for standardized diets for laboratory rodents becomes increasingly important. Diets used for growth and maintenance are critical for the proper execution of experiments, the interpretation of results, and the reproducibility of studies.
Current growth and maintenance diets for experimental animals are regulated by the American Institute for Nutrition (AIN) based on the premise that nutrient requirements vary according to developmental stage, reproductive activity, age, physiological state, and experimental treatment. There is also evidence
| [1] | Reeves PG. Components of the AIN-93 diets as improvements in the AIN-76A diet. J Nutr. 1997, 127(5 Suppl), 838S-841S. https://doi.org/10.1093/jn/127.5.838S |
| [2] | Reeves PG, Rossow KL, Lindlauf J. Development and testing of the AIN-93 purified diets for rodents: results on growth, kidney calcification and bone mineralization in rats and mice. J Nutr. 1993, 123(11), 1923-1931. https://doi.org/10.1093/jn/123.11.1923 |
[1, 2]
of differences in nutrient requirements among various inbred and outbred strains, such as salt-sensitive Sprague-Dawley, Wistar, Spontaneously hypertensive (SHR), and Dahl Salt-Sensitive (Dahl-SS) Rats
| [3] | Dasinger JH, Fehrenbach DJ, Abais-Battad JM. Dietary Protein: Mechanisms Influencing Hypertension and Renal Disease. Curr Hypertens Rep. 2020, 22(2), 13. Epub 20200203. https://doi.org/10.1007/s11906-020-1018-8 |
[3]
.
Dahl-SS rats are genetically predisposed to developing essential hypertension (EHT) due to congenital renal disorders
they serve as a biologically complex model widely used in clinical and biological experiments to study salt-sensitive hypertension
| [5] | Rondon LJ, Marcano E, Rodriguez F, del Castillo JR. Blood pressure, magnesium and other mineral balance in two rat models of salt-sensitive, induced hypertension: effects of a non-peptide angiotensin II receptor type 1 antagonist. Magnes Res. 2014, 27(3), 113-130. https://doi.org/10.1684/mrh.2014.0368 |
| [6] | Sterzel RB, Luft FC, Gao Y, Schnermann J, Briggs JP, Ganten D, et al. Renal disease and the development of hypertension in salt-sensitive Dahl rats. Kidney Int. 1988, 33(6), 1119-1129. https://doi.org/10.1038/ki.1988.120 |
[5, 6]
. These animals are also susceptible to nutrient modulation.
| [1] | Reeves PG. Components of the AIN-93 diets as improvements in the AIN-76A diet. J Nutr. 1997, 127(5 Suppl), 838S-841S. https://doi.org/10.1093/jn/127.5.838S |
| [3] | Dasinger JH, Fehrenbach DJ, Abais-Battad JM. Dietary Protein: Mechanisms Influencing Hypertension and Renal Disease. Curr Hypertens Rep. 2020, 22(2), 13. Epub 20200203. https://doi.org/10.1007/s11906-020-1018-8 |
| [7] | De Miguel C, Lund H, Mattson DL. High dietary protein exacerbates hypertension and renal damage in Dahl SS rats by increasing infiltrating immune cells in the kidney. Hypertension. 2011, 57(2), 269-274. Epub 20101220. https://doi.org/10.1161/HYPERTENSIONAHA.110.154302 |
[1, 3, 7].
A macro- and/or micronutrient imbalanced diet may affect the organism, leading to kidney damage
, blood pressure alterations
| [9] | Mattson DL, Meister CJ, Marcelle ML. Dietary protein source determines the degree of hypertension and renal disease in the Dahl salt-sensitive rat. Hypertension. 2005, 45(4), 736-741. Epub 20050207. https://doi.org/10.1161/01.HYP.0000153318.74544.cc |
[9]
, and direct effects on renal electrolyte and water transport
| [10] | Kwon TH, Nielsen J, Kim YH, Knepper MA, Frokiaer J, Nielsen S. Regulation of sodium transporters in the thick ascending limb of rat kidney: response to angiotensin II. Am J Physiol Renal Physiol. 2003, 285(1), F152-165. Epub 20030325. https://doi.org/10.1152/ajprenal.00307.2002 |
[10]
. Commercially available "standard" diets offer limited experimental modulation compared to those formulated in a laboratory
| [11] | González-Infante G, Del Castillo, J. R., Herrera, F., Aguiar, G., Marcano, E., Rondón, L. J. Desarrollo clínico-biológico de ratas alimentadas con dieta semi-purificada a base de clara de huevo. Rev Inv Vet Perú. 2021, 32(4), e19438. |
[11]
.
In our laboratory, we developed a diet based on egg-white protein (EWP) using endogenous ingredients that are safe for experimental rats. This diet aims to improve their nutritional status and serves as an adequate alternative for experimental animals
| [11] | González-Infante G, Del Castillo, J. R., Herrera, F., Aguiar, G., Marcano, E., Rondón, L. J. Desarrollo clínico-biológico de ratas alimentadas con dieta semi-purificada a base de clara de huevo. Rev Inv Vet Perú. 2021, 32(4), e19438. |
[11]
. It can also be experimentally manipulated according to AIN standards. This diet has demonstrated optimal and healthy development without causing damage or suffering in Sprague-Dawley rats
| [11] | González-Infante G, Del Castillo, J. R., Herrera, F., Aguiar, G., Marcano, E., Rondón, L. J. Desarrollo clínico-biológico de ratas alimentadas con dieta semi-purificada a base de clara de huevo. Rev Inv Vet Perú. 2021, 32(4), e19438. |
[11]
. Therefore, this study aims to test and validate the nutritional quality of the EWP diet for the Dahl-SS rat strain, which is known to be nutrient-sensitive and genetically predisposed to develop hypertension
| [4] | Bashyam H. Lewis Dahl and the genetics of salt-induced hypertension. J Exp Med. 2007, 204(7), 1507. https://doi.org/10.1084/jem.2047fta |
| [5] | Rondon LJ, Marcano E, Rodriguez F, del Castillo JR. Blood pressure, magnesium and other mineral balance in two rat models of salt-sensitive, induced hypertension: effects of a non-peptide angiotensin II receptor type 1 antagonist. Magnes Res. 2014, 27(3), 113-130. https://doi.org/10.1684/mrh.2014.0368 |
| [6] | Sterzel RB, Luft FC, Gao Y, Schnermann J, Briggs JP, Ganten D, et al. Renal disease and the development of hypertension in salt-sensitive Dahl rats. Kidney Int. 1988, 33(6), 1119-1129. https://doi.org/10.1038/ki.1988.120 |
[4-6]
.
2. Materials and Methods
2.1. Diet and Animals
The diet was formulated based on EWP with endogenous ingredients, following the research study by González-Infante
et al. | [11] | González-Infante G, Del Castillo, J. R., Herrera, F., Aguiar, G., Marcano, E., Rondón, L. J. Desarrollo clínico-biológico de ratas alimentadas con dieta semi-purificada a base de clara de huevo. Rev Inv Vet Perú. 2021, 32(4), e19438. |
[11]
and the AIN guidelines for energy requirements in growing rats (AIN-93G and AIN-93M)
| [1] | Reeves PG. Components of the AIN-93 diets as improvements in the AIN-76A diet. J Nutr. 1997, 127(5 Suppl), 838S-841S. https://doi.org/10.1093/jn/127.5.838S |
| [2] | Reeves PG, Rossow KL, Lindlauf J. Development and testing of the AIN-93 purified diets for rodents: results on growth, kidney calcification and bone mineralization in rats and mice. J Nutr. 1993, 123(11), 1923-1931. https://doi.org/10.1093/jn/123.11.1923 |
[1, 2]
. The commercially available diet for the standard group was PROTINAL® chow.
2.1.1. Proximal Analysis
The chemical composition of the diets was determined using standard methods set forth by the Official Association of Agricultural Chemists (A.O.A.C.)
| [12] | Horwitz W, Latimer GW, editors. Official methods of analysis of AOAC International2010. |
[12]
. Total carbohydrate content was calculated by difference from the total dry weight, and mineral content was determined using the methods described in the literature
| [13] | Windsor DL, Denton, M. B. Evaluation of Inductively Coupled Plasma Optical Emission Spectrometry as a Method for the Elemental Analysis of Organic Compounds. Applied Spectroscopy. 1978, 32(4), 366-371. https://doi.org/10.1366/000370278774331134 |
[13]
.
2.1.2. Animals
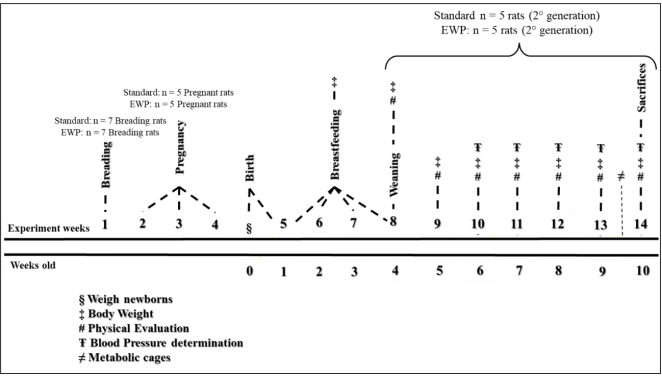
Figure 1. Experiment protocol.
The inbred Dahl-SS rats were obtained from our colony in the Bioterium of the Center for Biophysics and Biochemistry at the Venezuelan Institute for Scientific Research (IVIC). They were initially purchased from Charles River Laboratories. The rats were kept with food and water ad libitum until their sacrifice and were housed in temperature-controlled rooms (22°C) with a 12: 12 h light-dark cycle.
As indicated in
Figure 1, 14 pairs of Dahl-SS rats (14 females and 14 males) were used for mating. The rats were randomly divided into two groups: 7 pairs were fed a commercial standard diet, and the other 7 pairs were fed an EWP diet. Subsequently, 10 pregnant rats (5 from each group), 14 weeks of age, and 1 week of gestation, were selected for the study.
The pregnant rats were separated from the male rats after confirming pregnancy and housed individually in plexiglass cages. During pregnancy and lactation, they were fed their respective diets. The offspring were weighed at birth and weaned at 4 weeks of age. Immediately after weaning, five pups were selected from each group (standard diet group and EWP diet group). Both groups were fed their respective diets for an additional 6 weeks. Body weight (BW) was recorded daily during lactation and weekly for the remainder of the experiment. For urine and feces sample collection, the rats were placed in metabolic cages for 48 hours at 9 weeks of age. At 10 weeks, the rats were sacrificed by exsanguination via cardiac puncture under intraperitoneal anesthesia with thiopental sodium (20-25 mg/kg). Blood was collected in heparinized and centrifuged tubes at 3500 g for 10 minutes at 4°C. Plasma was separated and stored at -20°C until analysis. The kidneys, heart, spleen, and liver were collected and weighed.
The rats were handled according to the recommendations of the IVIC Bioethics Committee and in compliance with Council Directive 86/609/EEC regarding the protection of animals used for experimental and other scientific purposes.
2.2. Biological Parameters
2.2.1. Clinical-behavioral Status
(i). Clinical Evaluation
Physical and clinical signs were examined daily, and an observation instrument was filled
| [14] | Morton DB, Griffiths PH. Guidelines on the recognition of pain, distress and discomfort in experimental animals and an hypothesis for assessment. Vet Rec. 1985, 116(16), 431-436. https://doi.org/10.1136/vr.116.16.431 |
[14]
where the animals were qualitatively categorized as "normal," "continuous monitoring", "treatment change," or "stop experiment" based on the physical signs exhibited. The results were statistically analyzed using the Kolmogorov-Smirnov test.
(ii). Motricity
As it was described previously by our Laboratory
| [11] | González-Infante G, Del Castillo, J. R., Herrera, F., Aguiar, G., Marcano, E., Rondón, L. J. Desarrollo clínico-biológico de ratas alimentadas con dieta semi-purificada a base de clara de huevo. Rev Inv Vet Perú. 2021, 32(4), e19438. |
[11]
The animals were placed in a transparent plexiglass cage and video-recorded using the Open Source Physics (OSP) Tracker Video Analysis software. The exploration period in the cage was standardized, ranging from 40 seconds to 2 minutes. During this time, the movements of each rat were quantified. The numerical data provided by Tracker was plotted using Microsoft Office Excel or GraphPad and compared with the graphs generated by Tracker. The number of movements made by the rats fed the EWP diet was compared to those fed the standard diet.
2.2.2. Metabolic Analysis
To measure food and water intake, urinary and fecal excretion, the groups were placed in TECNIPLAST standard metabolic cages for 48 hours. Water and food were provided ad libitum, and urine and feces samples were collected every 24 hours in volumetric vessels, also graded by TECNIPLAST. To determine the weight of the feces, they were weighed and dehydrated for 24 hours at 50 °C in a Thermo Fisher Heraterm™ 51028123 oven. Water balance was calculated by subtracting total output (urine + feces) from total intake (water consumed) and standardized by dividing it by body weight.
The percentage of excretion was determined by subtracting the output from the net water consumed (100%) to calculate the excreted percentage. These estimates do not include water losses of any other kind.
To determine the intake of calories, macronutrients, and minerals (aluminum (Al), barium (Ba), iron (Fe), copper (Cu), manganese (Mn), strontium (Sr), zinc (Zn), calcium (Ca), potassium (K), magnesium (Mg), sodium (Na), and phosphorus (P)), we used the following formulas:
Kcal intake = (Food intake in g * Kcal of diet) / 100g of food
Macronutrient intake = (Food intake in g * macronutrient content of diet in g) / 100g of food
Mineral intake = (Food intake in g * mineral content of diet in mg) / 1000g of food
Body Weight Growth:
The animals were weighed daily during lactation and weekly after weaning using a Körper EK3651 electronic scale.
2.2.3. Relative Organ Weight
After sacrificing the animals, we dissected and weighed their kidneys, heart, spleen, and liver
| [15] | Michael B, Yano B, Sellers RS, Perry R, Morton D, Roome N, et al. Evaluation of organ weights for rodent and non-rodent toxicity studies: a review of regulatory guidelines and a survey of current practices. Toxicol Pathol. 2007, 35(5), 742-750. https://doi.org/10.1080/01926230701595292 |
[15]
. The relative organ weight was calculated using the following formula:
Relative weight = organ weight / body weight
2.3. Biochemical Parameters
2.3.1. Mineral Analysis
Mineral content was determined using inductively coupled plasma-optical emission spectrometry (ICP-OES) PerkinElmer Optima 2100DV at different wavelengths: A) 396.2 nm, Ba 455.4 nm, Fe 238.2 nm, Cu 327.4 nm, Mn 257.6 nm, Sr 407.8 nm, Zn 206.2 nm, Ca 315.9 nm, K 766.5 nm, Mg 279.1 nm, Na 589.6 nm, and P 213.6 nm. This measurement was conducted according to the methods described in the literature
| [16] | Olivares EGB, Herrera FF, Aguiar G, Peña E, Ramos M, Méndez C. Comparación De La Nutrición Mineral De Los Helechos Cyathea aurea, C. delgadii, Dicranopteris flexuosa Y Pteridium arachnoideum en la Gran Sabana, Venezuela. Interciencia. 2016, 41, 273-283. |
[16]
.
2.3.2. Hemogram
Blood count was performed using conventional methods
| [17] | Acosta L, Rodríguez, P. Perfil Lipídico, Protéico y Glicemia en Ratas Sprague Dawley y Shr/N producidas en la UCLA. Venezuela. Gaceta de Ciencias Veterinaria. 2008, 111-125. |
| [18] | Blumenreich MS. The White Blood Cell and Differential Count. In: rd, Walker HK, Hall WD, Hurst JW, editors. Clinical Methods: The History, Physical, and Laboratory Examinations. Boston 1990. |
[17, 18]
,
with an ABX MICROS ES60 micro-sampling hematology analyzer to measure the levels of leukocytes (WBC), hemoglobin (HGB), red blood cells (RBC), hematocrit (HCT), mean corpuscular volume (MCV), mean corpuscular hemoglobin (MCH), mean corpuscular hemoglobin concentration (MCHC), red cell distribution width (RDW-CV, RDW-SD), platelet count (PLT), mean platelet volume (MPV), platelet distribution width (PDW), percentage of procalcitonin (PCT), and concentrations of glucose (GLU), cholesterol (COL), triglycerides (TRI), and very low-density lipoproteins (VLDL), prothrombin (PT), prothrombin time test (PTT).
2.3.3. Protein Analysis
Protein concentration in urine and plasma were determined using a Milton Roy Spectronic 1201 spectrophotometer with the Bradford technique
| [19] | Bradford MM. A rapid and sensitive method for the quantitation of microgram quantities of protein utilizing the principle of protein-dye binding. Anal Biochem. 1976, 72, 248-254. https://doi.org/10.1006/abio.1976.9999 |
[19]
.
Urinary protein excretion was calculated using the following formula:
Urinary protein excretion (%): ((Output(g(24h)) * 100) / input(g(24h))).
2.4. Physiological Parameters
2.4.1. Blood Pressure (BP) Determination
Indirect BP was measured in conscious animals at 5 weeks of age using tail-cuff plethysmography with a non-invasive BP/heart rate monitoring system (LE5002) and NIBPCHART V1.1 software for data collection, traceability, and validation (Panlab,
Harvard Aparatus, Barcelona, Spain), as described above
| [5] | Rondon LJ, Marcano E, Rodriguez F, del Castillo JR. Blood pressure, magnesium and other mineral balance in two rat models of salt-sensitive, induced hypertension: effects of a non-peptide angiotensin II receptor type 1 antagonist. Magnes Res. 2014, 27(3), 113-130. https://doi.org/10.1684/mrh.2014.0368 |
[5]
.
2.4.2. Enzymatic Activity of Na+ and Na+/K+ Pump in Renal Cortex
To prepare the basolateral plasma membrane, we harvested the renal cortex of rats and immediately isolated it, as described by Cariani et al., 2004
| [20] | Cariani L, Thomas L, Brito J, del Castillo JR. Bismuth citrate in the quantification of inorganic phosphate and its utility in the determination of membrane-bound phosphatases. Anal Biochem. 2004, 324(1), 79-83. https://doi.org/10.1016/j.ab.2003.09.008 |
| [21] | Del Castillo JR, Robinson JW. Na+-stimulated ATPase activities in basolateral plasma membranes from guinea-pig small intestinal epithelial cells. Biochim Biophys Acta. 1985, 812(2), 413-422. https://doi.org/10.1016/0005-2736(85)90316-5 |
[20, 21]
. We determined the ATPase activities as described previously and expressed them in nmol of phosphate liberated per mg of protein per minute
| [20] | Cariani L, Thomas L, Brito J, del Castillo JR. Bismuth citrate in the quantification of inorganic phosphate and its utility in the determination of membrane-bound phosphatases. Anal Biochem. 2004, 324(1), 79-83. https://doi.org/10.1016/j.ab.2003.09.008 |
| [21] | Del Castillo JR, Robinson JW. Na+-stimulated ATPase activities in basolateral plasma membranes from guinea-pig small intestinal epithelial cells. Biochim Biophys Acta. 1985, 812(2), 413-422. https://doi.org/10.1016/0005-2736(85)90316-5 |
[20, 21]
.
2.5. Statistical Analysis
Values are expressed as mean ± SEM. Differences between experimental groups were assessed using a two-way analysis of variance (ANOVA) followed by Tukey's test. The Kolmogorov-Smirnov test was applied for qualitative data analysis, and Pearson's correlation test was used for the variables. Differences were considered significant at p < 0.05. Data analysis was conducted using GraphPad Prism.
3. Results
3.1. Biological Parameters
3.1.1. Clinical-behavioral Status
(i). Clinical Evaluation
The animals were monitored daily for behavior and appearance according to the guidelines of Morton & Griffiths (1985). Both groups exhibited similar behavior, with no significant differences between them. Notably, no physical ailments or behavioral abnormalities were observed; all animals (5 out of 5 per group) were classified as "normal" (data not shown).
(ii). Motricity
Quantification of the steps performed by the rats and the time spent exploring the cage using Tracker showed similar movement speeds, with no statistically significant differences between groups: 0.013 ± 0.001 cm/s for the standard chow group and 0.014 ± 0.000 cm/s for the EWP chow group.
3.1.2. Metabolic Analysis
Table 1 shows the proximal and mineral analysis for diets, where the standard diet is the commercially available diet.
Table 1. Proximal and mineral analysis of AIN-93G, AIN-93M, standard and a non-purified Egg White Protein (EWP) diet.
Parameter | AIN-93G | AIN-93M | Standard | EWP |
Humidity (g/100 g) | 6.6 | 6.8 | 7.2 | 6.5 |
Ashes (g/100 g) | 4.2 | 3.9 | 7.2 | 4.2 |
Fat (g/100 g) | 7.0 | 4.0 | 4.1 | 5.8 |
Proteins (g/100 g) | 17.9 | 12.6 | 37.2 | 17.2 |
Total carbohydrates (g/100 g) | 64.4 | 72.7 | 44.4 | 66.4 |
Calories (Kcal) 100 g | 376.6 | 360.1 | 309.1 | 377.1 |
Fiber (%) | 5.0 | 5.0 | 13.51 | 2.25 |
Al | - | - | 130 ± 26 | 86 ± 1 |
Ba | - | - | 16.2 ± 0.5 | 4.6 ± 0.1 |
Fe | 45 | 45 | 667 ± 102 | 348 ± 35 |
Cu | 6 | 6 | 49 ± 1 | 17 ± 2 |
Mn | 10 | 10 | 86 ± 2 | 51 ± 1 |
Sr | - | - | 29.5 ± 0.2 | 18.8 ± 0.3 |
Zn | 38 | 35 | 575 ± 23 | 73 ± 1 |
Ca | 5,000 | 5,000 | 4,493 ± 72 | 3,610 ± 788 |
K | 3,600 | 3,600 | 5,906 ± 6 | 5,145 ± 546 |
Mg | 513 | 511 | 989 ± 72 | 723 ± 207 |
Na | 1,039 | 1,033 | 1,105 ± 64 | 2,547 ± 449 |
P | 3,000 | 3,000 | 2,667 ± 297 | 2,105 ± 447 |
Metabolic analysis of the animals at week 9 of age revealed statistically significant differences in feeding between the two groups (
Table 2). The EWP diet group exhibited lower food intake (-4.65 ± 1.18%), lower water consumption (-16.52 ± 3.55%), lower urinary excretion (-18.46 ± 3.11%), and lower dry feces weight (-56.60 ± 3.20%), with no variation in the percentage of fecal water excretion compared to the standard diet group. Meanwhile, the water excretion rate was significantly higher in the EWP diet roup +13.25 ± 3.01%), with no variation in water balance, which remained positive and close to 0 in both groups (
Table 2).
Table 2. Food Intake, water intake, urine excretion, water content in feces and dry weigh, water balance, water excretion, protein urine excretion and protein plasma concentration in feces in Dahl-SS rats fed a standard and a non-purified Egg White Protein (EWP) diet.
Parameter | Dahl-SS-Standard | Dahl-EWP |
Food intake (g (24 h)) | 19.56 ± 0.18 | 18.65 ± 0.22* |
Water intake (mL (24 h)) | 26.63 ± 0.29 | 22.23 ± 0.79*** |
Urine excretion (mL (24 h)) | 13.00 ± 0.82 | 10.60 ± 0.33* |
Dry weight feces (g) | 2.88 ± 0.14 | 1.25 ± 0.04*** |
Feces water content (%) | 56.59 ± 2.73 | 54.01 ± 1.18 |
Water excretion (%) | 56.66 ± 1.60 | 64.17 ±1.93** |
Water balance (mL) | 0.038 ± 0.001 | 0.036 ± 0.003 |
Values are expressed as mean ± SEM (n = 5 rats per group). Statistical analysis performed by t student test for unpaired data followed by F test to compare variances. ***p<0.001, **p<0.01, *p<0.05 vs. EWP diet compared to their littermates fed a standard chow diet.
Water balance (mL) = (Input (water intake) - Output (urine + feces))/BW. Water excretion (%) = (Output(mL)*100)/Input(mL)
Regarding nutrient intake (
Table 3), the EWP diet group showed a higher percentage of calories consumed (+19.69%), lower protein consumption (-56.99 ± 0.54%), and higher carbohydrate (+46.61 ± 5.66%) and fat (+37.80 ± 4.88%) intake, as well as lower consumption of Al (-39.08 ± 0.76%), Ba (-71.88 ± 0.00%), Fe (-50.74 ± 0.90%), Cu (-68.69 ± 1.01%), Mg (-31.04 ± 1.31%), Sr (-40.68 ± 0.00%), Zn (-88.16 ± 0.18%), Ca (-24.29 ± 1.03%), K (-18.84 ± 1.11%), Mg (-31.04 ± 1.31%), and P (-75.03 ± 2.31%) compared to the standard diet group. However, the EWP diet group showed a higher consumption of Na (+11.57 ± 2.96%) (
Table 3).
Table 3. Calories, Macronutrients, Micronutrients intake in Dahl-SS rats fed a standard and a non-purified Egg White Protein (EWP) diet.
Intakes | Dahl-SS-Standard | Dahl-EWP |
Food intake (g (24 h)) | 19.56 ± 0.18 | 18.65 ± 0.22* |
Calorie (Kcal) | 61.51 ± 0.80 | 73.62± 2.82*** |
Protein (g (24 h)) | 7.37 ± 0.05 | 3.17 ± 0.04*** |
Carbohydrate (g (24 h)) | 8.84 ± 0.11 | 12.96 ± 0.50*** |
Fat (g (24 h)) | 0.82 ± 0.01 | 1.13 ± 0.04*** |
Al (mg (24 h) | 2.61 ± 0.02 | 1.59 ± 0.02*** |
Ba (mg (24 h) | 0.32 ± 0.00 | 0.09 ± 0.00*** |
Fe (mg (24 h) | 13.34 ± 0.09 | 6.57 ± 0.12*** |
Cu (mg (24 h) | 0.99 ± 0.00 | 0.31 ± 0.01*** |
Mg (mg (24 h) | 19.78 ± 0.13 | 13.64 ± 0.26*** |
Sr (mg (24 h) | 0.59 ± 0.00 | 0.35 ± 0.00*** |
Zn (mg (24 h) | 11.40 ± 0.08 | 1.35 ± 0.02*** |
Ca (mg (24 h) | 88.01 ± 0.62 | 66.63 ± 0.91*** |
K (mg (24 h) | 117.02 ± 0.82 | 94.97 ± 1.30*** |
Mg (mg (24 h) | 19.78 ± 0.13 | 13.64 ± 0.26*** |
Na (mg (24 h) | 21.61 ± 0.20 | 47.02 ± 0.64*** |
P (mg (24 h) | 52.83 ± 0.37 | 43.19 ± 1.22*** |
Values are expressed as mean ± SEM (n = 5 rats per group). Statistical analysis performed by t student test for unpaired data followed by F test to compare variances. ***p<0.001, **p<0.01, *p<0.05 vs. EWP diet compared to their littermates fed a standard chow diet.
Intake in Kcal = (Food intake in g* diet calories)/100 g diet
Macronutrient intake = (Food intake in g* g macronutrient content in diet)/100 g diet
Mineral intake = (Food intake en g * mineral content in diet in mg)/1000 g of diet
3.1.3. Body Weight Growth
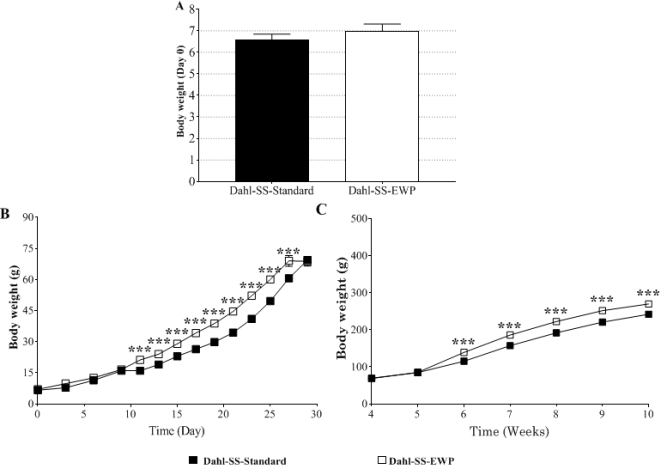
After comparing the BW of the pups at birth, we found no statistically significant differences between the dietary groups (
Figure 2). However, during lactation, significant differences began to emerge. The EWP diet group exhibited greater body weight gain from day 11 (+27.99 ± 0.93%) to day 27 of age (+12.27 ± 1.37%). At week 4, during weaning, we observed maintenance of body weight, with no significant differences between the groups until week 5. From week 6 (+20.52 ± 1.58%) until the end of the experiment (week 10), animals fed the EWP chow showed significant weight gain, resulting in an increase of +11.50 ± 0.77% compared to the standard chow group.
Figure 2. Body weight evolution in Dahl-SS rats fed a standard and a non-purified Egg White Protein (EWP) diet. Newborn (A), Breastfeeding (B), Weaning and growth (C). Values are expressed as means ± SEM in g (n = 5 for each group). Statistical analysis was performed using two-way ANOVA followed by Holm-Sidak comparison test. ***p<0.001 EWP diet compared to their littermates fed a standard chow diet.
3.1.4. Relative Organ Weight
The relative weight of the kidneys, heart, spleen, and liver were evaluated and corrected for the animal’s BW on the day of sacrifice. A statistically significant difference was observed in the weight of the kidneys (-4.49 ± 1.18%), heart (+7.32 ± 2.27%), and liver (+4.71 ± 1.43%) in rats fed the EWP diet compared to those fed the commercial standard chow. No statistically significant differences were observed in the spleen (
Table 4).
Table 4. Relative weight of Kidney, Heart, Spleen and Liver in Dahl salt sensitive (SS) and Sprague Dawley rats fed a standard and a non-purified Egg White Protein (EWP) diet.
Organ | Dahl-SS-Standard | Dahl-EWP |
Kidneys | 0.0089 ± 0.0001 | 0.0085 ± 0.0001* |
Heart | 0.0041 ± 0.0000 | 0.0044 ± 0.0001** |
Spleen | 0.0034 ± 0.0001 | 0.0035 ± 0.0001 |
Liver | 0.0467 ± 0.0004 | 0.0489 ± 0.0007* |
Values are expressed as mean ± SEM in g/Kg with n = 5. Statistical analysis performed by t student test for unpaired data. **p<0.01, *p<0.05 vs. EWP diet compared to their littermates fed a standard chow diet.
3.2. Biochemical Parameters
3.2.1. Plasma Mineral Analysis
After determining the mineral content in plasma, including Cu, Zn, Ca, K, Mg, Na, and P, no statistically significant differences were observed between the EWP diet group and the commercial standard diet group, except for plasma K. Plasma K was lower in the EWP diet-fed rats (-58.65 ± 7.27%) compared to the standard diet-fed rats (
Table 5).
Table 5. Plasma mineral concentration in Dahl-SS rats fed a standard and a non-purified Egg White Protein (EWP) diet.
Mineral | Dahl-SS-Standard | Dahl-EWP |
Cu (µg.mL) | 1.13 ± 0.14 | 1.06 ± 0.13 |
Zn (µg.mL) | 1.03 ± 0.24 | 1.04 ± 0.21 |
Ca (mmol.L) | 1.14 ± 0.45 | 1.15 ± 0.21 |
K (mmol.L) | 5.85 ± 0.54 | 2.42 ± 0.17** |
Mg (mmol.L) | 0.70 ± 0.41 | 0.89 ± 0.21 |
Na (mmol.L) | 94.45 ± 3.97 | 93.47 ± 1.47 |
P (mmol.L) | 4.18 ± 0.74 | 3.88 ± 0.42 |
Values are expressed as mean ± SEM (n=5). Statistical analysis performed by t student test for unpaired data. **p<0.01 vs. EWP diet compared to their littermates fed a standard chow diet.
3.2.2. Hemogram
As shown in
Table 6, blood analysis revealed statistical differences between the standard diet group and the EWP diet group in HCT (-8.08 ± 1.45%), MCV (-7.58 ± 1.27%), MCHC (+6.21 ± 0.14%), MPV (+9.13 ± 1.32%), PDW (+1.21 ± 0.33%), and PT) (+12.85 ± 2.09%). No significant differences were found between the groups for the other parameters evaluated in the hemogram.
Table 6. Biochemical analysis of blood samples in Dahl-SS rats fed a standard and a non-purified Egg White Protein (EWP) diet.
Parameter | Dahl-SS-Standard | Dahl-EWP |
WBC (μ) | 8,250 ± 1,063 | 8,750 ± 1,024 |
HGB (g/dL) | 16.03 ± 0.25 | 15.65 ± 0.23 |
RBC (μ) | 6,937,500 ± 61,560 | 6,900,000 ± 94,692 |
HCT (%) | 57.80 ± 0.88 | 53.13 ± 0.77** |
MCV (fL) | 83.40 ± 0.56 | 77.08 ± 0.98** |
MCH (pg) | 23.03 ± 0.18 | 22.65 ± 0.06 |
MCHC (g/dL) | 27.68 ± 0.05 | 29.40 ± 0.04** |
RDW-CV (%) | 15.88 ± 0.19 | 16.63 ± 0.36 |
RDW-SD (fL) | 35.15 ± 0.72 | 33.43 ± 1.21 |
PLT (μL) | 630,750 ± 18,967 | 696,750 ± 35,483 |
MPV (fL) | 10.40 ± 0.11 | 11.35 ± 0.15** |
PDW (%) | 14.85 ± 0.03 | 15.03 ± 0.05* |
GLU (mg/dL) | 167.50 ± 4.11 | 157.00 ± 8.72 |
COL (mg/dL) | 50.00 ± 3.49 | 51.50 ± 2.40 |
TRI (mg/dL) | 142.00 ± 16.58 | 144.74 ± 7.89 |
VLDL (mg/dL) | 28.55 ± 3.46 | 26.1 ± 3.47 |
PT (s) | 12.30 ± 0.49 | 13.88 ± 0.29* |
PTT (s) | 36.23 ± 10.05 | 35.78 ± 11.91 |
Values are expressed as mean ± SEM (n = 4 for each group). Statistical analysis performed by t student test for unpaired data. **p<0.01, *p<0.05 vs. EWP diet compared to their littermates fed a standard chow diet.
3.2.3. Protein Analysis
Based on the protein content of the diets and food consumption, we measured protein intake and excretion in the experimental groups and analyzed their plasma concentration. After analyzing the protein concentration in urinary and plasma samples using the Bradford method, we observed lower net urinary protein excretion in the EWP diet-fed group compared to the standard diet-fed group (-21.89 ± 3.74%) (
Table 7). However, when analyzing protein urine excretion in percentage, which considers Output and input in 24 h, the EWP diet group showed higher excretion (+81.39 ± 5.55%) compared to the standard diet group (
Table 7). We found no statistically significant differences in plasma protein concentration between the groups (
Table 7). Interestingly, only the EWP diet group exhibited a positive correlation between protein intake and urinary excretion (Pearson r = 0.78, p = 0.122). In contrast, the standard diet group did not show this correlation (Pearson r = 0.114, p = 0.855).
Table 7. Protein intake, protein analysis in blood samples and protein excretion in Dahl-SS rats fed a standard and a non-purified Egg White Protein (EWP) diet.
Parameter | Dahl-SS-Standard | Dahl-EWP |
Protein urine excretion (mg (24 h)) | 112.48 ± 4.68 | 87.86 ± 4.21*** |
Protein urine excretion (%) | 1.29 ± 0.07 | 2.34 ± 0.13*** |
Plasma protein concentration (mg.mL) | 57.03 ± 7.91 | 71.36 ± 4.16 |
Values are expressed as mean ± SEM (n = 5 for each group). Statistical analysis performed by t student test for unpaired data. ***<0.001 vs. EWP diet compared to their littermates fed a standard chow diet.
Protein urine excretion (%): ((Output(g (24 h))*100)/ input(g (24 h))
3.3. Physiological Parameters
3.3.1. Blood Pressure (BP) Determination
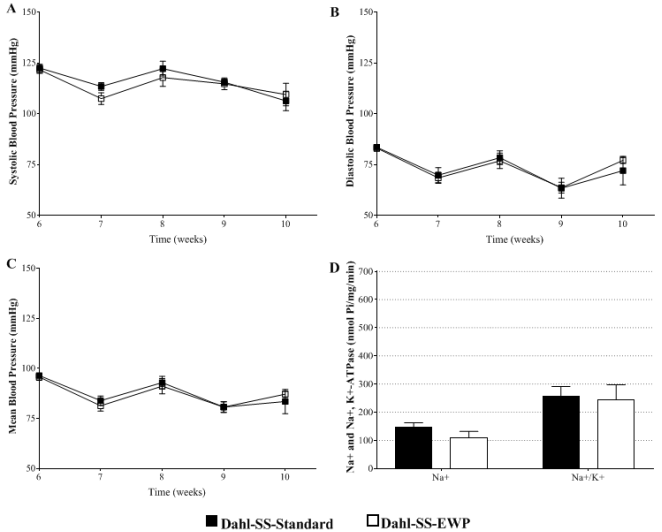
We recorded BP twice a week and found no statistically significant differences in systolic pressure (SP), diastolic pressure (DP), or mean pressure (MP) between the two groups (
Figure 3 a, b, c).
Figure 3. Physiological evaluation. Blood pressure in Dahl-SS rats fed a standard chow diet or a non-purified egg white protein (EWP) diet. Systolic pressure (A), diastolic pressure (B) and mean blood pressure (C). Values are expressed as means ± SEM in mmHg (n = 5 for each group). Sodium-Potassium and Sodium ATPase activity in renal cortex of Dahl-SS fed a standard chow diet or EWP diet (D). Values are expressed as means ± SEM in nmol Pi/mg/min (n = 3 for each group). Statistical analysis was performed using two-way ANOVA followed by Bonferroni's multiple comparisons test.
3.3.2. Enzymatic Activity of Na+ and Na+/K+ Pump in Renal Cortex
We harvested and weighed the kidneys on the last day of the experiment (at 10 weeks old). We immediately separated and processed the cortex membrane to determine the enzymatic activity of the Na
+ and Na
+, K
+ pumps in fresh samples. We observed no significant differences in Sodium-Potassium and Sodium ATPase activities between the two groups (
Figure 3d).
4. Discussion
This study demonstrates that the EWP diet accelerates growth and improves body weight in Dahl-SS rats while maintaining a normal biological, biochemical, and physiological state. Commercially available formulas for laboratory rodents differ primarily in their macronutrient concentrations (proteins, fats, carbohydrates). Although these diets provide a guaranteed analysis, listing ingredients and nutrients, they generally do not meet the parameters established by the AIN. Due to their constitution, these diets allow for minimal nutritional manipulation. Therefore, this study aims to develop and assess the nutritional quality of a diet adjusted to AIN recommendations, which can be fully manipulated and ensure optimal development for experimental animals, such as nutrient-sensitive and genetically predisposed rats.
During the experimental period, which included the feeding of parents, mating, gestation, birth of offspring, and lactation, we assessed three important parameters: biological, biochemical, and physiological.
Among the biological parameters, we studied clinical-behavioral status and motility. The animals were also evaluated within metabolic cages, and we monitored and analyzed their body weight and relative organ weight.
From both behavioral and motor perspectives, no significant differences were observed between rats fed the standard diet and those fed the EWP diet. This finding is consistent with previous observations in Sprague-Dawley rats in our laboratory and with results from other studies in literature
| [11] | González-Infante G, Del Castillo, J. R., Herrera, F., Aguiar, G., Marcano, E., Rondón, L. J. Desarrollo clínico-biológico de ratas alimentadas con dieta semi-purificada a base de clara de huevo. Rev Inv Vet Perú. 2021, 32(4), e19438. |
| [14] | Morton DB, Griffiths PH. Guidelines on the recognition of pain, distress and discomfort in experimental animals and an hypothesis for assessment. Vet Rec. 1985, 116(16), 431-436. https://doi.org/10.1136/vr.116.16.431 |
[11, 14]
.
We used the metabolic cage to evaluate food and water intake, as well as the excretion of metabolic wastes (urine and feces), fecal water content, water excretion rate, and water balance in rats fed the standard diet and the EWP diet. It also allowed us to determine the intake of calories, macronutrients, and micronutrients.
Food and water intake was significantly lower in the EWP diet-fed rats than in the standard diet-fed rats. This difference may be associated with the composition of the EWP diet, whose macronutrient distribution aligns with AIN recommendations, thereby providing more calories compared to the standard diet. The higher caloric consumption of the EWP diet results in lower feed intake due to satiety, which in turn leads to lower water intake
.
The literature suggests a regulatory mechanism for water intake linked to feeding. Specifically, with appropriate consumption of proteins, carbohydrates, and salts, the animal adjusts water intake through osmoregulatory mechanisms to maintain fluid balance and the correct volume of metabolic wastes (urine and feces) in accordance with food intake
| [22] | Fitzsimons TJ, Le Magnen J. Eating as a regulatory control of drinking in the rat. J Comp Physiol Psychol. 1969, 67(3), 273-283. https://doi.org/10.1037/h0026772 |
[22]
.
Regarding urine and feces excretion, the EWP diet group exhibited lower urine excretion and lower dry feces weight compared to the standard diet group. This result aligns with findings observed in our laboratory with Sprague-Dawley rats on the same diet regimen, which is directly related to the food and water intake of the animals
| [11] | González-Infante G, Del Castillo, J. R., Herrera, F., Aguiar, G., Marcano, E., Rondón, L. J. Desarrollo clínico-biológico de ratas alimentadas con dieta semi-purificada a base de clara de huevo. Rev Inv Vet Perú. 2021, 32(4), e19438. |
[11]
.
Although water intake is significantly lower in the EWP group, the water excretion rate is higher than in the standard diet group. It has been observed that, with
ad libitum drinking, lighter animals consume more water than heavier animals
| [24] | Holdstock TL. Body weight and water consumption in rats. Physiological Psychology 1973, 1(1), 21-23. |
[24]
. The reasons for this are not fully understood, but this negative relationship may explain our observation, as these rats did not exhibit any signs of dehydration.
It is important to note that the increased water excretion rate observed in our study was not associated with the dehydration process, as the rats maintained an adequate state, as indicated by their biological parameters. Furthermore, both groups exhibited positive water balance values close to 0, suggesting an adequate water balance and proper renal function
| [25] | Saínz Menéndez B, Balance hidromineral (BHM) Hydromineral balance (HMB) Revista Cubana de Cirugia. 2005, 44(4), 0-0(1). |
| [26] | Riebl SK, Davy BM. The Hydration Equation: Update on Water Balance and Cognitive Performance. ACSMs Health Fit J. 2013, 17(6), 21-28. https://doi.org/10.1249/FIT.0b013e3182a9570f |
| [27] | Cheuvront SN, Fraser CG, Kenefick RW, Ely BR, Sawka MN. Reference change values for monitoring dehydration. Clin Chem Lab Med. 2011, 49(6), 1033-1037. Epub 20110324. https://doi.org/10.1515/CCLM.2011.170 |
[25-27]
.
As expected, the analysis of calorie, macro, and micronutrient intake revealed that EWP diet-fed rats, despite consuming less food, had a higher intake of calories, carbohydrates, and fats, along with an adequate protein intake, compared to standard diet-fed rats.
Regarding micronutrient consumption, a lower but adequate intake was observed, except for Na
+. This outcome is consistent with the EWP diet, meeting the estimates published by the AIN
| [1] | Reeves PG. Components of the AIN-93 diets as improvements in the AIN-76A diet. J Nutr. 1997, 127(5 Suppl), 838S-841S. https://doi.org/10.1093/jn/127.5.838S |
| [2] | Reeves PG, Rossow KL, Lindlauf J. Development and testing of the AIN-93 purified diets for rodents: results on growth, kidney calcification and bone mineralization in rats and mice. J Nutr. 1993, 123(11), 1923-1931. https://doi.org/10.1093/jn/123.11.1923 |
| [11] | González-Infante G, Del Castillo, J. R., Herrera, F., Aguiar, G., Marcano, E., Rondón, L. J. Desarrollo clínico-biológico de ratas alimentadas con dieta semi-purificada a base de clara de huevo. Rev Inv Vet Perú. 2021, 32(4), e19438. |
[1, 2, 11]
.
Sodium consumption by the EWP diet group increased significantly compared to the standard diet group. The sodium content primarily originates from egg white, which contains 1250 mg/100 g (dried egg white), according to the USDA
| [28] | United States Department of Agriculture (USDA). Agricultural Reserach Service. Food Data Central Food Details. Egg White Dried. 2019. |
[28]
. Additionally, the mineral mix (AIN-93 mineral mix) used in the diet provides 1033-1039 mg/100 g of additional sodium. Although the sodium content in the EWP diet exceeds the level recommended by the AIN
| [1] | Reeves PG. Components of the AIN-93 diets as improvements in the AIN-76A diet. J Nutr. 1997, 127(5 Suppl), 838S-841S. https://doi.org/10.1093/jn/127.5.838S |
| [2] | Reeves PG, Rossow KL, Lindlauf J. Development and testing of the AIN-93 purified diets for rodents: results on growth, kidney calcification and bone mineralization in rats and mice. J Nutr. 1993, 123(11), 1923-1931. https://doi.org/10.1093/jn/123.11.1923 |
[1, 2]
, it remains within the normal ranges described in the literature
.
Sodium content in the diet is crucial for maintaining the physiological and biological status of normal rats, particularly Dahl-SS rats. Na
content in the diet may influence fluid balance, renal function, and blood pressure by modulating extracellular volume, hormones, such as aldosterone, renin, and angiotensin
| [4] | Bashyam H. Lewis Dahl and the genetics of salt-induced hypertension. J Exp Med. 2007, 204(7), 1507. https://doi.org/10.1084/jem.2047fta |
| [6] | Sterzel RB, Luft FC, Gao Y, Schnermann J, Briggs JP, Ganten D, et al. Renal disease and the development of hypertension in salt-sensitive Dahl rats. Kidney Int. 1988, 33(6), 1119-1129. https://doi.org/10.1038/ki.1988.120 |
| [10] | Kwon TH, Nielsen J, Kim YH, Knepper MA, Frokiaer J, Nielsen S. Regulation of sodium transporters in the thick ascending limb of rat kidney: response to angiotensin II. Am J Physiol Renal Physiol. 2003, 285(1), F152-165. Epub 20030325. https://doi.org/10.1152/ajprenal.00307.2002 |
| [31] | Martus W, Kim D, Garvin JL, Beierwaltes WH. Commercial rodent diets contain more sodium than rats need. Am J Physiol Renal Physiol. 2005, 288(2), F428-431. https://doi.org/10.1152/ajprenal.00310.2004 |
| [32] | Massry SG, Coburn JW. The hormonal and non-hormonal control of renal excretion of calcium and magnesium. Nephron. 1973, 10(2), 66-112. |
[4, 6, 10, 31, 32]
.
When monitoring the BW growth of the rats, no significant differences were observed in the birth weights of offspring from mothers fed either the standard diet or the EWP diet. However, during the lactation period, the offspring of mothers fed the EWP chow showed faster weight gain from day 11 of age until weaning (day 30). These findings align with observations reported in the literature
| [11] | González-Infante G, Del Castillo, J. R., Herrera, F., Aguiar, G., Marcano, E., Rondón, L. J. Desarrollo clínico-biológico de ratas alimentadas con dieta semi-purificada a base de clara de huevo. Rev Inv Vet Perú. 2021, 32(4), e19438. |
| [33] | Cambraia RP, Vannucchi H, De-Oliveira LM. Food intake and weight of lactating rats maintained on different protein-calorie diets, and pup growth. Braz J Med Biol Res. 1997, 30(8), 985-988. https://doi.org/10.1590/s0100-879x1997000800012 |
[11, 33]
. This rapid weight increase may result from the EWP chow’s superior caloric distribution compared to the commercial standard diet, including adequate amount of protein, higher fat content, and total carbohydrates, delivering more calories than the standard diet. These factors support adequate maternal feeding and consequently greater breast milk
| [33] | Cambraia RP, Vannucchi H, De-Oliveira LM. Food intake and weight of lactating rats maintained on different protein-calorie diets, and pup growth. Braz J Med Biol Res. 1997, 30(8), 985-988. https://doi.org/10.1590/s0100-879x1997000800012 |
[33]
.
The favorable caloric distribution also benefited the growing rats. From week 6 of age, pups fed the EWP diet exhibited progressive weight increases compared to those fed the standard diet. This observation is consistent with research studies conducted by the AIN with purified diets
| [29] | Report of the American Institute of Nurtition ad hoc Committee on Standards for Nutritional Studies. J Nutr. 1977, 107(7), 1340-1348. https://doi.org/10.1093/jn/107.7.1340 |
| [34] | Levin BE, Dunn-Meynell AA. Defense of body weight depends on dietary composition and palatability in rats with diet-induced obesity. Am J Physiol Regul Integr Comp Physiol. 2002, 282(1), R46-54. https://doi.org/10.1152/ajpregu.2002.282.1.R46 |
[29, 34]
.
After sacrificing the animals, we found statistically significant differences in the weight of the kidneys, heart, and liver, while no differences were observed in the spleen between the groups. The kidneys of the EWP diet group, corrected for BW, were smaller compared to those of the standard diet-fed group. This difference may be attributed to the lower water content in the residual tissue blood, likely due to lower water intake
. In contrast, the observed weight gain in the heart and liver tissues of the EWP group compared to the standard diet-fed group may result from greater growth and development during the experimental period
. To assess biochemical parameters, we analyzed plasma minerals, complete blood count, protein intake, urinary excretion, and plasma concentrations.
As described in the literature, the analysis of plasma minerals showed no significant differences, except for potassium. The lower plasma potassium concentration in the EWP diet group could be associated with a lower presence of this mineral in the diet
| [11] | González-Infante G, Del Castillo, J. R., Herrera, F., Aguiar, G., Marcano, E., Rondón, L. J. Desarrollo clínico-biológico de ratas alimentadas con dieta semi-purificada a base de clara de huevo. Rev Inv Vet Perú. 2021, 32(4), e19438. |
[11]
. However, contrary to findings by other researchers, the decrease in this mineral did not affect the parameters we studied.
According to the blood cell count, rats fed the EWP diet exhibited adequate values of HCT and MCV
, although these were lower compared to the values of the rats fed the standard diet. This may relate to the fact that the iron levels in the EWP diet are adequate for the animals' needs but lower than those in the standard diet
| [11] | González-Infante G, Del Castillo, J. R., Herrera, F., Aguiar, G., Marcano, E., Rondón, L. J. Desarrollo clínico-biológico de ratas alimentadas con dieta semi-purificada a base de clara de huevo. Rev Inv Vet Perú. 2021, 32(4), e19438. |
[11]
which aligns with observations in other research studies
.
Moreover, rats fed the EWP diet showed a higher MCV value. This may be due to the protein content in the EWP chow, as a decrease in protein levels typically leads to an increase in MCH
. The higher levels of MPV, PDW, and PT in animals fed the EWP diet compared to those fed the standard diet may result from adequate levels of macro and micronutrients in the EWP diet versus the standard diet. Proper dietary protein and fat management are known to influence blood composition and improve platelet function
. Although differences between the groups in some blood count components were observed, these values remained within normal parameters and some others showed no difference between them.
To analyze protein status, we measured intake, urinary protein excretion, and plasma concentration. As previously mentioned, the standard chow is considered a high-protein diet (43.41% according to dietetic formula)
| [38] | Mu C, Yang Y, Luo Z, Zhu W. Temporal microbiota changes of high-protein diet intake in a rat model. Anaerobe. 2017, 47, 218-225. Epub 20170617. https://doi.org/10.1016/j.anaerobe.2017.06.003 |
| [39] | Kostogrys RB, Franczyk-Zarow M, Maslak E, Topolska K. Effect of low carbohydrate high protein (LCHP) diet on lipid metabolism, liver and kidney function in rats. Environ Toxicol Pharmacol. 2015, 39(2), 713-719. Epub 20150123. https://doi.org/10.1016/j.etap.2015.01.008 |
| [40] | Sainz RD CC, Baldwin RL. Relationships among dietary protein, feed intake and changes in body and tissue composition of lactating rats. J Nutr 1986, 116(8). https://doi.org/10.1093/jn/116.8.1529 |
[38-40]
. However, the EWP diet is adjusted to AIN recommendations and is considered a normal protein diet (19.24% from dietetic formula)
| [38] | Mu C, Yang Y, Luo Z, Zhu W. Temporal microbiota changes of high-protein diet intake in a rat model. Anaerobe. 2017, 47, 218-225. Epub 20170617. https://doi.org/10.1016/j.anaerobe.2017.06.003 |
| [39] | Kostogrys RB, Franczyk-Zarow M, Maslak E, Topolska K. Effect of low carbohydrate high protein (LCHP) diet on lipid metabolism, liver and kidney function in rats. Environ Toxicol Pharmacol. 2015, 39(2), 713-719. Epub 20150123. https://doi.org/10.1016/j.etap.2015.01.008 |
| [40] | Sainz RD CC, Baldwin RL. Relationships among dietary protein, feed intake and changes in body and tissue composition of lactating rats. J Nutr 1986, 116(8). https://doi.org/10.1093/jn/116.8.1529 |
[38-40]
. When assessing protein excretion, we observed that urinary protein excretion was significantly lower in the EWP diet-fed group compared to the standard diet-fed group, which, according to this study, is positively related to protein consumption. This is possible because normal protein intake is associated with a positive protein net balance and metabolism
| [40] | Sainz RD CC, Baldwin RL. Relationships among dietary protein, feed intake and changes in body and tissue composition of lactating rats. J Nutr 1986, 116(8). https://doi.org/10.1093/jn/116.8.1529 |
[40]
. The lack of relationship between protein intake and excretion in the standard chow group could be due to alterations in protein metabolism, such as increased hepatic ureogenesis with urinary nitrogen excretion (predominantly urea), increased fecal excretion
| [41] | Pasiakos SM, Margolis LM, McClung JP, Cao JJ, Whigham LD, Combs GF, et al. Whole-body protein turnover response to short-term high-protein diets during weight loss: a randomized controlled trial. Int J Obes (Lond). 2014, 38(7), 1015-1018. Epub 20131029. https://doi.org/10.1038/ijo.2013.197 |
[41]
, expansion of extracellular amino acid pools
, protein turnover
, and stimulation of gluconeogenesis
.
The assessment of the protein excretion rate, obtained by multiplying proteinuria by the percentage base and dividing the resulting ratio by dietary protein intake, indicated that the EWP diet group had a higher protein excretion rate than the standard diet group. This may be attributed to the lower urinary volume in the EWP diet-fed rats, resulting in higher urinary concentration. However, despite the differences between groups, both the EWP diet group and the standard diet group exhibited renal protein excretion within normal parameters, suggesting proper kidney function and the absence of associated pathologies. This finding is consistent with other studies in rats and dogs, where varying dietary protein contents were not linked to structural or functional changes in the kidneys
| [44] | Carbini L, Lantini T, Orgiana G, Scarpa AL, Padalino A. [Influence of a high protein diet on the urinary and fecal excretion of calcium in albino rats]. Boll Soc Ital Biol Sper. 1979, 55(12), 1196-1202. |
[44]
. As previously
| [11] | González-Infante G, Del Castillo, J. R., Herrera, F., Aguiar, G., Marcano, E., Rondón, L. J. Desarrollo clínico-biológico de ratas alimentadas con dieta semi-purificada a base de clara de huevo. Rev Inv Vet Perú. 2021, 32(4), e19438. |
[11]
, although protein consumption differs between both groups, plasma protein concentrations remain within normal ranges without significant differences. Furthermore, our results indicate that there is no linear relationship between a high protein diet and plasma protein levels.
Considering that sodium content in the diet may influence fluid balance and blood pressure, we evaluated the blood pressure and enzymatic activity of Na+, K+, and Na+ ATPases in both experimental groups.
As expected, the assessment of SP, DP, and MP in rats fed either the EWP chow or the standard chow showed normal blood pressures, with no statistically significant differences between the groups throughout the growth period. This outcome was anticipated, since both diets are normosodic and should not affect the rats’ inherent salt sensitivity
| [11] | González-Infante G, Del Castillo, J. R., Herrera, F., Aguiar, G., Marcano, E., Rondón, L. J. Desarrollo clínico-biológico de ratas alimentadas con dieta semi-purificada a base de clara de huevo. Rev Inv Vet Perú. 2021, 32(4), e19438. |
[11]
.
Likewise, we expected that the enzymatic activity of Na
+/K
+ and Na
+ ATPase did not show significant differences between the groups studied. Analyzing the activity of the Na
+/K
+ and Na
+ ATPase pumps (responsible for Na absorption in the proximal tubules)
allowed us to indirectly evaluate renal function and observe adequate enzymatic function. As supported by other authors, a balanced diet in Na, K, and Mg creates a stable ionic environment for the activity of the Na
+/K+, and Na
+ ATPase pumps, indirectly indicating proper functioning of the kidneys
| [21] | Del Castillo JR, Robinson JW. Na+-stimulated ATPase activities in basolateral plasma membranes from guinea-pig small intestinal epithelial cells. Biochim Biophys Acta. 1985, 812(2), 413-422. https://doi.org/10.1016/0005-2736(85)90316-5 |
| [45] | Sugden AL, Bean BL, Straw JA. Effects of high potassium or low sodium diet on vascular Na+, K+-ATPase activity and blood pressure in young spontaneously hypertensive rats. Hypertension. 1987, 9(6), 571-575. https://doi.org/10.1161/01.hyp.9.6.571 |
[21, 45]
.
Finally, from a physiological standpoint, after analyzing various variables, including kidney size and clinical status, water balance, urinary protein excretion, and the intact activity of the Na+, K+, and Na+ ATPase pumps, we can highlight that the EWP diet maintains proper renal function, which is crucial for the salt sensitivity of Dahl rats. Accordingly, we can conclude that, from a functional perspective, the EWP diet is a high-nutritional-value chow suitable for nutrient-sensitive rats.
5. Conclusion
Biological, biochemical, and physiological parameters demonstrate that the EWP diet is of high nutritional quality and meets AIN recommendations in Dahl-SS rats. This diet enables Dahl-SS rats, which are nutrient-sensitive and genetically predisposed to develop hypertension, to achieve an optimal state.
The optimal clinical-nutritional, and metabolic status of the EWP diet-fed rats, their rapid body weight gain during the initial days after birth, and the increasing body weight gain after weaning suggest that this diet is ideal for experimentation with Dahl-SS rats.
The correct balance of minerals, adequate protein content, proper levels of fat and carbohydrates, as well as evidence of normal renal function and the absence of kidney-related pathologies indicate that the EWP diet is a high-nutritional-value chow suitable for nutrient-sensitive rats.
Finally, a thorough understanding of the components of the chow for different animal models allows researchers to manipulate the ingredients and conduct more precise studies, resulting in broader research scope and control across diverse scientific fields.
Abbreviations
EWP | Egg-white Protein |
Dahl-SS Rats | Dahl Salt-Sensitive Ats |
AIN | American Institute for Nutrition |
SHR | Spontaneously Hypertensive Rat |
EHT | Essential Hypertension |
A.O.A.C | Official Association of Agricultural Chemists |
BW | Body Weight |
IVIC | Venezuelan Institute for Scientific Research |
OSP | Open Source Physics |
Al | Aluminum |
Ba | Barium |
Fe | Iron |
Cu | Copper |
Mn | Manganese |
Sr | Strontium |
Zn | Zinc |
Ca | Calcium |
K | Potassium |
Mg | Magnesium |
Na | Sodium |
P | Phosphorus |
WBC | Leukocytes |
HGB | Hemoglobin |
RBC | Red Blood Cell |
HCT | Hematocrit |
MCV | Mean Corpuscular Volume |
MCH | Mean Corpuscular Hemoglobin |
MCHC | Mean Corpuscular Hemoglobin Concentration |
RDW-CV, RDW-SD | Red Cell Distribution Width |
PLT | Platelet Count |
MPV | Mean Platelet Volume |
PDW | Platelet Distribution Width |
PCT | Percentage of Procalcitonin |
GLU | Concentrations of Glucose |
CHOL | Cholesterol |
TRI | Triglycerides |
VLDL | Very Low-density Lipoproteins |
PT | Prothrombin |
PTT | Prothrombin Time Test |
Acknowledgments
We thank the management board of the Institute of Food Technology (ICTA-UCV) and the National Institute of Nutrition (INN) for their logistical support in preparing the proximate analysis of the EWP diet. We also thank the National Institute of Agronomic and Environment Research (INRAE) at the Clermont-Ferrand-Theix Research Center for donating vitamins and minerals for supplementation. Additionally, we extend our gratitude to the Plant Ecophysiology Laboratory at the Ecology Center of the Venezuelan Institute for Scientific Research (IVIC), especially Francisco Herrera, Guillermina Aguiar, and Eunice Marcano, for their assistance with mineral determination techniques in biological samples.
Author Contributions
Lusliany Josefina Rondón: designed the experiments, analyzed the figures, wrote the article, and contributed to the final content.
Gabriela González-Infante: conducted experimental procedures, analyzed the figures, wrote the article, and contributed to the final content.
Both authors have read and approved the final manuscript.
Data Availability Statement
All data is available upon request from the corresponding author.
Funding
Founding from this work was provided by the Government of Miranda and The National Fund for Science, Technology and Innovation (Fonacit), grant No. 9001.
Conflicts of Interest
The authors declare no conflicts of interest.
References
| [1] |
Reeves PG. Components of the AIN-93 diets as improvements in the AIN-76A diet. J Nutr. 1997, 127(5 Suppl), 838S-841S.
https://doi.org/10.1093/jn/127.5.838S
|
| [2] |
Reeves PG, Rossow KL, Lindlauf J. Development and testing of the AIN-93 purified diets for rodents: results on growth, kidney calcification and bone mineralization in rats and mice. J Nutr. 1993, 123(11), 1923-1931.
https://doi.org/10.1093/jn/123.11.1923
|
| [3] |
Dasinger JH, Fehrenbach DJ, Abais-Battad JM. Dietary Protein: Mechanisms Influencing Hypertension and Renal Disease. Curr Hypertens Rep. 2020, 22(2), 13. Epub 20200203.
https://doi.org/10.1007/s11906-020-1018-8
|
| [4] |
Bashyam H. Lewis Dahl and the genetics of salt-induced hypertension. J Exp Med. 2007, 204(7), 1507.
https://doi.org/10.1084/jem.2047fta
|
| [5] |
Rondon LJ, Marcano E, Rodriguez F, del Castillo JR. Blood pressure, magnesium and other mineral balance in two rat models of salt-sensitive, induced hypertension: effects of a non-peptide angiotensin II receptor type 1 antagonist. Magnes Res. 2014, 27(3), 113-130.
https://doi.org/10.1684/mrh.2014.0368
|
| [6] |
Sterzel RB, Luft FC, Gao Y, Schnermann J, Briggs JP, Ganten D, et al. Renal disease and the development of hypertension in salt-sensitive Dahl rats. Kidney Int. 1988, 33(6), 1119-1129.
https://doi.org/10.1038/ki.1988.120
|
| [7] |
De Miguel C, Lund H, Mattson DL. High dietary protein exacerbates hypertension and renal damage in Dahl SS rats by increasing infiltrating immune cells in the kidney. Hypertension. 2011, 57(2), 269-274. Epub 20101220.
https://doi.org/10.1161/HYPERTENSIONAHA.110.154302
|
| [8] |
Robson L. The kidney--an organ of critical importance in physiology. J Physiol. 2014, 592(18), 3953-3954.
https://doi.org/10.1113/jphysiol.2014.279216
|
| [9] |
Mattson DL, Meister CJ, Marcelle ML. Dietary protein source determines the degree of hypertension and renal disease in the Dahl salt-sensitive rat. Hypertension. 2005, 45(4), 736-741. Epub 20050207.
https://doi.org/10.1161/01.HYP.0000153318.74544.cc
|
| [10] |
Kwon TH, Nielsen J, Kim YH, Knepper MA, Frokiaer J, Nielsen S. Regulation of sodium transporters in the thick ascending limb of rat kidney: response to angiotensin II. Am J Physiol Renal Physiol. 2003, 285(1), F152-165. Epub 20030325.
https://doi.org/10.1152/ajprenal.00307.2002
|
| [11] |
González-Infante G, Del Castillo, J. R., Herrera, F., Aguiar, G., Marcano, E., Rondón, L. J. Desarrollo clínico-biológico de ratas alimentadas con dieta semi-purificada a base de clara de huevo. Rev Inv Vet Perú. 2021, 32(4), e19438.
|
| [12] |
Horwitz W, Latimer GW, editors. Official methods of analysis of AOAC International2010.
|
| [13] |
Windsor DL, Denton, M. B. Evaluation of Inductively Coupled Plasma Optical Emission Spectrometry as a Method for the Elemental Analysis of Organic Compounds. Applied Spectroscopy. 1978, 32(4), 366-371.
https://doi.org/10.1366/000370278774331134
|
| [14] |
Morton DB, Griffiths PH. Guidelines on the recognition of pain, distress and discomfort in experimental animals and an hypothesis for assessment. Vet Rec. 1985, 116(16), 431-436.
https://doi.org/10.1136/vr.116.16.431
|
| [15] |
Michael B, Yano B, Sellers RS, Perry R, Morton D, Roome N, et al. Evaluation of organ weights for rodent and non-rodent toxicity studies: a review of regulatory guidelines and a survey of current practices. Toxicol Pathol. 2007, 35(5), 742-750.
https://doi.org/10.1080/01926230701595292
|
| [16] |
Olivares EGB, Herrera FF, Aguiar G, Peña E, Ramos M, Méndez C. Comparación De La Nutrición Mineral De Los Helechos Cyathea aurea, C. delgadii, Dicranopteris flexuosa Y Pteridium arachnoideum en la Gran Sabana, Venezuela. Interciencia. 2016, 41, 273-283.
|
| [17] |
Acosta L, Rodríguez, P. Perfil Lipídico, Protéico y Glicemia en Ratas Sprague Dawley y Shr/N producidas en la UCLA. Venezuela. Gaceta de Ciencias Veterinaria. 2008, 111-125.
|
| [18] |
Blumenreich MS. The White Blood Cell and Differential Count. In: rd, Walker HK, Hall WD, Hurst JW, editors. Clinical Methods: The History, Physical, and Laboratory Examinations. Boston 1990.
|
| [19] |
Bradford MM. A rapid and sensitive method for the quantitation of microgram quantities of protein utilizing the principle of protein-dye binding. Anal Biochem. 1976, 72, 248-254.
https://doi.org/10.1006/abio.1976.9999
|
| [20] |
Cariani L, Thomas L, Brito J, del Castillo JR. Bismuth citrate in the quantification of inorganic phosphate and its utility in the determination of membrane-bound phosphatases. Anal Biochem. 2004, 324(1), 79-83.
https://doi.org/10.1016/j.ab.2003.09.008
|
| [21] |
Del Castillo JR, Robinson JW. Na+-stimulated ATPase activities in basolateral plasma membranes from guinea-pig small intestinal epithelial cells. Biochim Biophys Acta. 1985, 812(2), 413-422.
https://doi.org/10.1016/0005-2736(85)90316-5
|
| [22] |
Fitzsimons TJ, Le Magnen J. Eating as a regulatory control of drinking in the rat. J Comp Physiol Psychol. 1969, 67(3), 273-283.
https://doi.org/10.1037/h0026772
|
| [23] |
Kissileff HR, Gruss LP, Thornton J, Jordan HA. The satiating efficiency of foods. Physiol Behav. 1984, 32(2), 319-332.
https://doi.org/10.1016/0031-9384(84)90147-1
|
| [24] |
Holdstock TL. Body weight and water consumption in rats. Physiological Psychology 1973, 1(1), 21-23.
|
| [25] |
Saínz Menéndez B, Balance hidromineral (BHM) Hydromineral balance (HMB) Revista Cubana de Cirugia. 2005, 44(4), 0-0(1).
|
| [26] |
Riebl SK, Davy BM. The Hydration Equation: Update on Water Balance and Cognitive Performance. ACSMs Health Fit J. 2013, 17(6), 21-28.
https://doi.org/10.1249/FIT.0b013e3182a9570f
|
| [27] |
Cheuvront SN, Fraser CG, Kenefick RW, Ely BR, Sawka MN. Reference change values for monitoring dehydration. Clin Chem Lab Med. 2011, 49(6), 1033-1037. Epub 20110324.
https://doi.org/10.1515/CCLM.2011.170
|
| [28] |
United States Department of Agriculture (USDA). Agricultural Reserach Service. Food Data Central Food Details. Egg White Dried. 2019.
|
| [29] |
Report of the American Institute of Nurtition ad hoc Committee on Standards for Nutritional Studies. J Nutr. 1977, 107(7), 1340-1348.
https://doi.org/10.1093/jn/107.7.1340
|
| [30] |
Sandberg K, Ji H, Catt KJ. Regulation of angiotensin II receptors in rat brain during dietary sodium changes. Hypertension. 1994, 23(1 Suppl), I137-141.
https://doi.org/10.1161/01.hyp.23.1_suppl.i137
|
| [31] |
Martus W, Kim D, Garvin JL, Beierwaltes WH. Commercial rodent diets contain more sodium than rats need. Am J Physiol Renal Physiol. 2005, 288(2), F428-431.
https://doi.org/10.1152/ajprenal.00310.2004
|
| [32] |
Massry SG, Coburn JW. The hormonal and non-hormonal control of renal excretion of calcium and magnesium. Nephron. 1973, 10(2), 66-112.
|
| [33] |
Cambraia RP, Vannucchi H, De-Oliveira LM. Food intake and weight of lactating rats maintained on different protein-calorie diets, and pup growth. Braz J Med Biol Res. 1997, 30(8), 985-988.
https://doi.org/10.1590/s0100-879x1997000800012
|
| [34] |
Levin BE, Dunn-Meynell AA. Defense of body weight depends on dietary composition and palatability in rats with diet-induced obesity. Am J Physiol Regul Integr Comp Physiol. 2002, 282(1), R46-54.
https://doi.org/10.1152/ajpregu.2002.282.1.R46
|
| [35] |
Reinoso RF, Telfer BA, Rowland M. Tissue water content in rats measured by desiccation. J Pharmacol Toxicol Methods. 1997, 38(2), 87-92.
https://doi.org/10.1016/s1056-8719(97)00053-1
|
| [36] |
Dutta-Roy AK. Dietary components and human platelet activity. Platelets. 2002, 13(2), 67-75.
https://doi.org/10.1080/09537100120111540
|
| [37] |
Hackbarth H, Burow K, Schimansky G. Strain differences in inbred rats: influence of strain and diet on haematological traits. Lab Anim. 1983, 17(1), 7-12.
https://doi.org/10.1258/002367783781070948
|
| [38] |
Mu C, Yang Y, Luo Z, Zhu W. Temporal microbiota changes of high-protein diet intake in a rat model. Anaerobe. 2017, 47, 218-225. Epub 20170617.
https://doi.org/10.1016/j.anaerobe.2017.06.003
|
| [39] |
Kostogrys RB, Franczyk-Zarow M, Maslak E, Topolska K. Effect of low carbohydrate high protein (LCHP) diet on lipid metabolism, liver and kidney function in rats. Environ Toxicol Pharmacol. 2015, 39(2), 713-719. Epub 20150123.
https://doi.org/10.1016/j.etap.2015.01.008
|
| [40] |
Sainz RD CC, Baldwin RL. Relationships among dietary protein, feed intake and changes in body and tissue composition of lactating rats. J Nutr 1986, 116(8).
https://doi.org/10.1093/jn/116.8.1529
|
| [41] |
Pasiakos SM, Margolis LM, McClung JP, Cao JJ, Whigham LD, Combs GF, et al. Whole-body protein turnover response to short-term high-protein diets during weight loss: a randomized controlled trial. Int J Obes (Lond). 2014, 38(7), 1015-1018. Epub 20131029.
https://doi.org/10.1038/ijo.2013.197
|
| [42] |
Martin WF, Armstrong LE, Rodriguez NR. Dietary protein intake and renal function. Nutr Metab (Lond). 2005, 2, 25. Epub 20050920.
https://doi.org/10.1186/1743-7075-2-25
|
| [43] |
Peret J, Bach AC, Delhomme B, Bois-Joyeux B, Chanez M, Schirardin H. Metabolic effects of high-protein diets in Zucker rats. Metabolism. 1984, 33(3), 200-207.
https://doi.org/10.1016/0026-0495(84)90036-2
|
| [44] |
Carbini L, Lantini T, Orgiana G, Scarpa AL, Padalino A. [Influence of a high protein diet on the urinary and fecal excretion of calcium in albino rats]. Boll Soc Ital Biol Sper. 1979, 55(12), 1196-1202.
|
| [45] |
Sugden AL, Bean BL, Straw JA. Effects of high potassium or low sodium diet on vascular Na+, K+-ATPase activity and blood pressure in young spontaneously hypertensive rats. Hypertension. 1987, 9(6), 571-575.
https://doi.org/10.1161/01.hyp.9.6.571
|
Cite This Article
-
APA Style
Rondón, L. J., González-Infante, G. A. (2025). Semi-Purified Egg-White Protein (EWP) Diet Improves Nutritional Status and Maintains Adequate Blood Pressure in Dahl Salt-Sensitive (Dahl-SS) Rats. Animal and Veterinary Sciences, 13(2), 31-44. https://doi.org/10.11648/j.avs.20251302.11
 Copy
|
Copy
|
 Download
ACS Style
Rondón, L. J.; González-Infante, G. A. Semi-Purified Egg-White Protein (EWP) Diet Improves Nutritional Status and Maintains Adequate Blood Pressure in Dahl Salt-Sensitive (Dahl-SS) Rats. Anim. Vet. Sci. 2025, 13(2), 31-44. doi: 10.11648/j.avs.20251302.11
Copy
|
Download
AMA Style
Rondón LJ, González-Infante GA. Semi-Purified Egg-White Protein (EWP) Diet Improves Nutritional Status and Maintains Adequate Blood Pressure in Dahl Salt-Sensitive (Dahl-SS) Rats. Anim Vet Sci. 2025;13(2):31-44. doi: 10.11648/j.avs.20251302.11
Copy
|
Download
-
@article{10.11648/j.avs.20251302.11,
  author = {Lusliany Josefina Rondón and Gabriela Alejandra González-Infante},
  title = {Semi-Purified Egg-White Protein (EWP) Diet Improves Nutritional Status and Maintains Adequate Blood Pressure in Dahl Salt-Sensitive (Dahl-SS) Rats},
  journal = {Animal and Veterinary Sciences},
  volume = {13},
  number = {2},
  pages = {31-44},
  doi = {10.11648/j.avs.20251302.11},
  url = {https://doi.org/10.11648/j.avs.20251302.11},
  eprint = {https://article.sciencepublishinggroup.com/pdf/10.11648.j.avs.20251302.11},
  abstract = {Standardized diets for laboratory rodents become increasingly important. Dietary imbalances can negatively impact experimental outcomes. Commercially available diets often include ingredients that cannot be experimentally manipulated and may not meet all nutritional and experimental requirements. Current growth and maintenance diets for experimental animals are regulated by the American Institute for Nutrition (AIN). In our laboratory, we developed a diet based on egg-white protein (EWP) using endogenous ingredients that are safe for experimental rats and can be experimentally manipulated according to AIN standards. Therefore, this study aims to test and validate the nutritional quality of the EWP diet for the Dahl-SS rat strain, which is known to be nutrient-sensitive and genetically predisposed to develop hypertension. 14 pairs of Dahl-SS rats (14 females and 14 males) were used for mating. The rats were randomly divided into two groups: 7 pairs were fed a commercial standard diet, and the other 7 pairs were fed an EWP diet. From here, 10 pregnant rats (5 from each group), 14 weeks of age, and 1 week of gestation, were selected for the study and were fed their respective diets. The offspring were weighed at birth and weaned at 4 weeks of age. Five pups were randomly selected from each group (standard diet group and EWP diet group) and continued with their mother’s respective diets for an additional 6 weeks. During the study they were subjected to Biological (clinical-behavioral status, metabolic analysis, relative organ-weight), Biochemical (mineral analysis, hemogram, protein analysis) and Physiological parameters analysis (Blood Pressure determination, enzymatic activity of Na+ and Na/K+ pump in renal cortex). To complete analysis of the different parameters, at 10 weeks, the rats were sacrificed by exsanguination via cardiac puncture under intraperitoneal anesthesia with thiopental sodium (20-25 mg/kg). Blood was collected in heparinized and centrifuged tubes at 3500 g for 10 minutes at 4°C. Plasma was separated and stored at -20°C until analysis. The kidneys, heart, spleen, and liver were collected and weighed. Dahl-SS rats fed the EWP diet showed normal behavioral, motor and metabolic values, faster and greater body weight gain, blood and urine biochemistry values within normal range, stable blood pressure, normal enzyme activity, and adequate kidney function in comparison to the rats fed the standard diet. According to the parameters assessed, it was possible to conclude that the EWP diet has proven to be a suitable option for supporting maintenance, growth, and blood pressure regulation in Dahl-SS rats.},
 year = {2025}
}
Copy
|
Download
-
TY  - JOUR
T1  - Semi-Purified Egg-White Protein (EWP) Diet Improves Nutritional Status and Maintains Adequate Blood Pressure in Dahl Salt-Sensitive (Dahl-SS) Rats
AU  - Lusliany Josefina Rondón
AU  - Gabriela Alejandra González-Infante
Y1  - 2025/03/26
PY  - 2025
N1  - https://doi.org/10.11648/j.avs.20251302.11
DO  - 10.11648/j.avs.20251302.11
T2  - Animal and Veterinary Sciences
JF  - Animal and Veterinary Sciences
JO  - Animal and Veterinary Sciences
SP  - 31
EP  - 44
PB  - Science Publishing Group
SN  - 2328-5850
UR  - https://doi.org/10.11648/j.avs.20251302.11
AB  - Standardized diets for laboratory rodents become increasingly important. Dietary imbalances can negatively impact experimental outcomes. Commercially available diets often include ingredients that cannot be experimentally manipulated and may not meet all nutritional and experimental requirements. Current growth and maintenance diets for experimental animals are regulated by the American Institute for Nutrition (AIN). In our laboratory, we developed a diet based on egg-white protein (EWP) using endogenous ingredients that are safe for experimental rats and can be experimentally manipulated according to AIN standards. Therefore, this study aims to test and validate the nutritional quality of the EWP diet for the Dahl-SS rat strain, which is known to be nutrient-sensitive and genetically predisposed to develop hypertension. 14 pairs of Dahl-SS rats (14 females and 14 males) were used for mating. The rats were randomly divided into two groups: 7 pairs were fed a commercial standard diet, and the other 7 pairs were fed an EWP diet. From here, 10 pregnant rats (5 from each group), 14 weeks of age, and 1 week of gestation, were selected for the study and were fed their respective diets. The offspring were weighed at birth and weaned at 4 weeks of age. Five pups were randomly selected from each group (standard diet group and EWP diet group) and continued with their mother’s respective diets for an additional 6 weeks. During the study they were subjected to Biological (clinical-behavioral status, metabolic analysis, relative organ-weight), Biochemical (mineral analysis, hemogram, protein analysis) and Physiological parameters analysis (Blood Pressure determination, enzymatic activity of Na+ and Na/K+ pump in renal cortex). To complete analysis of the different parameters, at 10 weeks, the rats were sacrificed by exsanguination via cardiac puncture under intraperitoneal anesthesia with thiopental sodium (20-25 mg/kg). Blood was collected in heparinized and centrifuged tubes at 3500 g for 10 minutes at 4°C. Plasma was separated and stored at -20°C until analysis. The kidneys, heart, spleen, and liver were collected and weighed. Dahl-SS rats fed the EWP diet showed normal behavioral, motor and metabolic values, faster and greater body weight gain, blood and urine biochemistry values within normal range, stable blood pressure, normal enzyme activity, and adequate kidney function in comparison to the rats fed the standard diet. According to the parameters assessed, it was possible to conclude that the EWP diet has proven to be a suitable option for supporting maintenance, growth, and blood pressure regulation in Dahl-SS rats.
VL  - 13
IS  - 2
ER  -
Copy
|
Download