Abstract
Smallholder dairy farmers in Tanzania predominantly keep crosses of Boran/Zebu and Friesian/Jersey/Ayrshire for income generation and household nutrition. However, in coastal areas hot and humid environment presents challenges for dairy production such as limited access to quality feed which lead to frequent cases of negative energy balance (NEB). Body Condition Score (BCS) is a key management tool for assessing energy reserves and metabolic status, yet information on its relationship with milk yield and composition in Tanzanian crossbred dairy cows is lacking. This study aimed at evaluating the association between BCS and milk yield and milk composition during the postpartum period in crossbred dairy cows raised under hot and humid tropical conditions. Atotal of 102 crossbred dairy cows from TALIRI and LITA farms were monitored over five months. BCS of each cow was scored based on a five – point scale (1=Emaciated and 5=Obese). The BCS scores were categorized into three groups, with group one, two and three having scores of 2.0 to 2.5, 2.6 to 3.4 and 3.5 to 4.0, respectively. Milk yield and composition (fat, protein and lactose contents) were measured daily and twice per month, respectively. Results revealed significant effects of BCS on milk yield and composition (p<0.0001). Cows with a BCS in group three had the highest average daily milk yield (5.86 ± 0.48 liters / day) and fat content (3.75%) while those with BCS in group one had the lowest average daily milk yield (3.60 ± 0.34 liters /day) and fat content (2.80%). Milk protein and lactose contents did not differ (p > 0.05) among the BCS groups. Body condition score had significant and positive correlations with milk yield, milk fat, milk protein and milk lactose contents. A one unit increase in BCS was associated with an increase of 1.24 liters for daily milk yield, 0.54% for milk fat, 0.1% for milk protein and 0.14% for lactose. These findings under score the critical role of maintaining optimal BCS to enhance milk production and quality in cross bred dairy cows. Therefore, smallholder dairy farmers should ensure that their cows achieve and maintain optimal BCS for sustained productivity.
|
Published in
|
Animal and Veterinary Sciences (Volume 13, Issue 3)
|
|
DOI
|
10.11648/j.avs.20251303.13
|
|
Page(s)
|
71-82 |
|
Creative Commons
|

This is an Open Access article, distributed under the terms of the Creative Commons Attribution 4.0 International License (http://creativecommons.org/licenses/by/4.0/), which permits unrestricted use, distribution and reproduction in any medium or format, provided the original work is properly cited.
|
|
Copyright
|
Copyright © The Author(s), 2025. Published by Science Publishing Group
|
Keywords
Body Condition Score, Crossbred Dairy Cows, Daily Milk Yield, Fat Content, Lactose Content, Protein Content
1. Introduction
In Tanzania smallholder dairy cattle production became more popular since 1980s, especially in peri-urban and rural areas. Milk production for income generation and house hold nutrition are key purposes for keeping dairy cattle for the majority of smallholder farmers in Tanzania. Moreover, smallholder dairy production plays an important role in food security and poverty alleviation for poor households as the dairy cattle represent an important investment capital that appreciates overtime.
In Tanzania, the majority of dairy cattle farmers keep crossbred dairy cattle produced by crossing Boran/Zebu with temperate dairy breeds, particularly Friesian, Jersey, and Ayrshire. This is because the pure dairy breeds seem to perform relatively poor under hot and humid environmental conditions due to lack of adaptability, On the other hand, the crossbred dairy cows perform relatively better under low input production system and thus, are well suited for smallholder farmers. They produce an average of eight or more liters of milk per cow per day during the rainy season and four liters or less during the dry season
| [1] | Lyimo, Z. C., Nkya, R., Schoonman, L., & VanEerdenburg, F. J. C. M. (2004). Post-partum reproductive performance of crossbred dairy cattle on smallholder farms in sub-humid coastal Tanzania. Tropical Animal Healthand Production, 36, 269-279. |
| [2] | Kurwijila L R, Omore A, Delia G. Tanzania Dairy Industry Overview–2012. Sokoine University of Agriculture10/1/2012. |
| [3] | Cadilhon, J. J., Pham, N. D., & Maass, B. L. (2016). The Tangadairyplatform: Fostering innovations for more efficient dairy chain coordination in Tanzania. International Journal on Food System Dynamics, 7(2), 81-91. |
[1-3]
. The herd size for smallholder farmers varies, with the majority keeping less than five cows
| [4] | McDermott, J. J., Staal, S. J., Freeman, H. A., Herrero, M., & VandeSteeg, J. A. (2010). Sustaining intensification of smallholder livestock systems in the tropics. Livestock science, 130(1-3), 95-109. |
[4]
.
Management of dairy cows in hot and humid climates presents a unique set of challenges, and several factors can significantly affect the performance of dairy cows in these areas including heatstress, in adequate nutrition due to poor quality and quantity of the common feed resource and diseases and parasites. Dairy cows experience negative energy balance when energy required for maintenance and milk production exceeds the energy obtained from feeds/forages consumed. During the dry season, both quantity and quality of forages significantly decline, hence, dairy cows of smallholder farmers get insufficient nutrients and energy. During the period of feed scarcity, lactating dairy cow utilizes the body fat reserve to sustain her milk production in response to insufficient energy obtained from the feeds, and this is reflected in loss of body condition
| [5] | Roche, J. R., Friggens, N. C., Kay, J. K., Fisher, M. W., Stafford, K. J., & Berry, D. P. (2009). Invitedreview: Body condition score and its association with dairy cow productivity, health, and welfare. Journal of dairy science, 92(12), 5769-5801. |
[5]
. Excessive negative energy balance results in to the cows getting very thin and can lead to health problems and poor fertility.
Therefore, estimating dairy cow’s energy balance is crucial in order to monitor health, milk production, reproduction, and feed management. Dairy cows’ energy balance has been traditionally determined by subtracting energy output from their energy intake
| [6] | Banos, G., Brotherstone, S., & Coffey, M. P. (2004). Evaluation of body condition score measured throughout lactation as an indicator of fertility in dairy cattle. Journal of dairy science, 87(8), 2669-2676. |
[6]
. In order to determine the energy for maintenance, milk production, activity, pregnancy and growth, energy from feed intake and expenditure must be recorded. Practically estimates o f energy spending in dairy cows for maintenance, activity and growth are hard to obtain, with exception for milk production.
The current techniques that can be used to determine the level of the energy balance like measurements of non-esterified fatty acid (NEFA), albumin, insulin, insulin-like growth factor 1 (IGF-1), glucose, growth hormone, are very expensive in terms of collection of blood samples and equipment for analysis. Alternatively, energy balance (EB) can be predicted using body weight as they are positively correlated
| [7] | Coffey, M. P., Emmans, G. C., & Brotherstone, S. (2001). Genetic evaluation of dairy bulls for energy balance traits using random regression. Animal Science, 73(1), 29-40. |
| [8] | Tedeschi, L. O., Seo, S., Fox, D. G., & Ruiz, R. (2006). Accounting for energy and protein reserve changes in predicting diet-allow able milk production in cattle. Journal of Dairy Science, 89(12), 4795-4807. |
[7, 8].
However, the measurement of body weight (BW) alone might not be a reliable indicator of changes in bio-energetic tissues. This is because during the early stage of lactation changes in BW is influenced by several factors such as organ weight and water and feed intake. Moreover, the amount of body weight gained as a result of the gastro-intestinal fill masks the degree of body tissue loss
| [9] | National Research Council, Committee on Animal Nutrition, & Subcommittee on Dairy Cattle Nutrition. (2001). Nutrient requirements of dairy cattle: 2001. National Academies Press. |
[9]
.
Therefore, it is important to use other traits such as body condition score (BCS) which can be easily and quickly determined and its assessment is less expensive. It is assessed through visual or physical palpation on alive animal.
Body condition score (BCS) is a reliable indicator of nutritional well-being and overall health of dairy cows. Furthermore, BCS is an indicator of the amount of metabolic energy retained in body fat and muscles. In broad-spectrum, variations in BCS are observed when dairy cow's energy reserves change during certain stages of lactation. Research findings indicate that high milk yields during early lactation are often associated with a decline in BSC or a loss of energy reserves
| [10] | Pryce, J. E., Coffey, M. P., & Simm, G. (2001). The relationship between body condition score and reproductive performance. Journal of dairy science, 84(6), 1508-1515. |
| [11] | Dechow, C. D., Rogers, G. W., Klei, L., & Lawlor, T. J. (2003). Heritabilities and correlations among body condition score, dairy form and selected linear type traits. Journal of dairy science, 86(6), 2236-2242. |
[10, 11]
. Studies have shown that BW and BCS can be used by farmers as management tools during pre- and post-partum periods for evaluation of milk yield, milk composition
| [12] | Alphosus, C., Akpa, G. N., Barje, P. P., Ayigun, E. A., Zanna, M., Olaiya, O.,... & Abdulahi, I. (2014). Effect of post-partum body condition score on milk yield and composition of Friesian x bunaji dairy cows. Animal Research International, 11(2), 2048-2056. |
[12]
health of dairy cows, nutritional status and reproduction performance
| [10] | Pryce, J. E., Coffey, M. P., & Simm, G. (2001). The relationship between body condition score and reproductive performance. Journal of dairy science, 84(6), 1508-1515. |
| [11] | Dechow, C. D., Rogers, G. W., Klei, L., & Lawlor, T. J. (2003). Heritabilities and correlations among body condition score, dairy form and selected linear type traits. Journal of dairy science, 86(6), 2236-2242. |
| [13] | Nazhat, S. A., Aziz, A., Zabuli, J., & Rahmati, S. (2021). Importance of body condition scoring in reproductive performance of dairy cows: A Review. Open Journal of Veterinary Medicine, 11(7), 272-288. |
[10, 11, 13]
. Currently, most studies that report on the relationship between BCS and milk yield and quality are from technologically advanced countries such as US and UK
| [11] | Dechow, C. D., Rogers, G. W., Klei, L., & Lawlor, T. J. (2003). Heritabilities and correlations among body condition score, dairy form and selected linear type traits. Journal of dairy science, 86(6), 2236-2242. |
| [6] | Banos, G., Brotherstone, S., & Coffey, M. P. (2004). Evaluation of body condition score measured throughout lactation as an indicator of fertility in dairy cattle. Journal of dairy science, 87(8), 2669-2676. |
[11, 6]
. These studies often involve different breeds and management strategies, which may not directly apply to a tropical country like Tanzania. Moreover, the management practices that prove effective in temperate climates may not necessarily translate to hot and humid regions, which are characterized by intense heat stress, limited forage availability, and a unique set of nutritional and physiological demands. Studies on the relationship between BCS and milk yield and quality in cross bred dairy cows in Tanzania are limited. Therefore, this study was conducted to establish the association of body condition score during post calving period with milk yield and composition (milk fat, protein and lactose contents) in cross bred dairy cows reared in humid, high-temperature environments with limited access to quality feed and forage.
2. Materials and Methods
2.1. Study Area
The study was conducted at the Tanzania Livestock Research Institute (TALIRI) and Livestock Institute Training Agency (LITA)-Eastern Zone, Tanga for five months from January 2024 to May 2024. These two farms are located in Tanga city in the north-eastern coast of Tanzania mainland at latitude 5°S and longitude 39°E. The area has a tropical climate characterized by hot temperatures. The rainy season occurs in two periods, October – November and April-May, while the warm and dry season occurs in January-February and the cool and dry season is experienced from June to September. Temperatures range from 20.31 to 33.0°C and average annual rainfall is between 1100 and 1400mm
| [14] | Miyayo, S. F., Owili, P. O., Muga, M. A., & Lin, T. H. (2021). Analysis of pneumonia occurrence in relation to climate change in Tanga, Tanzania. International Journal of Environmental Research and Public Health, 18(9), 4731. |
[14]
.
2.2. Experimental Animals
A total of 102 Holstein Friesian crossbred dairy cows, with live weights ranging from 250 to 450kg, were utilized in this study. The cows were categorized into three groups based on parity: group one included cows with one to two parities (n=23), group two included those with three to four parities (n=24), and group three comprised cows with five or more parities (n=55). In terms of age, the cows were divided into three groups: group one included cows aged 2.5 to 3years (n=7), group two included cows aged 4 to 5years (n=20), and group three consisted of cows aged over 6years (n=75). Additionally, the lactation stages were classified into three categories: group one comprised cows with less than 3 months postpartum (n=40), group two included cows with 4 to 5 months postpartum (n=32), and group three comprised cows with 6 months or more postpartum (n=30).
2.3. Management of Experimental Animals
The cross bred dairy cows were grazed in natural pasture early in the morning from 0730 to 1300 hours. Then each cow was supplemented with 1.0 to 1.5kg of concentrate feeds during milking time and there after continued to graze in the evening from 1600 to 1800 hours and then supplemented with hay. At TALIRI –Tanga farm the concentrate diet was only maize bran while at LITA–Tanga farm the dairy cows were offered a concentrate diet comprised of protein (sunflower seed cake), energy (maize bran), and mineral (Di –calcium phosphate, DCP and dairy premixes). Each lactating cow was provided the supplementary diet twice a day during milking hours early in the morning and in the afternoon. All cows were provided with adlibitum amount of water.
For prevention and control of diseases, routine control measures were done by deworming every three months using anthelminthic drugs (Ivermectine, Albendazole) to control internal parasites and dipping with acaricides once per week to control external parasites such as mites and ticks. Chemoprophylaxis treatments (Diminazene Aceturate) to control tickbone like anaplasmosis and babesiosis and other protozoa diseases such as trypanosomiasis were done.
2.4. Data Collection
2.4.1. Body Condition Score (BCS)
The body condition score for each animal was done through visual observation and palpating body parts on the hind quarter, mainly at the hockbone, pinbone, sacral ligaments and tailhead ligaments (at the anterior coccygeal vertebrae). Fat cover was score by palpating on the shortribs and observing the corrugation of the shortribs. The crossbred dairy cows were scored during milking time in the evening at the start of the experiment and then for every 15 days during experimental period of five months. Body condition was scored using a scale of 1 to 5 points developed by
| [15] | Wildman, E. E., Jones, G. M., Wagner, P. E., Boman, R. L., TrouttJr, H. F., & Lesch, T. N. (1982). A dairy cow body condition scoring system and its relationship to selected production characteristics. Journal of dairy science, 65(3), 495-501. |
| [16] | Edmonson, A. J., Lean, I. J., Weaver, L. D., Farver, T., & Webster, G. (1989). Abody condition scoring chart for Holstein dairy cows. Journal of dairy science, 72(1), 68-78. |
[15, 16]
where by 1=emaciated, 2=thin, 3=average, 4=fat and 5=obese. All animals were scored by the same person. Then the cows were categorized into three groups; group one had BCS ranging from 2.0 to 2.5, BCS for group two ranged from 2.6 to 3.4 and for group three ranged from 3.5 to 4.0.
2.4.2. Milk Yield (MYD)
Milk yield per cow was measured daily in a calibrated bucket and the measurements were recorded in liters for both morning and evening milking sessions. The total daily milk yield was calculated by summing up the morning and evening yields. Weekly and monthly milk yields were subsequently computed and recorded in an Excel sheet for analysis.
2.4.3. Milk Composition
Milk samples were obtained by collecting 15ml of milk from each crossbred dairy cow. The samples were collected twice a month, approximately at two-week intervals i.e. during the middle and end of each month. The samples were taken during milking after two to three strip milking and were collected into vacutainer tubes (each tube with 15ml capacity). These samples were immediately placed in a cool box packed with ice and transported to TALIRI-Tanga Laboratory. At the laboratory, the milk samples were stored in a deep freezer set at a temperature of 4°C until analysis. Before analysis of milk composition, the samples were brought to room temperature (20°C) and then analyzed using the Lactoscan Milk Analyzer (Lactoscan S50) to determine key milk components, including fat, protein, and lactose contents.
2.5 Data Analysis
Descriptive statistics including mean and standard error were computed for body condition score, daily milk yield and milk fat, protein and lactose contents. A general linear model (GLM) procedure of SAS version 9.4
| [17] | SAS Institute. (2019). SAS Certified Professional Prep Guide: Advanced Programming Using SAS 9.4. SAS institute. |
[17]
was used to analyze the quantitative data. Data were analyzed by fitting milk yield and milk composition as dependent variables and farm, age, parity, season, lactation stage, and body condition group as a fixed factor and the results for quantitative variables are expressed as least square means (LSM) ± standard error (SE).
The statistical model used in this study to test the effects of independent variables (farm, body condition score (BCS), age, lactation stage, parity and season) on milk yield and milk composition traits is shown below:
Model:
Yijklm=μ+Ai+Bj+Ck+Dl+(AB)ij+(AC)ik+(AD)il+eijklm
Where:
Yijklm= Dependent variable (daily milk yield or milk fat, protein and lactose contents).
μ=Population mean.
Ai=Fixed effect of BCS (categorized as 1, 2 and 3).
Bj=Fixed effect of lactation stage (categorized as 1, 2 and 3).
Ck= Fixed effect of age group (categorized as 1, 2, and 3).
Dl= Fixed effect of parity (categorized as 1, 2 and 3).
(AB)ij = Interaction effect between BCS and lactation stage.
(AC)ik = Interaction effect between BCS and age.
(AD)il=_Interaction effect between BCS and parity.
eijklm= Random error term, assumed to follow a normal distribution N(0,σ2).
The significance of the differences between pairs of means were assessed by using Duncan’s multiple range test at p=0.05 level of probability and all statistical analyses were performed using SAS version 9.4
| [17] | SAS Institute. (2019). SAS Certified Professional Prep Guide: Advanced Programming Using SAS 9.4. SAS institute. |
[17]
.
To establish the association between BCS and milk yield and milk composition traits, the following multiple linear regression model was applied:
Yijk=β0+β1X1+β2X2+β3X3+β4X4+εijk.
Where:
Yijk=Dependent variable (e.g., milk yield or milk composition traits (milk fat, protein, and lactose contents).
β0= y-intercept.
β1−β4= Partial regression coefficients for the independent variables (slopes, indicating the influence of each factor on the dependent variable).
X1= Body Condition Score (categorized into 3 groups).
X2: Age of the cow (categorized into 3 groups).
X3=Lactation stage (categorized into 3 groups).
X4= Parity i.e. number of times the cow has calved (categorized into 3 groups).
εijk = Random error term, assumed to be independently and identically distributed with N(0,σ2).
3. Results
3.1. Trend of Body Condition Score and Milk Yield and Composition During the Study Period
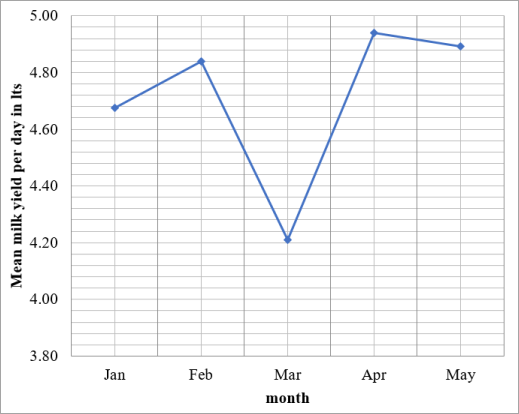
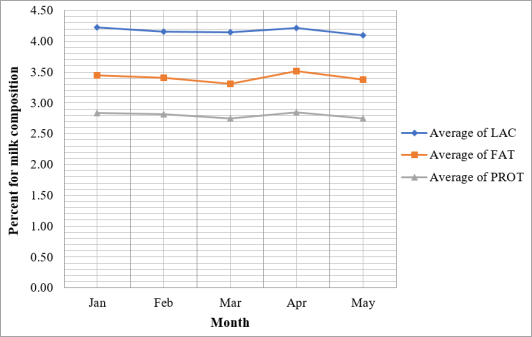
The trends of BCS, daily milk yield and milk composition during the study period (January to May, 2024) are shown in
Figures 1, 2 and 3, respectively. During the study period body condition score of crossbred dairy cows showed an increasing trend, on average from 2.75 ± 0.03 to 3.2 ± 0.03 BCS (
Figure 1). This corresponded with slight increase in daily milk yield from 4.6 to 4.9lts (
Figure 2) and slight decrease in milk composition (
Figure 3). Milk fat, protein and lactose contents decreased from 3.5 to 3.4%, 2.8 to 2.75% and 4.2 to 4.1%, respectively. During the experimental period, the overall average milk yield and milkfat, protein and lactose contents of crossbred dairy cows were 4.70 ± 0.1lts per day, 3.41 ± 0.03%, 2.8 ± 0.02% and 4.17 ± 0.02%, respectively. (
Table 1).
Figure 1. Trends of BCS during the study period.
Figure 2. Trends of daily milk yield during the study period.
Figure 3. Trends of Milk composition during the study period.
Table 1. Overall average BCS, daily milk yield and milk fat, protein and lactose contents during the study period.
Variable | N | Mean ± se |
BCS | 424 | 2.97 ± 0.02 |
MYD (l/day) | 424 | 4.70 ± 0.1 |
FAT (%) | 424 | 3.41 ± 0.03 |
PROTEIN (%) | 424 | 2.80 ± 0.02 |
LACTOSE (%) | 424 | 4.17 ± 0.02 |
N= number of observation, BCS= Body condition score SE= Standard error, % = percentages l/day= liters per day
3.2. Effects of Body Condition Score on Milk Yield and Milk Composition of Cross bred Dairy Cows
The results in
Table 2 revealed that BCS significantly influenced daily milk yield, with all three BSC groups differing significantly from each other. (P≤0.001). Cows with BCS group3 had the highest daily milk yield (5.86 ± 0.48 lts per day), which was significantly higher than that of cows with BCS group 2 (4.69 ± 0.21 lts per day) and BCS group 1 (3.60 ± 0.34 lts per day). Milk fat content also showed significant differences (P≤0.001) among the cows with different BCS groups. Cows with BCS group 3 had the highest milk fat content (3.75%), which was significantly greater than the fat content observed in milk of cows with BCS group 2 (3.40%) and BCS group1 (2.80%). Milk protein and lactose contents did not differ among the cows with different BCS groups. Milk protein content ranged from 2.74% for cows with BCS group1 to 2.96% for cows with BCS group3 while lactose content ranged from 4.08% in cows with BCS group1 to 4.43% in cows with BCS group.
Table 2. Effect of body condition score (BCS) on milk yield and milk composition of crossbred dairy cows.
Variable | Body condition group | P value |
1 | 2 | 3 |
Daily milk yield (lts/day) | 3.60 ± 0.34c | 4.69 ± 0.21b | 5.86 ± 0.48a | 0.0001 |
Milk fat content (%) | 2.80 ± 0.12c | 3.40 ± 0.07b | 3.75 ± 0.48a | 0.0001 |
Milk protein content (%) | 2.74 ± 0.10a | 2.85 ± 0.06a | 2.96 ± 0.13a | 0.0001 |
Milk lactose content (%) | 4.08 ± 0.13a | 4.22 ± 0.08a | 4.43 ± 0.13a | 0.0001 |
a,b,cMeans with different superscripts within row differ significantly at P≤0.0001, lts/day=liters per day,%= percentage
3.3. Effects of Interaction Between Lactation Stage and Body Condition Score on Milk Yield and Milk Composition of Dairy Cows
Table 3 presents the results from the GLM analys is indicating significant interaction (P<0.0001) between BCS and lactation stage on milk yield and composition traits. A cross all lactation stages, cows with higher BCS (group3) consistently produced more milk per day and their milk had higher fat, protein, and lactose contents compared to those with lower BCS (group1). Specifically, for lactation stage 1, the cows with BCS group3 produced higher (P<0.0001) milk yield (7.09 ± 0.59 lts /day) than those with BCS group1 (3.85 ± 0.37 lts /day), the milk yield of cows with BCS group 2 (5.63 ± 0.26 lts /day) being intermediate. A similar pattern was observed in lactation stage2, where by cows with BCS group3 (5.95 ± 0.59 lts/day) had significantly higher yields than those with BCS group1 (4.48 ± 0.46 lts /day). In lactation stage3, the cows with BCS group3 also produced the highest amount of milk (5.84 ± 0.56 lts /day), significantly surpassing those with BCS group1 (3.29 ± 0.52 lts /day). Additionally, milk fat percentage was significantly higher for cows with BCS group3 than those with BCS group1 across all stages of lactation. Similarly, protein content was significantly higher for cows with BCS group3 compared to those with BCS group1. Lactose content followed the same trend, with significantly higher values being observed for cows with BCS group3 compared to those with BCS group1 for all lactation stages.
Table 3. Effect of interaction between body condition score and lactation stage on milk yield and composition.
Variable | Lactation stage1 | Lactation stage 2 | Lactation stage 3 |
| BCS Grp 1 | BCS Grp 2 | BCS Grp3 | BCS Grp 1 | BCS Grp 2 | BCS Grp 3 | BCS Grp 1 | BCS Grp 2 | BCS Grp 3 |
Milk yield day (lts/day) LSM ± SE | 3.85±0.37b | 5.63±0.26a | 7.0±0.59a | 4.48±0.46b | 4.69±0.27ab | 5.95±0.56a | 3.29±0.52b | 4.82±0.30ab | 5.84±0.56a |
%Fat (LSM ± SE) | 3.02±0.14b | 3.48±0.09ab | 3.69±0.22a | 2.73±0.17b | 3.35±0.10ab | 3.89±0.21a | 2.69± 0.19b | 3.50±0.11ab | 3.85±0.21a |
%Protein (LSM ± SE) | 2.68±0.07b | 2.82±0.05ab | 2.7 ±0.11b | 2.70±0.09b | 2.86±0.05ab | 3.02±0.12a | 2.75±0.09ab | 2.78±0.06ab | 3.06±0.11a |
%Lactose (LSM ± SE) | 4.09±0.09b | 4.18±0.07ab | 4.13±0.15ab | 3.98±0.12a | 4.25±0.07ab | 4.41±0.14a | 4.06± 0.13b | 4.10± 0.08b | 4.59±0.14a |
abMeans with different superscripts in the same column are significantly different at P < 0.0001
LSMEANS = Least square means, SE=Standard Error, BCS Grp=Body condition score group
3.4. Effects of Interaction Between Parity and Body Condition Score on Milk Yield and Milk Composition of Dairy Cows
The results in
Table 4 revealed significant interaction between BCS and parity on milk yield and composition, indicating that the effect of BCS on these traits varied a cross different parity levels. For milk yield per day (MYD), in parity1, cows with BCS group 2 had significantly higher yield (5.13 ± 0.29 Liters/day) than those with BCS group1 (3.90 Liters/day), while the milk yield of the cows with BCS group3 (4.66 ± 0.57 Liters/day) was not significantly different from that of those with BCS group1 and group2. In Parity2, cows with BCS group3 had significantly higher yield (7.22 ± 0.75 Liters/day) than the cows with BCS group1 (3.96 ± 0.57 Liters/day) and BCS group2 (4.91 ± 0.39 Liters/day), which were not significantly different from each other. In Parity3, cows with BCS group3 had significantly higher yield (6.99 ± 0.79Liters/day) than those with BCS group1 (3.78 ± 0.59Liters/day), while the milk yield of those with BCSgroup2 (5.11±0.36Liters/day) was not significantly different from the milk yield of either group.
For milk fat content, in parity1, there were no significant differences among the cows with different BCSgroups. In Parity 2, cows with BCS group3 had significantly higher milk fat content (3.88%) than those with BCS group1 (2.98%), while those with BCS group 2 (3.51%) were not significantly different from either group. In Parity 3, cows with BCS group3 had significantly higher milk fat content (4.06%) than those with both BCS group 2 (3.35%) and BCS group1 (2.56%).
For milk protein content, in parity1, no significant differences were observed among the cows with different BCS groups. In Parity2, cows with BCS group1 produced milk with significantly lower protein content (2.62%) than those with BCS group3 (2.84%), while the milk protein content of cows with BCS group2 (2.83%) was not significantly different from that of the cows in either group. In parity3, cows with BCS group3 had significantly higher milk protein content (2.97%) than those with BCSgroup1 (2.61%), while the milk protein content of those with BCS group2 (2.78%) was significantly different from that of both groups.
For milk lactose content, in parity1, cows with BCS group 3 had significantly higher milk lactose content (4.41%) than those with BCS group1 (4.15%), while the milk lactose content of cows with BCS group2 (4.25%) was not significantly different from that of either groups. In parity 2, cows with BCS group1 had significantly lower milk lactose content (3.92%) than those with both BCS group2 (4.13%) and BCS group3 (4.25%), which were not significantly different from each other. In parity3, cows with BCS group3 had significantly higher lactose content (4.52%) than those with BCS group1 (4.07%), while those with BCS group2 (4.15%) were not significantly different from either groups.
Table 4. Effects of interaction between BCS group and parity on milk yield and composition.
Variable | Parity 1 | Parity 2 | Parity 3 |
| BCS Grp 1 | BCS Grp 2 | BCS Grp 3 | BCS group 1 | BCS Grp 2 | BCS Grp 3 | BCS Grp 1 | BCS Grp 2 | BCS Grp 3 |
Milk yield day (lts/day) LSM ± SE | 3.90± 0.40c | 5.13 ±0.29b | 4.66±0.57bc | 3.96±0.57c | 4.91± 0.39b | 7.22 ±0.75a | 3.78±0.59c | 5.11± 0.36b | 6.99±0.79b |
%Fat (LSM ± SE) | 2.91± 0.15c | 3.46±0.11ab | 3.50±0.21ab | 2.98± 0.21c | 3.51±0.14ab | 3.88 ±0.28a | 2.56±0.22c | 3.35 ±0.13b | 4.06±0.29a |
%Protein (LSM ± SE) | 2.90±0.08ab | 2.87±0.05ab | 2.99 ±0.11a | 2.62 ±0.11c | 2.83±0.07ab | 2.84±0.14ab | 2.61±0.11c | 2.78 ±0.67b | 2.97±0.15a |
%Lactose (LSM ± SE) | 4.15±0.10ab | 4.25±0.07ab | 4.41 ±0.14a | 3.92 ±0.15b | 4.13± 0.10b | 4.25±0.19ab | 4.07±0.15b | 4.15±0.10ab | 4.52±0.20a |
abMeans with different superscripts in the same column are significantly different at P<0.0001
LSMEANS=Least square means, SE= Standard Error, BCS Grp=Body condition score groups
3.5. Effects of Interaction Between Age and Body Condition Score on Milk Yield and Milk Composition of Dairy Cows
The GLM analysis results revealed significant interaction between age and BCS on milk production parameters, indicating that the effect of BCS on milk yield and composition traits varied across the age groups. For daily milk yield, in age group1, cows with BCS group3 had significantly higher yield (7.63 ± 1.24lts/day) than the cows with both BCS group2 (5.43 ± 0.55lts/day) and BCS group1 (4.02 ± 0.81lts/day), which were also significantly different from each other (
Table 5).
In age group2, cows with BCS group3 had significantly higher yield (6.45 ± 0.68lts/day) than those with both BCS group2 (4.94 ± 0.34lts/day) and BCS group 1 (3.67 ± 0.53lts/day), which were also significantly different from each other. In age group3, cows with BCS group1 produced significantly lower milk yield (3.93 ± 0.35lts/day) than those with BCS group 2 (4.78 ± 0.22lts/day) and BCS group3 (4.79 ± 0.4lts/day), but the daily milk yields of cows with BCS group2 and BCS group3 were not significantly different from each other (
Table 5).
For milk fat content, in age group1, cows with BCS group3 produced milk with significantly higher fat content (3.88%) than those with both BCS group2 (3.35%) and BCS group1 (2.18%), which were also significantly different from each other. In age group2, the milk of cows with BCS group 3 (3.94%) had significantly higher fat content than those with BCS group1 (2.95%), while the milk fat content of cows with BCS group 2 (3.49%) was not significantly different from either group. In age group3, cows with BCS group3 had significantly higher milk fat content (3.61%) than those withBCS group1 (3.32%), while the milk fat content of cows with BCS group2 (3.49%) was not significantly different from that of either group.
For milk protein content, in age group1, cows with BCS group3 had significantly higher milk protein content (3.00%) than those with BCS group1 (2.58%), while the milk protein content of cows with BCS group2 (2.86%) was not significantly different from either group. In age group2, cows with BCS group1 produced milk with significantly lower protein content (2.67%) than those with BCS group3 (2.96%), while the milk protein content of cows with BCS group2 (2.84%) was not significantly different from either group. In age group3, the milk protein content of cows with BCS group1 (2.88%) and BCS group 2 (2.77%) were significantly lower than that of those with BCS group3 (2.84%), but the milk protein contents of cows with BCS group2 and BCS group3 were not significantly different from each other.
For lactose content, in age group1, cows with BCS group3 had significantly higher milk lactose content (4.61%) than those with BCS group1 (3.98%), while those with BCSgroup (4.13%) were not significantly different from either group. In age group 2, cows with BCS group3 (4.44%) had significantly higher milk lactose content than those with BCS group1 (4.00%), while those with BCS group2 (4.25%) were not significantly different from either group. In age group3, there were no significant differences in milk lactose content among the BCS groups.
These results indicated that the effect of BCS on milk yield and composition did not follow a uniform pattern a cross all ages. The most pronounced differences in milk yield were observed in age groups 1 and 2, where all the three BCS groups were significantly different from each other. Fat percentage was significantly affected by BCS in all age groups, while protein differences were more variable across age groups. Lactose content differences were only significant in age groups 1 and 2, but not in age group 3.
Table 5. EffectsofinteractionbetweenBCSgroupandagegrouponmilkyieldandcomposition.
Variable | AGE Grp 1 | AGE Grp 2 | AGEGrp 3 |
| BCS Grp 1 | BCS Grp2 | BCS Grp 3 | BCS Grp 1 | BCS Grp 2 | BCS Grp 3 | BCS Grp 1 | BCS Grp 2 | BCS Grp 3 |
Milk yield day (lts/day) LSM ± SE | 4.02±0.81bc | 5.43 ±0.55b | 7.63±1.24a | 3.67±0.53c | 4.94 ±0.34b | 6.45±0.68a | 3.93±0.35bc | 4.78±0.22b | 4.79±0.41b |
%Fat (LSM ± SE) | 2.18± 0.30d | 3.35± 0.20b | 3.88±0.46a | 2.95±0.20c | 3.49±0.12ab | 3.94±0.25a | 3.32 ±0.13b | 3.49±0.08ab | 3.61± 0.15a |
%Protein (LSM ± SE) | 2.58± 0.15c | 2.86±0.05ab | 3.00±0.23a | 2.67±0.10b | 2.84±0.06ab | 2.96±0.13a | 2.88±0.07ab | 2.77± 0.04b | 2.84±0.08ab |
%Lactose (LSM ± SE) | 3.98± 0.21b | 4.1 ± 0.14ab | 4.61±0.32a | 4.00±0.13b | 4.25±0.09ab | 4.44±0.17a | 4.15±0.09ab | 4.14±0.06ab | 4.13±0.11ab |
abMeans with different superscripts with in a column are significantly different at P<0.0001
LSMEANS=Least square means, SE=Standard Error, AGEGrp=Age groups, BCSGrp=Body condition score groups
3.6. Association Between Body Condition Score and Milk Yield and Composition
Table 6 presents results from multiple linear regression analysis. The results show that body condition score (BCS) had significant positive influence on milk yield, milk fat, milk protein and milk lactose contents. For each one-unit increase in BCS, daily milk yield increased by 1.24 liter while milk fat, protein and lactose contents increased by 0.54, 0.10 and 0.14 percentage, respectively. Lactation stage (LS) had a significant negative effect on milk yield. Milk yield decreased by 0.47 liter per unit increase in lactation stage. However, its effect on milk fat, protein, and lactose content was not significant (p>0.05). Parity had a significant positive effect on milk yield, with an increase of 0.47 liter per increase of one parity. However, parity did not significantly influence milk fat (p=0.5837). Parity had a small but significant negative effect on milk protein, while its effect on milk lactose was not significant (p=0.8854). Age did not significantly affect milk yield (p=0.1840), milk protein content (p=0.2361), or milk fat content (p=0.0782). However, it had a significant negative effect on milk lactose content. Lactose content decreased by 0.13 percent for each age increase of one year. These results indicate that among the variables tested BCS had the strongest influence on milk yield and composition, with higher BCS being associated with increased milk production and content of milk fat, protein and lactose.
Table 6. The relationship between BCS and milk yield and milk composition (fat, protein, lactose.).
| Milk yield | Milk fat | Milk protein | Milk lactose |
Variable | PE | SE | P | PE | SE | P | PE | SE | P | PE | SE | P |
BCS | 1.24 | 0.23 | <.0001 | 0.54 | 0.08 | <.0001 | 0.10 | 0.04 | 0.0150 | 0.14 | 0.06 | 0.0134 |
LS | -0.47 | 0.11 | <.0001 | 0.004 | 0.04 | 0.9286 | 0.04 | 0.02 | 0.0399 | 0.03 | 0.03 | 0.2243 |
Parity | 0.47 | 0.16 | 0.0048 | -0.03 | 0.06 | 0.583 | -0.07 | 0.03 | 0.0308 | -0.01 | 0.04 | 0.8854 |
Age | -0.30 | 0.23 | 0.1840 | 0.144 | 0.08 | 0.0782 | -0.05 | 0.04 | 0.2361 | -0.13 | 0.06 | 0.028 |
4. Discussion
4.1. Trends of Body Condition Score, Milk Yield and Composition During the Study Period
Body condition score is a widely recognized management tool for assessing energy reserves and nutritional status in dairy cows
| [16] | Edmonson, A. J., Lean, I. J., Weaver, L. D., Farver, T., & Webster, G. (1989). Abody condition scoring chart for Holstein dairy cows. Journal of dairy science, 72(1), 68-78. |
| [18] | Ferguson, J. D., Galligan, D. T., & Thomsen, N. (1994). Principal descriptors of body condition score in Holstein cows. Journal of dairy science, 77(9), 2695-2703. |
| [12] | Alphosus, C., Akpa, G. N., Barje, P. P., Ayigun, E. A., Zanna, M., Olaiya, O.,... & Abdulahi, I. (2014). Effect of post-partum body condition score on milk yield and composition of Friesian x bunaji dairy cows. Animal Research International, 11(2), 2048-2056. |
[16, 18, 12]
. Body condition score plays a critical role in milk production. The results of this study show that during the study period body condition score of cross bred dairy cows increased from low values in the dry season to high values in wet season and corresponded with slight increase in daily milk yield and lactose. This is because during the dry season cross bred dairy cows had low body condition score due to high mobilization of energy reserve to support milk production. The BCS increased after gaining energy reserve during the wet season and resulted into slight increase in milk yield and milk composition. The results of this study are in agreement with the findings reported by
| [1] | Lyimo, Z. C., Nkya, R., Schoonman, L., & VanEerdenburg, F. J. C. M. (2004). Post-partum reproductive performance of crossbred dairy cattle on smallholder farms in sub-humid coastal Tanzania. Tropical Animal Healthand Production, 36, 269-279. |
| [2] | Kurwijila L R, Omore A, Delia G. Tanzania Dairy Industry Overview–2012. Sokoine University of Agriculture10/1/2012. |
| [3] | Cadilhon, J. J., Pham, N. D., & Maass, B. L. (2016). The Tangadairyplatform: Fostering innovations for more efficient dairy chain coordination in Tanzania. International Journal on Food System Dynamics, 7(2), 81-91. |
[1-3]
, who showed that the trend of milk yield increases from less than 4 liters in dry season to more than 8 liters in wet season. This indicates that the energy available for milk production increases in wet season as a result of abundant availability of forage and the ability of dairy cows to reserve energy increases which, in turn, leads to body condition scored increase in cross bred dairy cows.
4.2. Effects of Body Condition Score on Milk Yield and Milk Composition of Crossbred Dairy Cows
BCS is a key indicator of a dairy cow's energy reserves and thus, it influences both milk yield and composition. The present study signifies that better body condition score is associated with high milk yield in cross bred dairy cows. Cows with good BCS had the highest daily milk yield and milk composition than the cows with low BCS. This aligns with the findings from other studies in tropical regions which linked poor BCS to lower milk production and compromised metabolic efficiency
| [19] | Ezanno, P., Ickowicz, A., & Lancelot, R. (2005). Relationships between N'Dama cow body condition score and production performance under an extensive range management system in Southern Senegal: calf weight gain, milk production, probability of pregnancy, and juvenile mortality. Livestock Production Science, 92(3), 291-306. |
| [20] | Mushtaq, A., Qureshi, M., Khan, S., Habib, G., Swati, Z. A., & Rahman, S. U. (2012). Body condition score as a marker of milk yield and composition in dairy animals. Journal of Animal and Plant Sciences, 169-173. |
| [12] | Alphosus, C., Akpa, G. N., Barje, P. P., Ayigun, E. A., Zanna, M., Olaiya, O.,... & Abdulahi, I. (2014). Effect of post-partum body condition score on milk yield and composition of Friesian x bunaji dairy cows. Animal Research International, 11(2), 2048-2056. |
[19, 20, 12]
. Additionally, production of milk is closely related with mobilization of energy reserves
| [10] | Pryce, J. E., Coffey, M. P., & Simm, G. (2001). The relationship between body condition score and reproductive performance. Journal of dairy science, 84(6), 1508-1515. |
[10]
. However, milk protein and lactose contents showed less pronounced changes with variations in BCS, suggesting that these components are more influenced by genetic and dietary factors rather than body energy store alone
| [21] | Stockdale, C. R. (2004). Effects of level of feeding of concentrates during early lactation on the yield and composition of milk from grazing dairy cows with varying body condition score at calving. Australian Journal of Experimental Agriculture, 44(1), 1-9. |
| [22] | Berry, D. P., Macdonald, K. A., Penno, J. W., & Roche, J. R. (2006). Association between body condition score and live weight in pasture-based Holstein-Friesian dairy cows. Journal of dairy research, 73(4), 487-491. |
[21, 22]
. Proper management of energy reserves is critical for economic success in dairy farming, and dairy cows that are either too thin or with excessively stored fat face a risk of decreased milk yield and potential health complications.
4.3. Effects of Interaction Between Lactation Stage and Body Condition Score on Milk Yield and Milk Composition of Dairy Cows
The results from GLM analysis revealed that the effect of BCS on milk yield and fat contents varied across the lactation stage, thus highlighting the need for tailored nutritional management strategies at different lactation stages. The results of the present study show that across all lactation stages, cows with higher BCS consistently produced more milk per day and their milk had higher fat, protein, and lactose contents compared to those with lower BCS. The cross bred dairy cows in early stage of lactation (lactation stage1) and with higher BCS produced the highest amount of milk yield per day. Additionally, the crossbred dairy cows with higher BCS at calving produced more milk during early lactation. This is in agreement with the observation made by other authors who reported that cows in early-lactation mobilize body reserves to meet peak milk production demands
| [10] | Pryce, J. E., Coffey, M. P., & Simm, G. (2001). The relationship between body condition score and reproductive performance. Journal of dairy science, 84(6), 1508-1515. |
| [23] | Jílek, F., Pytloun, P., Kubešová, M., Štípková, M., Bouška, J., Volek, J.,... & Rajmon, R. (2008). Relationships among body condition score, milk yield and reproduction in Czech Fleckvieh cows. Czech Journal of Animal Science, 53(9), 357-367. |
[10, 23]
. However, cows with low BCS struggle to meet lactation demands, leading to lower milk yield and metabolic stress
| [24] | Yang, L. (2009). Phenotypic relationships between milk protein percentage, reproductive performance and body condition score in Irish dairy cattle: athesis presentedin partial fulfillment of the requirements for the degree of Master of Sciences (MSc) at Massey University, Palmers ton North, New Zealand (Doctoral dissertation, MasseyUniversity). |
| [20] | Mushtaq, A., Qureshi, M., Khan, S., Habib, G., Swati, Z. A., & Rahman, S. U. (2012). Body condition score as a marker of milk yield and composition in dairy animals. Journal of Animal and Plant Sciences, 169-173. |
[24, 20]
. Therefore, maintaining adequate pre-and post-calving nutrition is essential to replenish body reserves and sustain milk production efficiency throughout the lactation period.
4.4. Effects of Interaction Between Parity and Body Condition Score on Milk Yield and Milk Composition of Dairy Cows
The present study revealed that the interaction between BCS and parity had significant effects on milk yield and composition, indicating that the effects of BCS on these traits varied across different parity levels. The cross bred dairy cows in parity 3 to 4 with higher BCS had significantly higher average daily milk yield. Cows with parity less than 2 and higher BCS had lower daily milk yield than the cows in all parity levels. Parity influences the efficiency of energy utilization, with multiparous cross bred dairy cows benefiting more from higher BCS than younger cows
| [25] | Piñeyrúa, J. T. M., Fariña, S. R., & Mendoza, A. (2018). Effects of parity on productive, reproductive, metabolic and hormoneal responses of Holstein cows. Animal reproduction nscience, 191, 9-21. |
[25]
. Young primiparous cows allocate more energy toward growth and limit milk production while matured multiparous dairy cows with fully developed mammary glands use their energy reserves more efficiently for lactation
| [11] | Dechow, C. D., Rogers, G. W., Klei, L., & Lawlor, T. J. (2003). Heritabilities and correlations among body condition score, dairy form and selected linear type traits. Journal of dairy science, 86(6), 2236-2242. |
| [10] | Pryce, J. E., Coffey, M. P., & Simm, G. (2001). The relationship between body condition score and reproductive performance. Journal of dairy science, 84(6), 1508-1515. |
| [26] | Epaphras A, Karimuribo E D and Msellem S N 2004: Effect of season and parity on lactation of crossbred Ayrshire cows reared under coastal tropical climate in Tanzania. Livestock Research for Rural Development, Vol.16, Art. #42. Retrieved January 10, 2025, from http://www.lrrd.org/lrrd16/6/epap16042.htm |
[11, 10, 26]
. These findings suggest that BCS management should be adjusted based on parity, ensuring younger cows receive balanced diets for growth and lactation, while older cows get adequate nutrients to maintain sufficient body reserves for sustained milk production.
4.5. Effects of Interaction Between Age and Body Condition Score on Milk Yield and Milk Composition of Dairy Cows
The interaction between age and BCS had significant effects on milk production parameters of cross bred dairy cows, indicating that the effect of BCS on milk yield and composition traits varies across age groups. For daily milk yield, younger cows with higher BCS hadsignificantly higher milk yield than older cows which had the same BCS. The relationship between BCS and age shows that younger cows utilize body reserves more efficiently for milk production, where as older cows with similar BCS do not experience the same level of improvement. This aligns with the findings of previous studies which indicated that metabolic efficiency declines with age, leading to higher maintenance energy demands, reduced feed intake, and declining mammary gland function
| [27] | Fuerst Waltl, B., Reichl, A., Fuerst, C., Baumung, R., & Sölkner, J. (2004). Effect of maternal age on milk production traits, fertility, and longevity in cattle. Journal of dairy science, 87(7), 2293-2298. |
| [28] | Holodova, L. V., Novoselova, K. S., Mikhalev, E. V., Onegov, A. V., & Chirgin, E. D. (2019, August). The effect of age on milk productivity and reproductive qualities of dairy cows. In IOP Conference Series: Earth and Environmental Science (Vol. 315, No. 2, p. 022087). IOP Publishing. |
| [29] | Handcock, R. C., Lopez-Villalobos, N., McNaughton, L. R., Back, P. J., Edwards, G. R., & Hickson, R. E. (2019). Positive relationships between body weight of dairy heifers and their first-lactation and accumulated three -parity lactation production. Journal of dairyscience, 102(5), 4577-4589. |
[27-29]
. Managing BCS in older cows requires additional nutritional support to counteract these in efficiencies, particularly in tropical environments where heat stress and forage variability affect energy balance
| [1] | Lyimo, Z. C., Nkya, R., Schoonman, L., & VanEerdenburg, F. J. C. M. (2004). Post-partum reproductive performance of crossbred dairy cattle on smallholder farms in sub-humid coastal Tanzania. Tropical Animal Healthand Production, 36, 269-279. |
[1].
4.6. Association Between BCS and Milk Yield and Composition of Cross Bred Cows
To gain deeper insights into the relationship between BCS and milk production traits, multiple regression analysis was performed to assess the extent to which variations in BCS influence milk yield and composition. While the previous analysis focused effects of main factors and interaction effects between BCS and main factors such as lactation stage, parity, and age, the regression analysis complemented these findings by providing a measure of the strength of the association, thus enabling precise estimation of the impact of BCS on milk traits. This analytical approach enhances the interpretability of BCS effects, offering a more refined understanding of its role in lactation performance. The findings from this study revealed positive and significant associations between BCS and milk yield, milk fat, protein and lactose contents. The results show that for each one unit increase in BCS, there was an associated increase of 1.24 liters in daily milk yield, 0.54% in milk fat, 0.1% in milk protein and 0.14% in lactose contents. This positive relationship underscores the significant role of body reserves in supporting milk production in crossbred dairy cows. Similar positive association have been reported in previous studies, where a one unit increase in BCS resulted in approximately increase of 1.0 liter in daily milk yield, 0.1% in fat, and 0.1% in protein over a 60-day period
| [21] | Stockdale, C. R. (2004). Effects of level of feeding of concentrates during early lactation on the yield and composition of milk from grazing dairy cows with varying body condition score at calving. Australian Journal of Experimental Agriculture, 44(1), 1-9. |
| [30] | Stocdale, C. R. (2008). Effects of body condition score at calving and feeding various types of concentrate supplements to grazing dairy cows on early lactation performance. Livestock Science, 116(1-3), 191-202. |
| [31] | Berry, D. P., Buckley, F., & Dillon, P. (2007). Body condition score and live-weight effects on milk production in Irish Holstein-Friesian dairy cows. Animal, 1(9), 1351-1359. |
| [32] | Roche, J. R., Lee, J. M., Macdonald, K. A., & Berry, D. P. (2007). Relationships among body condition score, body weight, and milk production variables in pasture-based dairy cows. Journal of dairy science, 90(8), 3802-3815. |
[21, 30-32]
. This study confirms that higher BCS is associated with increased milk yield and fat content, reinforcing the idea that better energy reserves support better lactation performance. An increase in BCS indicates greater energy stored in the body, which enhances milk production and composition in cross bred dairy cows. Conversely, cows with lower BCS exhibit reduced milk yields due to insufficient energy intake from forages, thus requiring them to mobilize body reserves to sustain lactation. These findings highlight the importance of maintaining an optimal BCS to enhance milk yield and composition, ensuring efficient energy utilization and sustained lactation performance in dairy cows.
7. Conclusions
This study confirms that BCS significantly influences milk yield and composition in cross bred dairy cows under tropical conditions. Higher BCS values were associated with increased milk production and milk composition (fat, protein, and lactose), highlighting the importance of maintaining an optimal energy balance through out the lactation period. The effects of BCS varied across lactation stage, parity, and age, reinforcing the need for targeted nutritional management strategies to optimize productivity.
The interaction between body condition score (BCS), age, parity, and lactation stage significantly influence on milk yield and milk composition in cross bred dairy cows. The ability and efficiency of mobilizing energy reserves during early lactation declines as increase in age and number of parities. These findings highlight the importance of considering the combined effects of BCS, age, parity, and lactation stage in establishment of nutritional management strategies that optimizes milk production.
8. Recommendations
Based on the findings of the study it is recommended that dairy cattle farmers and farm managers should regularly monitor BCS and maintain cows within the optimal BCS range (2.8–3.5). Visual assessment of body condition should be integrated into daily herd management, as prominent ribs, sharp hip bones, and lack of fat covering indicate poor energy balance, while excess fat deposition around the tail head and back suggests over feeding and potential metabolic disorders. Nutritional adjustments should be prioritized for cows in early lactation to prevent excessive weight loss and sustain milk yield, while older cows (above six years) require feeding strategies that can counteract decline of metabolic efficiency. Parity-based feeding strategies should be adopted to ensure that younger cows receive balanced nutrition to support both growth and lactation. Additionally, selection for cows with high milk yield persistency without excessive BCS loss should be integrated into breeding programs to enhance productivity. BCS should be used as a key indicator of energy balance to inform feeding and management decisions to ensure sustained milk yield and composition in cross bred dairy cows under tropical conditions. Further research is needed to explore the long-term effects of BCS fluctuations on fertility, metabolic health, and life time milk production in cross bred dairy cows under tropical conditions. Studies should also investigate optimal nutritional strategies for different parity groups to enhance energy balance and milk production efficiency. Additionally, research on the impact of heat stress on BCS and its influence on milk composition would provide valuable insights for improving dairy management in hot, humid climates.
Abbreviations
AGE | Grpt Age Groups |
BCS | Grpt Body Condition Score Goups |
BCS | Body Condition Score |
DAARS | Department of Animal, Aquaculture and Range Sciences |
IGF-1 | Insulin-like Growth Factor-1 |
LAC | Lactose Content in Milk |
LS | Lactation Stages |
LSMEANS | Least Square Means |
MYD | Milk Yield |
N | Number of Observation |
NEB | Negative Energy Balance |
NEFA | Non-esterified Fatty Acid |
P | P-values |
PE | Parameter Estimate |
PROT | Protein Content in Milk |
SE | Standard Error |
TALIRI | Tanzania Livestock Research Institute |
Acknowledgments
The authors wish to acknowledge with gratitude TEAGASC through Maziwa Faida Project for the financial support during the study. We acknowledge the staff of Tanzania Livestock Research Institute (TALIRI), and staff of the Department of Animal, Aquaculture and Range Sciences (DAARS) at SUA for their technical support during data collection and analysis.
Author Contributions
This work was carried out through collaboration among all authors. Author SJG designed the study, collected data, performed the statistical analysis and wrote the first draft of the manuscript. Author ASN and SWC guided author SJG during the design of the study, data collection, data analysis, preparation of the manuscript and read and approved the final manuscript. Author ZCN and PF participated in data collection, performed the statistical analysis, read and correct the manuscript. All authors read and approved the final manuscript.
Conflicts of Interest
The authors declare no conflicts of interest.
References
| [1] |
Lyimo, Z. C., Nkya, R., Schoonman, L., & VanEerdenburg, F. J. C. M. (2004). Post-partum reproductive performance of crossbred dairy cattle on smallholder farms in sub-humid coastal Tanzania. Tropical Animal Healthand Production, 36, 269-279.
|
| [2] |
Kurwijila L R, Omore A, Delia G. Tanzania Dairy Industry Overview–2012. Sokoine University of Agriculture10/1/2012.
|
| [3] |
Cadilhon, J. J., Pham, N. D., & Maass, B. L. (2016). The Tangadairyplatform: Fostering innovations for more efficient dairy chain coordination in Tanzania. International Journal on Food System Dynamics, 7(2), 81-91.
|
| [4] |
McDermott, J. J., Staal, S. J., Freeman, H. A., Herrero, M., & VandeSteeg, J. A. (2010). Sustaining intensification of smallholder livestock systems in the tropics. Livestock science, 130(1-3), 95-109.
|
| [5] |
Roche, J. R., Friggens, N. C., Kay, J. K., Fisher, M. W., Stafford, K. J., & Berry, D. P. (2009). Invitedreview: Body condition score and its association with dairy cow productivity, health, and welfare. Journal of dairy science, 92(12), 5769-5801.
|
| [6] |
Banos, G., Brotherstone, S., & Coffey, M. P. (2004). Evaluation of body condition score measured throughout lactation as an indicator of fertility in dairy cattle. Journal of dairy science, 87(8), 2669-2676.
|
| [7] |
Coffey, M. P., Emmans, G. C., & Brotherstone, S. (2001). Genetic evaluation of dairy bulls for energy balance traits using random regression. Animal Science, 73(1), 29-40.
|
| [8] |
Tedeschi, L. O., Seo, S., Fox, D. G., & Ruiz, R. (2006). Accounting for energy and protein reserve changes in predicting diet-allow able milk production in cattle. Journal of Dairy Science, 89(12), 4795-4807.
|
| [9] |
National Research Council, Committee on Animal Nutrition, & Subcommittee on Dairy Cattle Nutrition. (2001). Nutrient requirements of dairy cattle: 2001. National Academies Press.
|
| [10] |
Pryce, J. E., Coffey, M. P., & Simm, G. (2001). The relationship between body condition score and reproductive performance. Journal of dairy science, 84(6), 1508-1515.
|
| [11] |
Dechow, C. D., Rogers, G. W., Klei, L., & Lawlor, T. J. (2003). Heritabilities and correlations among body condition score, dairy form and selected linear type traits. Journal of dairy science, 86(6), 2236-2242.
|
| [12] |
Alphosus, C., Akpa, G. N., Barje, P. P., Ayigun, E. A., Zanna, M., Olaiya, O.,... & Abdulahi, I. (2014). Effect of post-partum body condition score on milk yield and composition of Friesian x bunaji dairy cows. Animal Research International, 11(2), 2048-2056.
|
| [13] |
Nazhat, S. A., Aziz, A., Zabuli, J., & Rahmati, S. (2021). Importance of body condition scoring in reproductive performance of dairy cows: A Review. Open Journal of Veterinary Medicine, 11(7), 272-288.
|
| [14] |
Miyayo, S. F., Owili, P. O., Muga, M. A., & Lin, T. H. (2021). Analysis of pneumonia occurrence in relation to climate change in Tanga, Tanzania. International Journal of Environmental Research and Public Health, 18(9), 4731.
|
| [15] |
Wildman, E. E., Jones, G. M., Wagner, P. E., Boman, R. L., TrouttJr, H. F., & Lesch, T. N. (1982). A dairy cow body condition scoring system and its relationship to selected production characteristics. Journal of dairy science, 65(3), 495-501.
|
| [16] |
Edmonson, A. J., Lean, I. J., Weaver, L. D., Farver, T., & Webster, G. (1989). Abody condition scoring chart for Holstein dairy cows. Journal of dairy science, 72(1), 68-78.
|
| [17] |
SAS Institute. (2019). SAS Certified Professional Prep Guide: Advanced Programming Using SAS 9.4. SAS institute.
|
| [18] |
Ferguson, J. D., Galligan, D. T., & Thomsen, N. (1994). Principal descriptors of body condition score in Holstein cows. Journal of dairy science, 77(9), 2695-2703.
|
| [19] |
Ezanno, P., Ickowicz, A., & Lancelot, R. (2005). Relationships between N'Dama cow body condition score and production performance under an extensive range management system in Southern Senegal: calf weight gain, milk production, probability of pregnancy, and juvenile mortality. Livestock Production Science, 92(3), 291-306.
|
| [20] |
Mushtaq, A., Qureshi, M., Khan, S., Habib, G., Swati, Z. A., & Rahman, S. U. (2012). Body condition score as a marker of milk yield and composition in dairy animals. Journal of Animal and Plant Sciences, 169-173.
|
| [21] |
Stockdale, C. R. (2004). Effects of level of feeding of concentrates during early lactation on the yield and composition of milk from grazing dairy cows with varying body condition score at calving. Australian Journal of Experimental Agriculture, 44(1), 1-9.
|
| [22] |
Berry, D. P., Macdonald, K. A., Penno, J. W., & Roche, J. R. (2006). Association between body condition score and live weight in pasture-based Holstein-Friesian dairy cows. Journal of dairy research, 73(4), 487-491.
|
| [23] |
Jílek, F., Pytloun, P., Kubešová, M., Štípková, M., Bouška, J., Volek, J.,... & Rajmon, R. (2008). Relationships among body condition score, milk yield and reproduction in Czech Fleckvieh cows. Czech Journal of Animal Science, 53(9), 357-367.
|
| [24] |
Yang, L. (2009). Phenotypic relationships between milk protein percentage, reproductive performance and body condition score in Irish dairy cattle: athesis presentedin partial fulfillment of the requirements for the degree of Master of Sciences (MSc) at Massey University, Palmers ton North, New Zealand (Doctoral dissertation, MasseyUniversity).
|
| [25] |
Piñeyrúa, J. T. M., Fariña, S. R., & Mendoza, A. (2018). Effects of parity on productive, reproductive, metabolic and hormoneal responses of Holstein cows. Animal reproduction nscience, 191, 9-21.
|
| [26] |
Epaphras A, Karimuribo E D and Msellem S N 2004: Effect of season and parity on lactation of crossbred Ayrshire cows reared under coastal tropical climate in Tanzania. Livestock Research for Rural Development, Vol.16, Art. #42. Retrieved January 10, 2025, from
http://www.lrrd.org/lrrd16/6/epap16042.htm
|
| [27] |
Fuerst Waltl, B., Reichl, A., Fuerst, C., Baumung, R., & Sölkner, J. (2004). Effect of maternal age on milk production traits, fertility, and longevity in cattle. Journal of dairy science, 87(7), 2293-2298.
|
| [28] |
Holodova, L. V., Novoselova, K. S., Mikhalev, E. V., Onegov, A. V., & Chirgin, E. D. (2019, August). The effect of age on milk productivity and reproductive qualities of dairy cows. In IOP Conference Series: Earth and Environmental Science (Vol. 315, No. 2, p. 022087). IOP Publishing.
|
| [29] |
Handcock, R. C., Lopez-Villalobos, N., McNaughton, L. R., Back, P. J., Edwards, G. R., & Hickson, R. E. (2019). Positive relationships between body weight of dairy heifers and their first-lactation and accumulated three -parity lactation production. Journal of dairyscience, 102(5), 4577-4589.
|
| [30] |
Stocdale, C. R. (2008). Effects of body condition score at calving and feeding various types of concentrate supplements to grazing dairy cows on early lactation performance. Livestock Science, 116(1-3), 191-202.
|
| [31] |
Berry, D. P., Buckley, F., & Dillon, P. (2007). Body condition score and live-weight effects on milk production in Irish Holstein-Friesian dairy cows. Animal, 1(9), 1351-1359.
|
| [32] |
Roche, J. R., Lee, J. M., Macdonald, K. A., & Berry, D. P. (2007). Relationships among body condition score, body weight, and milk production variables in pasture-based dairy cows. Journal of dairy science, 90(8), 3802-3815.
|
Cite This Article
-
APA Style
Goodluck, S. J., Nguluma, A. S., Nziku, Z. C., French, P., Lugeye, S., et al. (2025). Body Condition Score as an Indicator for Milk Yield and Milk Composition of Crossbred Dairy Cattle Reared in Tanga, Tanzania. Animal and Veterinary Sciences, 13(3), 71-82. https://doi.org/10.11648/j.avs.20251303.13
 Copy
|
Copy
|
 Download
ACS Style
Goodluck, S. J.; Nguluma, A. S.; Nziku, Z. C.; French, P.; Lugeye, S., et al. Body Condition Score as an Indicator for Milk Yield and Milk Composition of Crossbred Dairy Cattle Reared in Tanga, Tanzania. Anim. Vet. Sci. 2025, 13(3), 71-82. doi: 10.11648/j.avs.20251303.13
Copy
|
Download
AMA Style
Goodluck SJ, Nguluma AS, Nziku ZC, French P, Lugeye S, et al. Body Condition Score as an Indicator for Milk Yield and Milk Composition of Crossbred Dairy Cattle Reared in Tanga, Tanzania. Anim Vet Sci. 2025;13(3):71-82. doi: 10.11648/j.avs.20251303.13
Copy
|
Download
-
@article{10.11648/j.avs.20251303.13,
  author = {Samson Jonass Goodluck and Athumani Shabani Nguluma and Zabron Cuthibert Nziku and Padreig French and Sizya Lugeye and Sebastian Wilson Chenyambuga},
  title = {Body Condition Score as an Indicator for Milk Yield and Milk Composition of Crossbred Dairy Cattle Reared in Tanga, Tanzania
},
  journal = {Animal and Veterinary Sciences},
  volume = {13},
  number = {3},
  pages = {71-82},
  doi = {10.11648/j.avs.20251303.13},
  url = {https://doi.org/10.11648/j.avs.20251303.13},
  eprint = {https://article.sciencepublishinggroup.com/pdf/10.11648.j.avs.20251303.13},
  abstract = {Smallholder dairy farmers in Tanzania predominantly keep crosses of Boran/Zebu and Friesian/Jersey/Ayrshire for income generation and household nutrition. However, in coastal areas hot and humid environment presents challenges for dairy production such as limited access to quality feed which lead to frequent cases of negative energy balance (NEB). Body Condition Score (BCS) is a key management tool for assessing energy reserves and metabolic status, yet information on its relationship with milk yield and composition in Tanzanian crossbred dairy cows is lacking. This study aimed at evaluating the association between BCS and milk yield and milk composition during the postpartum period in crossbred dairy cows raised under hot and humid tropical conditions. Atotal of 102 crossbred dairy cows from TALIRI and LITA farms were monitored over five months. BCS of each cow was scored based on a five – point scale (1=Emaciated and 5=Obese). The BCS scores were categorized into three groups, with group one, two and three having scores of 2.0 to 2.5, 2.6 to 3.4 and 3.5 to 4.0, respectively. Milk yield and composition (fat, protein and lactose contents) were measured daily and twice per month, respectively. Results revealed significant effects of BCS on milk yield and composition (p 0.05) among the BCS groups. Body condition score had significant and positive correlations with milk yield, milk fat, milk protein and milk lactose contents. A one unit increase in BCS was associated with an increase of 1.24 liters for daily milk yield, 0.54% for milk fat, 0.1% for milk protein and 0.14% for lactose. These findings under score the critical role of maintaining optimal BCS to enhance milk production and quality in cross bred dairy cows. Therefore, smallholder dairy farmers should ensure that their cows achieve and maintain optimal BCS for sustained productivity.
},
 year = {2025}
}
Copy
|
Download
-
TY  - JOUR
T1  - Body Condition Score as an Indicator for Milk Yield and Milk Composition of Crossbred Dairy Cattle Reared in Tanga, Tanzania

AU  - Samson Jonass Goodluck
AU  - Athumani Shabani Nguluma
AU  - Zabron Cuthibert Nziku
AU  - Padreig French
AU  - Sizya Lugeye
AU  - Sebastian Wilson Chenyambuga
Y1  - 2025/06/19
PY  - 2025
N1  - https://doi.org/10.11648/j.avs.20251303.13
DO  - 10.11648/j.avs.20251303.13
T2  - Animal and Veterinary Sciences
JF  - Animal and Veterinary Sciences
JO  - Animal and Veterinary Sciences
SP  - 71
EP  - 82
PB  - Science Publishing Group
SN  - 2328-5850
UR  - https://doi.org/10.11648/j.avs.20251303.13
AB  - Smallholder dairy farmers in Tanzania predominantly keep crosses of Boran/Zebu and Friesian/Jersey/Ayrshire for income generation and household nutrition. However, in coastal areas hot and humid environment presents challenges for dairy production such as limited access to quality feed which lead to frequent cases of negative energy balance (NEB). Body Condition Score (BCS) is a key management tool for assessing energy reserves and metabolic status, yet information on its relationship with milk yield and composition in Tanzanian crossbred dairy cows is lacking. This study aimed at evaluating the association between BCS and milk yield and milk composition during the postpartum period in crossbred dairy cows raised under hot and humid tropical conditions. Atotal of 102 crossbred dairy cows from TALIRI and LITA farms were monitored over five months. BCS of each cow was scored based on a five – point scale (1=Emaciated and 5=Obese). The BCS scores were categorized into three groups, with group one, two and three having scores of 2.0 to 2.5, 2.6 to 3.4 and 3.5 to 4.0, respectively. Milk yield and composition (fat, protein and lactose contents) were measured daily and twice per month, respectively. Results revealed significant effects of BCS on milk yield and composition (p 0.05) among the BCS groups. Body condition score had significant and positive correlations with milk yield, milk fat, milk protein and milk lactose contents. A one unit increase in BCS was associated with an increase of 1.24 liters for daily milk yield, 0.54% for milk fat, 0.1% for milk protein and 0.14% for lactose. These findings under score the critical role of maintaining optimal BCS to enhance milk production and quality in cross bred dairy cows. Therefore, smallholder dairy farmers should ensure that their cows achieve and maintain optimal BCS for sustained productivity.

VL  - 13
IS  - 3
ER  -
Copy
|
Download