Research Article | | Peer-Reviewed

Drivers of Financial Performance of Top Real Estate Companies in India and Singapore - A Comparative Analysis

Received: 7 February 2025     Accepted: 3 March 2025     Published: 21 March 2025
Views:       Downloads:
Abstract

The Indian and Singaporean real estate markets are among the top investment destinations in the Asia-Pacific region, attracting significant foreign equity investments. This study provides a comparative analysis of the financial performance drivers of top real estate companies in India and Singapore. Through statistical analysis, key differences in financial structures, capital utilization, and profitability drivers were identified. The findings reveal that Return on Capital Employed (ROCE) significantly influences net profitability in both markets, though other financial ratios exhibit varying impacts. For Indian real estate firms, stock turnover ratio and debtor turnover ratio are critical determinants of financial performance, whereas for Singaporean firms, liquidity management (current ratio) and macroeconomic conditions (inflation) play a more significant role. The study also highlights that Indian firms maintain a more balanced capital structure, while Singaporean companies exhibit higher leverage and operational efficiency. Moreover, statistical tests indicate that the mean differences in net profitability ratio, current ratio, debt-to-capital employed ratio, and creditors' turnover ratio between Indian and Singaporean real estate companies are insignificant. However, significant differences exist in debt-equity ratio, stock turnover ratio, debtor turnover ratio, and ROCE. While FDI growth rates are comparable between the two countries, inflation rates vary significantly, impacting investment decisions and cost structures. The study suggests that Indian firms should enhance inventory turnover and debtor management, whereas Singaporean firms should optimize leverage and capital efficiency. Policymakers in India should focus on transparent debt management practices, while Singaporean authorities should regulate high leverage levels to mitigate financial risks. Future research should incorporate a broader dataset, including commercial and residential real estate segments, and analyze the impact of additional macroeconomic factors such as interest rates, housing demand, and government policies. These insights offer valuable recommendations for companies, investors, and policymakers to strengthen financial stability and improve market competitiveness in the real estate sector of India and Singapore.

Published in International Journal of Accounting, Finance and Risk Management (Volume 10, Issue 2)
DOI 10.11648/j.ijafrm.20251002.12
Page(s) 94-110
Creative Commons

This is an Open Access article, distributed under the terms of the Creative Commons Attribution 4.0 International License (http://creativecommons.org/licenses/by/4.0/), which permits unrestricted use, distribution and reproduction in any medium or format, provided the original work is properly cited.

Copyright

Copyright © The Author(s), 2025. Published by Science Publishing Group

Keywords

India, Singapore, Real Estate, Profitability, GDP, Inflation, Financial Variables, Return on Capital Employed

1. Introduction
According to Knight Frank Report India’s construction sector is the second largest employment generator with 7.1 crores workforce employed in the year 2023 and it is estimated that it will cross 10 crores by 2030 . As per Figure 1 the real estate market in India is 46.76 trillion USD and is expected to reach 51.55 trillion USD by 2029 . Some of the key growth drivers for Indian real estate sectors are increase in annual growth of population by 1% approximately, rise in urban population, start-ups etc.…. . India’s population is equivalent to 17.78% of the total world’s population, with 29 years as median age (45) which implies that the ratio of working age population is yet to peak. India’s urban population was 35.87% of total population in the year 2022, which increased to 36.36% in the year 2023 . India’s job market is also extremely driven by various economic activities like growing start-ups, new technologies, new business expansions, which increased the demand for skilled labours, new residentials and office spaces. The Indian real sector is expected to expand to US$ 5.8 trillion by 2047 . As on 2024, real estate contributed 7.3% of India’s GDP and it is estimated that it will increase to 15.5% by 2047. The capital expenditure on core infrastructure has also increased from 0.5% of GDP 2013 to 2.2% in 2023 and India’s GDP is estimated to be USD 5723.29 billion by 2029 (Figure 2) . In fact according to Colliers Report (2023), Indian real estate also received cumulative foreign institutional inflows of $ 26.6 billion from 2017 till 2022, which is a threefold rise from the proceeding 6 years. Hence India is also a preferred choice for global investors and investment across various asset classes in real estate sector have seen promising inflow in the last few years . Many international players are entering the Indian real estate market, either through joint venture or direct investment, bringing capital, expertise and technology. According to High Powered Expert Committee (HPEC), investment in urban infrastructure is anticipated to rise from 0.7% of GDP 2011-12 to 1.1 percent by 2031-32 and due to government support, sustainable development and advanced technology growth of real estate sector is promising (Figure 3). A study suggested that immovable economy is regulated by rules that vary from equity market, foreign direct investment, inflation rate and interest rate. Individual from India were surveyed to find out the perception, feelings and beliefs on the factors that positively influences the propensity of investors to invest in real estate market. It was found out that investment expertise of investment, investor knowledge of neutral information, investors motivation from an advisor and family positive influences that Indian propensity to invest in real estate market .
Source:

Download: Download full-size image

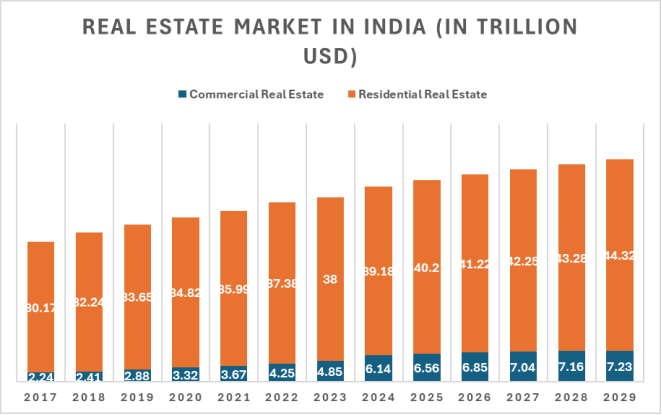
Figure 1. Real estate Market in India (In Trillion USD).
Source:

Download: Download full-size image

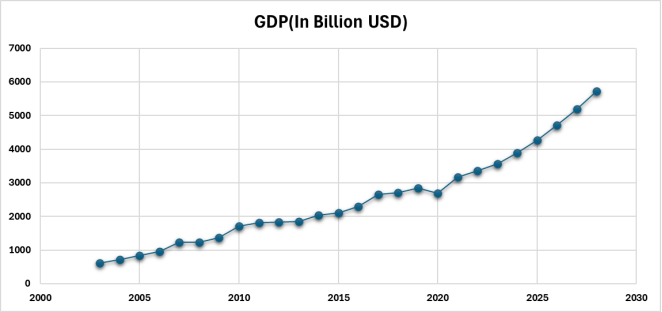
Figure 2. India’s GDP (In Billion USD).
Source:

Download: Download full-size image

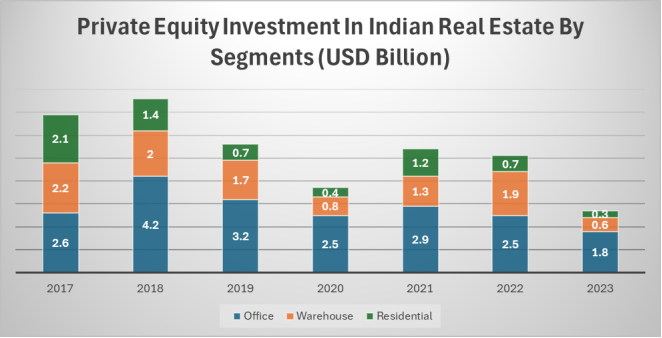
Figure 3. Private Equity Investment In Indian Real Estate By Segment (USD Billion).
According to Coldwell Banker Richard Ellis (CBRE) 2025 Asian Pacific Investor Intensions survey report there in an improvement in net buying intension across Asia Pacific (APAC) region. Mumbai and Delhi have been ranked as top most preferred market for cross border investment amongst APAC countries . Overall sentiment for investment in real estate increased from 5% in 2024 to 13% in 2025, due to interest rate cut and asset reprising. Amongst top 10 APAC countries, Mumbai ranked 5th after Tokyo, Sydney, Singapore and Ho Chi Minh City and Delhi was 8th after Seoul, Osaka and Hanoi. Singapore is one of the top most preferred investment destination mainly because of stability, development, robust economy, political stability and a skilled workforce. The GDP of Singapore is expected to reach 670.94 USD billion which typically correlates with economic expansion, increased business activity, job creation and income levels. The Singapore Real Estate market expected to reach a projected value of 2.12 trillion US$ by 2026 (figure 4), where residential market will dominate the market. It has been anticipated that Singapore real estate market will experience an annual growth rate of 1.99% between the year 2025 to 2029 resulting in the market volume of US$ 2.24 trillion by 2029 . This is driven by several key factors like evolving economic landscape and demographic trends. Singapore government initiative of Housing Development Board (HDB) aims to enhance accessibility and promoting home ownership to a broader segment of the population. This has resulted in one of the highest homeownership rates globally, exceeding 80% among citizens (“Singapore Real Estate Market Size & Trends,” 2025). Due to Singapore favourable policies implemented by government for real estate, it attracts foreign investments, promote infrastructure development and streamlined regulatory processes. According to a study in Singapore firms with significant real estate portfolio would outperform on stock market on a risk adjusted return basis with a similar firm (in the same industry) without any or have little real estate in their balance sheet.
Source:

Download: Download full-size image

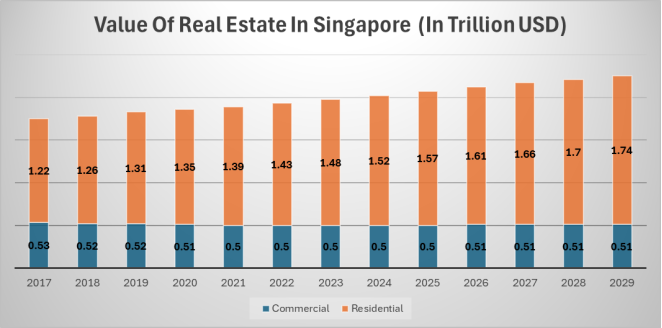
Figure 4. Value of Real Estate in Singapore (In Trillion USD).
Source:

Download: Download full-size image

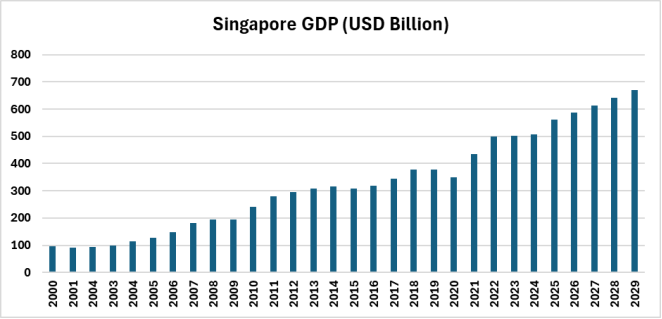
Figure 5. Singapore GDP (In USD Billion).
Hence, India and Singapore being in top 10 APAC countries and one of the preferred destinations for investors in real estate, analyzing the top real estate companies’ financial performance and comparing them can be an important contribution in the literature. This study aims to analyze the financial performance of top real estate companies of India and Singapore and compare them using some macro-economic variables like GDP, inflation etc.….
2. Literature Analysis
This section the paper aims to analyze the previous literature related to real estate development, macro-economic variables and financial variables impacting real estate industry.
2.1. Real Estate and Economy
According to in China appreciation of house price investment in real estate development leads to growth of non-real estate industries and total fixed assets which contributes to the future GDP, but any suppress in the housing investment leads to decrease of GDP growth rate. Hence it was found out that during housing boom period, crowding in affect played a central role, where housing appreciation speculation leads to increased investment and GDP growth, but when the boom turns bust, housing speculation magnifies the crowding out affect. There can be oversupply, over investment and over borrowing which significantly elevates the downside risk of GDP growth. It was also found out that housing price bubble is prevalent in China especially in first -tier cities. Housing price bubble leads to decreased consumptions by residents. In China, housing bubble stimulate economic growth in an early stage, but with gradual elevation of urbanization and industrialization, the crowding out affects of housing bubbles become more evident. a study conducted with an objective of analysing relationship between real estate development and private investment in China. Using the data of 31 province from China for the year 2003 till 2015, it was estimated that development of real estate industry has a significant impact on the level of private investment and showed a “Inverted U- shaped” relationship. At a moderate level real estate development can boost private investment, while in the case of over development, it can have inhibitory effect of private investment. According to , in China four sector participation in the real estate promotes rise of real estate price in both local and other cities with spatial contagion affect. The real estate price fluctuation, the local government land revenue, the bank credit provided to real estate industry, the demand in the local city and real estate developers investments in the other cities increases the local financial real estate risk can leads to strong spatial diffusion affect amongst the city. A study also suggested to reform the current real estate tax system and establish the real estate tax system suitable for China’s national conditions . Design optimization and integration of real estate tax proposed can solve the problem of double taxation, stabilize local financial revenues and promote rational allocation of social wealth. Government can get sufficient funds and can devote money for economic development, reduces barrier to market entry and over reliance on banks for lending. An early warning model was also suggested for Chinese real estate market based on RBF neural network technology . Multiple indicators were collected according to influencing factors and the financial data of 86 real estate listed companies from 2016 to 2020 which helps to give early warning for real estate debt crisis and development of real estate companies. In fact, even for Bosnia and Herzegovina macroeconomic factors impacts the real estate price. Using the data for the year 2007 to 2019 from the point of view of value work done in construction sector household final consumption expenditure, GDP per capita, nominal GDP, interest rate, household deposit and GDP growth rate impacts the real estate price. From the point of new construction, household final consumption expenditure, GDP per capita, nominal GDP, interest rate, household deposits and GDP growth rate significantly impacts the real estate price . Canadian real estate market was analyzed using historical house prices from the Indian Real Estate Sector. It was found out that real estate bubble is likely to develop in Canada due to quick and continuous growth in real estate price in several states and major cities and corruption index indicates a lack of market openness. Business Survey Index indicated that entrepreneurs and consumer lack confidence in the future industrial activities of Canada . A correlation between housing prices and socio-economic influencing factors in 5 Spanish metropolitan cities was analysed and it was found out that there is a functional relationship between housing prices and different factors like population income capacity, market rents, unemployment level and number of mortgages. As per the analysis, housing prices are expected to rise in the metropolitan areas of Barcelona, Bilbao, and Santiago de Compostela. Conversely, a slight decline in housing prices is anticipated in the Valencia metropolitan area. In Madrid, the future trajectory of housing prices is closely linked to fluctuations in unemployment levels, highlighting the potential impact of robust welfare policies on the housing market. Based on these findings, Barcelona, Bilbao, and Santiago de Compostela emerge as the most favourable regions for investment, offering lower risk and promising future property value appreciation . For Lithuanian real estate market population density and employment significantly influence the housing market, as individuals without economic activity are less likely to afford housing. Key housing characteristics, such as the purchased area and total housing space, also play an important role. Additionally, the formation of new families, driven by births, is a critical factor influencing housing demand . Even in Vietnam post covid -19 due to real estate bubble is being witnessed due to immigrations, real estate bubble, economic growth, inflation, interest rate, money supply, credit growth and stock indexes. It has been suggested to regulate migration rate, enhance quality of staff, control inflation, tightening monetary policy . To further support the findings using the data of 12 countries for the time frame 2013 till 2021 GDP per capita, inflation, investment, Quality of Life Index and safety index significantly impacts real estate prices and availability. GDP per capita, safety index, and investments show a positive correlation with real estate prices and affordability ratios. In contrast, the Quality-of-Life Index, population, and inflation rate exhibit a negative correlation, highlighting the complex interplay of these factors in shaping real estate market dynamics .
2.2. Real Estate and Financial Variables
Using the spatial Durbin Watson model, Chinese financial real estate risk was evaluated due to various real sector participation in real estate, because it can overcome the biased results bought about by the omission of possible spatial dependence. It was found out that the rise in real estate prices in both local cities and other cities is driven by the combined influence of local government land revenues, bank credit, investment expansion by real estate developers, and real estate demand from individuals and households. This highlights the spatial spillover effects of these four sectors on real estate prices across 35 large and medium-sized cities in China. Fluctuations in real estate prices, local governments’ land revenues, bank credit to the real estate sector, and market demand contribute to increasing financial real estate risks in the 35 large and medium-sized cities in China. However, investments by real estate development enterprises have the opposite effect, mitigating these risks. The four sectors exhibit significant spatial interactions in their impact on financial real estate risks across these cities. Specifically, investments by real estate development enterprises in one city increase financial real estate risks in other cities due to the diffusion effects of soaring property prices. Conversely, local governments’ land revenues, bank credit to the real estate sector, and market demand reduce risks in other cities through the substitution effects of funds and resources between cities . Large number of non-listed property funds from 2001 to 2007 using a panel data framework was analysed to identify the key drivers of total returns across funds, sectors, countries, and time periods. The most robust findings highlight the influence of a weighted factor comprising country and property sector direct returns, gearing, and distribution yield. Additionally, fund characteristics such as size, investment style, overall economic performance, and the performance of competing asset classes were found to significantly impact fund performance . According to a findings due to Russian aggression against Ukraine, caused rapid changes in the economy in European countries which led to increase in price and cost of capital. Listed real estate companies of European Economic Area in the year 2019 to 2022 was analysed which highlighted the significant impact of inflation on the financial performance of real estate firms. While the overall financial situation of the analyzed companies showed signs of improvement in the first half of 2022, further analysis reveals contrasting trends based on inflation levels in different countries. In countries with relatively low inflation, there were clear increases in sales and profitability . Conversely, in economies experiencing high inflation, real estate companies exhibited lower activity levels and reduced profitability, indicating a direct negative correlation between inflation and the financial efficiency of companies in the real estate sector. Using a dataset of 570 firm-year observations from construction companies listed on the South Korean stock market between 2007 and 2022, the analysis reveals that highly leveraged companies are more likely to engage in real estate project financing (PF) investments. Financially strained construction firms favors PF investments as they allow guarantees to be recorded as contingent liabilities, thereby avoiding the recognition of additional debt on their financial statements. The study also finds that the positive relationship between leverage and real estate PF investments becomes stronger with increasing managerial overconfidence. Overconfident managers tend to overestimate future project revenues and the potential benefits of business developments, leading to riskier investment decisions, even under unfavourable borrowing conditions . According to a study in China Digital inclusive finance effectively reduces real estate market speculation. While digital inclusive finance curbs speculation within a local city, it simultaneously stimulates speculation in neighboring cities. This is attributed to the siphon effect of digital finance advancements and the spillover of housing investment funds to adjacent areas . Digital inclusive finance has the strongest inhibitory effect on real estate speculation in the eastern region, followed by the central region, whereas no significant effect is observed in the western region. This variation is linked to the higher economic development and robust internet infrastructure in the eastern and central regions, allowing them to fully capitalize on the benefits of the digital economy. This was analyzed using regression analysis and the spatial Durbin model, with a focus on regional heterogeneity. According to the findings there is a close relationship between investment taxation and real estate market and taxes, local communities, public policies and economic development. In Italian real estate market taxation on real estate affects possession, transfers and income. Highest returns in the real estate sector are achieved by entities operating systematically as companies (legal persons). However, for small investors, such as families, opting for the flat tax system can result in higher returns . The study also conducted a sensitivity analysis by varying tax rates—covering possession, income, and transfer taxes—and examining the resulting changes in the minimum profitability threshold. The findings suggest that within the current tax framework, tax policy interventions to stimulate the real estate market and encourage investment should focus on reducing income taxes. But according to another study in Chinese real estate market, real estate taxes promote economic growth, enhance household consumption, and mitigate household leverage and asset bubble risks through the suppression of housing prices and redistribution effects . In the short term, real estate taxes do not exacerbate systemic financial risks, maintaining financial stability. For an Indian real estate industry there is a strong positive significant relationship between sales of real estate industry and GDP. It was also found out that for the year 1995-96 till 2014-15 Profit margins against total income have been consistently declined, Profitability as a ratio of capital employed is on a downward trend, Asset utilization indicates a rising trend in expenditure and the industry is struggling to provide only minimal returns .
Hence from the above literature review it is quite evident that number of research has been conducted to analyse the economic factors impacting real estate industry in China, Vietnam, Bosnia etc… and there has been studies related to financial variables impacting real estate industry . Recently, no significant study has been conducted to analyse the financial variables from financial statements impacting the performance of top real estate companies in India and Singapore. This study aims to:
1. Identify and compare the financial performance drivers of top real estate companies in India and Singapore.
2. Analyze and compare the impact of macroeconomic variable like GDP and financial indicators on the financial performance of top real estate companies of Singapore and India.
3. Suggesting significant variables impacting real estate sector in India and Singapore.
3. Research Methodology
For the current research paper, three major companies in India and Singapore have been selected based on market capitalisation . From Indian list of top real estate companies market capitalisation wise as on March 2024, 3 companies DLF, Macrotech and Godrej Properties was selected. The market capitalisation of DLF was Rs 2080.87 billion, Macotech developer Rs 1019.23 billion and Godrej Property wasRs 603.07 billion as on March 2024. From Singapore list of top real estate companies market capitalisation wise as on July 2024, top 3 companies are CapitaLand, UOL Group and Fraser properties. The market capitalisation of CapitaLand Ltd is $15.51 billion, for UOL group it is $ 3.26 billion and for Fraser property it is $2.27 billion as on July 2024. The financial data for each company was taken from the respective annual report published on their website. For few companies, last 20 years data was found, whereas for few companies only 3 years published annual report was found on the website. From the financial statement of each year for different companies’ data was collected and following ratios were calculated: -
a. Net Profitability Ratio as it helps to measure ccompany’s ability to generate profit from its total revenue after deducting all expenses.
b. Current ratio it helps to assess liquidity position of the business that measure the company’s ability to pay its short-term obligations.
c. Debt equity ratio it measures how much debt a company is using to finance its operations relative to equity.
d. Debt to capital employed measures proportion of debt used to finance company’s’ operation relative to its total capital.
e. Stock turnover ratio efficiency a firm converts its inventory to sales.
f. Debtors’ turnover ratio measure the total number of time debtors outstanding balance is collected as cash during a year.
g. Creditors turnover ratio determines how efficiently business pays its creditors.
h. Return on capital employed it helps to assess the return that a company or business generates with respect to its capital employed.
The descriptive statistics for each financial ratio was calculated using Ms excel . The Table 1 and Table 2 below depicts its descriptive statistics of Indian and Singapore companies respectively.
Table 1. Descriptive Statistics of Indian Selected Companies.

Company

Statistics

Profitability Ratio

Current ratio

Debt Equity Ratio

Debt Capital Employed

Stock Turnover

Debtors Turnover

Creditors Turnover

ROCE

DLF

Mean

0.32

5.79

0.707

0.74

0.37

27.45

4.34

0.02

Median

0.28

2.22

0.27

0.30

0.37

17.63

4.05

0.02

Std Deviation

0.22

9.38

1.4

1.45

0.09

28.65

1.93

0.014

Macrotech

Mean

0.02

1.34

0.16

0.26

0.28

12.7

0.91

0.006

Median

0.02

1.4

0.18

0.25

030

12.5

0.17

0.005

Std Deviation

0.07

0.20

0.06

0.24

0.04

2.86

0.35

0.013

Godrej Properties

Mean

0.11

1.54

0.16

0.21

0.77

6.89

0.36

0.019

Median

0.16

1.42

0.16

0.26

0.58

5.36

0.32

0.02

Std Deviation

0.12

0.54

0.14

0.14

0.67

4.76

0.23

0.017

Table 2. Descriptive Statistics of Singapore Selected Companies.

Company

Statistics

Profitability Ratio

Current ratio

Debt Equity Ratio

Debt Capital Employed

Stock Turnover

Debtors Turnover

Creditors Turnover

ROCE

CapitaLand

Mean

0.11

1.05

7.67

0.87

0.82

2.01

1.03

0.40

Median

01.6

1.12

7.39

0.88

0.79

2.07

0.96

0.22

Std Deviation

0.27

0.35

2.15

0.02

0.09

01.4

0.14

0.54

UOL Group

Mean

0.44

2.27

2.51

0.68

1167.2

9.13

6.96

0.22

Median

0.32

2.01

2.38

0.70

809.06

6.48

5.22

0.16

Std Deviation

0.29

0.911

0.97

0.10

1269.9

4.78

8.3

01.2

Fraser Property

Mean

0.29

1.87

7.10

0.86

730.13

6.39

1.88

0.13

Median

0.28

1.83

6.64

0.86

772.5

6.41

2.06

0.10

Std Deviation

0.11

0.57

2.6

0.05

221.79

2.23

0.79

0.09

For Indian real estate selected companies DLF demonstrates the highest profitability (0.32) but also has the highest leverage, with a debt-equity ratio of 0.707. Meanwhile, Macrotech struggles with low profitability (0.02) and stock turnover (0.28), indicating weaker operational efficiency. Godrej Properties, on the other hand, exhibits balanced financial health, with a strong stock turnover ratio (0.77) and moderate leverage. Liquidity-wise, DLF has an excessively high current ratio (5.79), which suggests inefficient capital utilization, whereas Macrotech (1.34) and Godrej Properties (1.54) maintain more optimal liquidity levels. In terms of operational efficiency, DLF has the highest debtor turnover (27.45), ensuring faster cash inflow, but Macrotech (12.7) and Godrej (6.89) lag behind. While DLF and Godrej have similar return on capital employed (ROCE) at 0.02, Macrotech has the lowest (0.006), reflecting weaker capital efficiency. On the other hand, the selected Singaporean real estate companies—CapitaLand and UOL Group—show contrasting financial structures. UOL Group is significantly more profitable (0.44) than CapitaLand (0.11), and it also has a much higher stock turnover ratio (1167.2) compared to CapitaLand (0.82), highlighting its superior operational efficiency. However, CapitaLand has an extremely high debt-equity ratio (7.67), making it heavily reliant on debt financing, whereas UOL Group maintains a lower yet substantial ratio of 2.51. UOL Group also exhibits stronger liquidity, with a current ratio of 2.27 compared to CapitaLand’s 1.05, ensuring a better ability to meet short-term obligations. In terms of debtor collection, UOL Group (9.13) is more efficient than CapitaLand (2.01), while creditor turnover follows a similar pattern, with UOL Group (6.96) paying suppliers more frequently than CapitaLand (1.03). Additionally, CapitaLand has a higher ROCE (0.40) compared to UOL (0.22), indicating better capital utilization, despite its high leverage.
In Singapore real estate selected sample we observed a big difference between the market capitalisation due to Company like CapitaLand have diverse real estate assets with higher market capitalization due to stable cash flow. To further analyse the collected data the mean of all the financial ratios and two macroeconomic variables like inflation and Foreign Direct Investment (FDI) growth rate of both the countries was compared using independent sample t test using Ms-Excel between India and Singapore at 0.05% of significance value assuming that collected sample represents the major portion of industry . The comparison of inflation and FDI growth data between Indian and Singapore has been depicted in Figures 6 and 7 respectively [46]. The inflation trends in Singapore and India from 2003 to 2023 reveal distinct economic patterns. Singapore experienced relatively low inflation throughout the years, mostly remaining below 3%, except for notable spikes in 2008 (6.63%) during the global financial crisis and in 2022 (6.21%) likely due to post-pandemic economic adjustments. The country also faced deflation in 2015 (-0.52%), 2016 (-0.53%), and 2020 (-0.18%), indicating periods of declining price levels. In contrast, India consistently recorded higher inflation than Singapore, often exceeding 5% in multiple years, with peak inflation in 2012 (10.02%) and 2011 (9.48%). However, post-2014, inflation in India became more stable, fluctuating between 3% and 6%, suggesting improved economic policies and control measures. Unlike Singapore, India did not experience deflation, reflecting stronger domestic demand and structural price pressures. The Foreign Direct Investment (FDI) growth trends in Singapore and India from 2003 to 2023 highlight fluctuations influenced by economic conditions, policy changes, and global market dynamics. Singapore's FDI growth showed significant volatility, with strong positive growth in 2003 (1.77), 2006 (1.02), and 2010 (1.36), indicating periods of high investor confidence. However, it also faced negative growth in multiple years, including 2005 (-0.21), 2008 (-0.71), 2011 (-0.11), 2016 (-0.06), 2018 (-0.20), and 2020 (-0.24), reflecting economic slowdowns, global financial crises, and pandemic-related downturns. In contrast, India's FDI growth rate remained mostly positive between 2004 and 2015, peaking in 2006 (1.76) and showing steady inflows despite minor fluctuations. However, from 2016 onwards, India's FDI growth became unstable, with negative trends observed in 2017 (-0.10), 2021 (-0.31), and 2023 (-0.44), possibly due to global economic slowdowns, regulatory challenges, and shifts in investor sentiment.
Source:

Download: Download full-size image

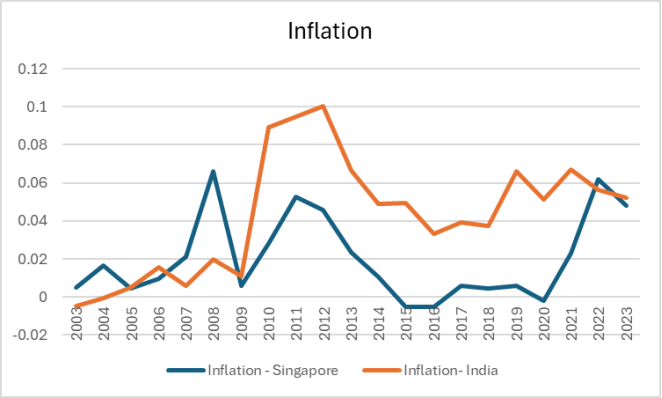
Figure 6. Inflation - India and Singapore.
Source:

Download: Download full-size image

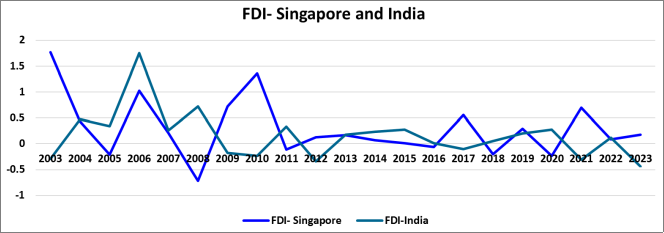
Figure 7. FDI Growth - India and Singapore.
The normality of the data was tested using Shapiro Wilk Test in IBM -SPSS at 0.05% of significance level and data is almost normal. The hypothesis formed and analysis has been depicted in Table 3.
Table 3. Mean Comparison Hypothesis.

S. No

Hypothesis

P Value

Interpretation

1

Ho:- Mean of net profitability ratio of the top Indian real estate companies according to market capitalisation is equal to top Singapore real estate companies

Ha:- Mean of net profitability ratio for top Indian real estate companies according to market capitalisation is not equal to top Singapore real estate companies

0.10

Fail to reject the null hypothesis

2

Ho:- Mean of current ratio for top Indian real estate companies according to market capitalisation is equal to top Singapore real estate companies

Ha:- Mean of current ratio for top Indian real estate companies according to market capitalisation is not equal to top Singapore real estate companies

0.19

Fail to reject the null hypothesis

3

Ho:- Mean of debt equity ratio for top Indian real estate companies according to market capitalisation is equal to top Singapore real estate companies according to market capitalisation

Ha:- Mean of debt equity ratio for top Indian real estate companies according to market capitalisation is not equal to top Singapore real estate companies

0.00

Reject null hypothesis

4

Ho:- Mean of debt to capital employed ratio for top Indian real estate companies according to market capitalisation is equal to top Singapore real estate companies

Ha:- Mean of debt to capital employed ratio for top Indian real estate companies according to market capitalisation is not equal to top Singapore real estate companies

0.30

Fail to reject the null hypothesis

5

Ho:- Mean of stock turnover ratio for top Indian real estate companies according to market capitalisation is equal to top Singapore real estate companies

Ha:- Mean of stock turnover ratio for top Indian real estate companies according to market capitalisation is not equal to top Singapore real estate companies

0.00

Reject the null hypothesis

6

Ho:- Mean of debtors turnover ratio for top Indian real estate companies according to market capitalisation is equal to top 3 Singapore real estate companies

Ha:- Mean of debtors turnover ratio for top Indian real estate companies according to market capitalisation is not equal to top 3 Singapore real estate companies

0.01

Reject the null hypothesis

7

Ho:- Mean of creditors turnover ratio for top Indian real estate companies according to market capitalisation is equal to top Singapore real estate companies

Ha:- Mean of creditors turnover ratio for top Indian real estate companies according to market capitalisation is not equal to top Singapore real estate companies

0.10

Fail to reject the null hypothesis

8

Ho:- Mean of return on capital employed (ROCE) for top Indian real estate companies according to market capitalisation is equal to top Singapore real estate companies

Ha:- Mean of return on capital employed (ROCE) for top Indian real estate companies according to market capitalisation is not equal to top Singapore real estate companies

0.00

Reject the null hypothesis

9

Ho:- Mean of FDI growth rate of Singapore is equal to FDI growth rate of India

Ha:- Mean of FDI growth rate of Singapore is not equal to FDI growth rate of India

0.10

Fail to reject the null hypothesis

10

Ho:- Mean of inflation rate of Singapore is equal to inflation rate of India

Ha:- Mean of inflation rate of Singapore is not equal to inflation rate of India

0.00

Reject the null hypothesis

Hence, from the above table we can make out that mean of net profitability ratio, current ratio, debt to capital employed ratio, creditors turnover ratio for top Indian real estate companies according to market capitalisation is equal to top Singapore real estate companies, whereas, debt equity ratio, stock turnover ratio, debtor’s turnover ratio and return on capital employed (ROCE) is not equal. Singaporean firms exhibit higher leverage, better operational efficiency in managing inventory, and a more effective debtor turnover ratio, while Indian firms maintain a more balanced capital structure. The significant variation in ROCE suggests that Singaporean companies utilize their capital more efficiently to generate profits. Additionally, inflation rates differ notably between the two countries, which can impact real estate investment decisions and cost structures. Overall, these findings suggest that Indian companies should focus on improving stock turnover and debtor management, while Singaporean firms should optimize their debt levels. The results also emphasize the need to consider inflationary trends when making investment decisions in both markets. To further estimate the some of the significant variables which affect the financial performance of top real estate companies of India and Singapore, following equations were proposed depicted in Table 4 .
Table 4. Hypothesis for Estimation.

S. No

Hypothesis

Equation

1

Ho:- ROCE does not significantly impacts net profitability ratio of top Indian real estate companies as per market capitalisation

Ha:- ROCE significantly impacts net profitability ratio of top Indian real estate companies as per market capitalisation

Net Profit Ratio = C+ β(ROCE) + β (Current Ratio) + β (Creditors turnover ratio) + β (stock turnover ratio) + β (Inflation) + β (FDI growth rate)

2

Ho:- Net profit ratio does not significantly impacts ROCE of top Indian real estate companies as per market capitalisation

Ha:- Net profit ratio significantly impacts ROCE of top Indian real estate companies as per market capitalisation

ROCE = C + β(Net Profi)t + β(Stock) + β (Debtors) + β (Creditors) + β (FDI) + β (Inflation)

3

Ho:- ROCE does not significantly impacts net profitability ratio of top Singapore real estate companies as per market capitalisation

Ha:- ROCE significantly impacts net profitability ratio of top Singapore real estate companies as per market capitalisation

Net Profit Ratio = C+ β(ROCE) + β (Current Ratio) + β (Creditors turnover ratio) + β (stock turnover ratio) + β (Inflation) + β (FDI growth rate)

4

Ho:- Net profit ratio does not significantly impacts ROCE of top Singapore real estate companies as per market capitalisation

Ha:- Net profit ratio significantly impacts ROCE of top Singapore real estate companies as per market capitalisation

ROCE = C + β(Net Profi)t + β(Stock) + β (Debtors) + β (Creditors) + β (GDP) + β (FDI growth rate)

The equation and hypothesis in table 4 has been tested using Eviews software at 0.05% of significance level. Since the data is in cross sectional time series format, stationarity of the data was tested using Augmented Dickey Fuller (ADF) test. The collected data is almost stationary at 5% significance level. For the proposed equation multicollinearity was tested using variance inflation factor (VIF) and autocorrelation was tested using Durbin Watson test. Table 5 depicts the output of each hypothesis and significance of each variable.
Table 5. Estimations of each equation.

S. No

Hypothesis

P Value

Interpretation

Equation

Significant Variables

Adj R Square

1

Ho: - ROCE does not significantly impacts net profitability ratio of top Indian real estate companies as per market capitalisation

Ha:- ROCE significantly impacts net profitability ratio of top Indian real estate companies as per market capitalisation

0

ROCE is significantly impacted by net profitability ratio of top Indian real estate companies as per market capitalisation

Net Profit Ratio = (0.05) C + 13.73 (ROCE) +).0019 (Current Ratio) - 0.0146 (Creditors Turnover Ratio) - 0.30 (Stock Turnover ratio) +0.58 (Inflation) +0.06 (FDI Growth) + Error

ROCE and Stock Turnover Ratio (Table A1)

0.79

2

Ho:- Net profit ratio does not significantly impacts ROCE of top Indian real estate companies as per market capitalisation

Ha:- Net profit ratio significantly impacts ROCE of top Indian real estate companies as per market capitalisation

0.00

For top Indian real estate companies as per market capitalisation Net profit ratio gets significantly impacted by ROCE

ROCE = (-0.002) C + 0.05 (Net profit ratio) + 0.02 (Stock Turnover Ratio) + 0.00018 (Debtors turnover ratio) + 0.0010 (Creditors Turnover Ratio) - 0.001 (FDI Growth) - 0.05 (Inflation)

Net Profit Ratio, Stock Turnover Ratio, Debtors Turnover Ratio, Creditors Turnover ratio(Table A2)

0.89

3

Ho: - ROCE does not significantly impacts net profitability ratio of top Singapore real estate companies as per market capitalisation

Ha:- ROCE significantly impacts net profitability ratio of top Singapore real estate companies as per market capitalisation

0.03

For top Singapore real estate companies as per market capitalisation ROCE significantly gets impacted by net profitability ratio

Net profit ratio = -0.03 (C) +0.57 (ROCE)+0.11 (Current Ratio)-0.004 (Creditors Turnover ratio) +0.000003 (Stock turnover ratio)-0.1 (Inflation) +0.13 (FDI Growth) + Error

ROCE, Current Ratio (Table A3)

0.25

4

Ho:- Net profit ratio does not significantly impacts ROCE of top Singapore real estate companies as per market capitalisation

Ha:- Net profit ratio significantly impacts ROCE of top Singapore real estate companies as per market capitalisation

0.04

For top Singapore real estate companies as per market capitalisation Net profit ratio gets significantly impacted by ROCE

ROCE = .09 (C) +0.31 (Net Profit Ratio)+ 0.000(Stock Turnover Ratio)- 0.0045 (Debtors Turnover Ratio) - 0.004 (Creditors Turnover Ratio) -0.001 (FDI Growth) -+3.63 (Inflation)

Stock turnover ratio, debtors turnover ratio, creditors turnover ratio (Table A4)

0.26

From the first hypothesis for Indian real estate companies, ROCE significantly impacts the net profitability ratio. The regression output confirms that ROCE has a highly significant positive impact (p = 0.0000), indicating that firms with better capital utilization tend to achieve higher profitability. However, other variables such as the current ratio, creditors turnover ratio, and inflation were found to be statistically insignificant. Interestingly, stock turnover ratio negatively affects profitability (p = 0.0007), suggesting that higher inventory movement does not necessarily translate into increased profits. Similarly, FDI growth rate had no significant effect. The model exhibits a strong explanatory power with an R-squared value of 0.84, confirming that the independent variables collectively explain a significant portion of the profitability variations. The second hypothesis tested the reverse relationship—whether net profitability significantly influences ROCE. The results indicate a highly significant positive impact (p = 0.0000), affirming that firms with higher profitability tend to achieve greater returns on capital. Additionally, stock turnover ratio (p = 0.0000), debtors turnover ratio (p = 0.0016), and creditors turnover ratio (p = 0.0483) all significantly impact ROCE, emphasizing the role of operational efficiency in driving returns. However, inflation and FDI growth rate were found to be insignificant. The model demonstrates high explanatory power (R-squared = 0.91), suggesting that net profitability and operational metrics strongly determine ROCE in Indian real estate firms.
For Singaporean real estate companies, the third hypothesis assessed whether ROCE significantly impacts net profitability. The results show that ROCE has a statistically significant positive effect (p = 0.0122), but the overall model’s explanatory power is relatively low (R-squared = 0.37). This suggests that while capital efficiency contributes to profitability, other external factors might also play a crucial role. Unlike the Indian market, the current ratio significantly impacts profitability (p = 0.0236), indicating the importance of liquidity management. However, stock turnover ratio, inflation, and FDI growth rate were found to be insignificant in determining profitability.
The fourth hypothesis tested the impact of net profitability on ROCE for Singaporean real estate firms. The results confirm that net profitability has a significant positive effect on ROCE (p = 0.0135), indicating that firms with higher profitability generate better returns on capital. Inflation also emerged as a significant factor (p = 0.0174), suggesting that macroeconomic conditions play a more crucial role in Singapore compared to India. However, stock turnover, debtors turnover, creditors turnover, and FDI growth rate were all found to be statistically insignificant. The model’s explanatory power is moderate (R-squared = 0.38), implying that while profitability influences ROCE, additional external factors need to be considered for a comprehensive analysis.
Overall, the findings highlight that while ROCE and profitability are interlinked in both Indian and Singaporean real estate firms, their determinants vary. Indian firms rely more on operational efficiency metrics like stock turnover and debtor management, whereas Singaporean firms place greater emphasis on liquidity and macroeconomic factors. These insights can guide real estate firms in optimizing their capital structures, improving operational efficiency, and mitigating risks associated with economic fluctuations.
4. Conclusion and Recommendation
According to Coldwell Banker Richard Ellis Singapore, the United States and Canada dominate foreign equity investments in the Indian real estate market in 2024, collectively contributing 25% of total equity investments .
This study provides a comparative analysis of the financial performance drivers of top real estate companies in India and Singapore. Through statistical analysis, key differences in financial structures, capital utilization, and profitability drivers were identified. The study confirms that ROCE significantly influences net profitability in both Indian and Singaporean real estate firms. However, the impact of other financial ratios varies between the two markets.
For Indian real estate companies, stock turnover ratio and debtor turnover ratio play a critical role in determining financial performance, whereas for Singaporean firms, liquidity management (current ratio) and macroeconomic conditions (inflation) exert a more significant influence. Singaporean companies exhibit higher leverage and better operational efficiency, while Indian companies maintain a more balanced capital structure. The findings further reveal that inflation rates differ significantly between India and Singapore, impacting investment decisions and cost structures in real estate markets.
The study also highlights that mean differences in net profitability ratio, current ratio, debt-to-capital employed ratio, and creditors' turnover ratio were statistically insignificant between Indian and Singaporean real estate companies. However, debt-equity ratio, stock turnover ratio, debtor turnover ratio, and ROCE significantly differ between the two markets. Additionally, FDI growth rates were comparable between India and Singapore, whereas inflation rates showed significant variation.
These results emphasize that Indian companies should focus on improving inventory turnover and debtor management, while Singaporean companies should optimize their leverage levels to achieve better capital efficiency.
Indian real estate firms should focus on efficiently managing their stock turnover and debtor collections to improve operational efficiency and profitability. Singaporean companies should work on reducing debt dependency and optimizing capital allocation to enhance financial sustainability. Indian firms should maintain a balanced current ratio to ensure sufficient liquidity while avoiding excessive cash reserves. Singaporean companies should strengthen cash flow management strategies, as the current ratio has been found to significantly impact profitability. Indian real estate firms should carefully monitor inflation trends, as rising inflation can impact borrowing costs and property valuations. Singaporean companies should leverage stable economic conditions by focusing on sustainable growth strategies and investment diversification. Investors should consider ROCE as a key determinant of financial performance in both Indian and Singaporean markets. Stock turnover efficiency should be closely monitored for Indian firms, while liquidity and macroeconomic conditions should be key factors for investing in Singaporean real estate companies. Indian policymakers should encourage efficient debt management and transparency in real estate financing to improve investor confidence. Singaporean authorities should regulate high leverage levels in real estate firms to mitigate financial risks. Future studies should incorporate a broader dataset including more companies across different real estate segments, such as commercial and residential real estate. Additional macroeconomic factors such as interest rate fluctuations, housing demand, and government policies should be explored to better understand their impact on real estate financial performance.
In conclusion, this study provides valuable insights into the financial strengths and weaknesses of real estate firms in India and Singapore, offering practical recommendations for companies, investors, and policymakers to enhance financial stability and market competitiveness.
Abbreviation

APAC

Asia-Pacific

GDP

Gross Domestic Product

ROCE

Return On Capital Employed

HPEC

High Powered Expert Committee

CBRE

Coldwell Banker Richard Ellis

HDB

Housing Development Board

RBF

Radial Basis Function

PF

Project Financing

DLF

Delhi Land & Finance

P Value

Probability Value

ADF

Augmented Dickey Fuller

VIF

Variance Inflation Factor

Author Contributions
Sonam Gyaltsen Dorjee Denzongpa: Conceptualization, Data curation, Resources, Writing – original draft
Neharika Shrivastava: Conceptualization, Formal Analysis, Investigation, Methodology, Project administration, Resources, Software, Supervision, Validation, Writing – review & editing
Conflicts of Interest
The authors declare no conflicts of interest.
Appendix
Table A1. Hypothesis 1.

Dependent Variable: NET_PROFITABILITY_RATIO

Variable

Coefficient

Std. Error

t-Statistic

Prob.

C

0.052552

0.078583

0.668746

0.5121

ROCE

13.73136

1.485824

9.241577

0.0000

CURRENT_RATIO

0.001976

0.003378

0.585045

0.5658

CREDITORS_TURNOVER_RATIO

-0.014636

0.009762

-1.499301

0.1511

STOCK_TURNOVER_RATIO

-0.302496

0.073955

-4.090293

0.0007

FDI_GROWTH_RATE

0.061414

0.082411

0.745218

0.4658

INFLATION

0.582705

1.442778

0.403877

0.6911

R-squared

0.842701

Mean dependent var

0.257803

Adjusted R-squared

0.790268

S.D. dependent var

0.222695

S.E. of regression

0.101987

Akaike info criterion

-1.496454

Sum squared resid

0.187223

Schwarz criterion

-1.155169

Log likelihood

25.70567

Hannan-Quinn criter.

-1.401796

F-statistic

16.07198

Durbin-Watson stat

1.670589

Prob(F-statistic)

0.000002

Table A2. Hypothesis 2.

Dependent Variable: ROCE

Variable

Coefficient

Std. Error

t-Statistic

Prob.

C

-0.002506

0.004029

-0.621956

0.5418

NET_PROFITABILITY_RATIO

0.056235

0.005158

10.90348

0.0000

STOCK_TURNOVER_RATIO

0.021117

0.003699

5.709429

0.0000

DEBTORS_TURNOVER_RATIO

0.000185

5.00E-05

3.698640

0.0016

CREDITORS_TURNOVER_RATIO

0.001013

0.000478

2.118459

0.0483

INFLATION

-0.053858

0.068186

-0.789869

0.4399

FDI_GROWTH_RATE

-0.001067

0.004319

-0.247135

0.8076

R-squared

0.918616

Mean dependent var

0.024058

Adjusted R-squared

0.891488

S.D. dependent var

0.015949

S.E. of regression

0.005254

Akaike info criterion

-7.428265

Sum squared resid

0.000497

Schwarz criterion

-7.086979

Log likelihood

99.85331

Hannan-Quinn criter.

-7.333607

F-statistic

33.86238

Durbin-Watson stat

1.854382

Prob(F-statistic)

0.000000

Table A3. Hypothesis 3.

Dependent Variable: NET_PROFITABILITY_RATIO

Variable

Coefficient

Std. Error

t-Statistic

Prob.

C

-0.038172

0.124026

-0.307773

0.7604

ROCE

0.576901

0.216284

2.667331

0.0122

CURRENT_RATIO

0.116875

0.049023

2.384076

0.0236

CREDITORS_TURNOVER_RATIO

-0.004792

0.006679

-0.717438

0.4787

STOCK_TURNOVER_RATIO

3.67E-05

3.98E-05

0.922437

0.3637

INFLATION

-0.108669

2.061582

-0.052711

0.9583

FDI__US$_BILLION_

0.137041

0.083997

1.631495

0.1132

R-squared

0.376229

Mean dependent var

0.361592

Adjusted R-squared

0.251475

S.D. dependent var

0.269326

S.E. of regression

0.233014

Akaike info criterion

0.093219

Sum squared resid

1.628862

Schwarz criterion

0.397988

Log likelihood

5.275441

Hannan-Quinn criter.

0.200664

F-statistic

3.015761

Durbin-Watson stat

1.891881

Prob(F-statistic)

0.019899

Table A4. Hypothesis 4.

Dependent Variable: ROCE

Variable

Coefficient

Std. Error

t-Statistic

Prob.

C

0.093516

0.077309

1.209634

0.2359

NET_PROFITABILITY_RATIO

0.314066

0.119651

2.624847

0.0135

STOCK_TURNOVER_RATIO

-1.25E-05

3.00E-05

-0.416416

0.6801

DEBTORS_TURNOVER_RATIO

-0.004570

0.007575

-0.603331

0.5508

CREDITORS_TURNOVER_RATIO

-0.004602

0.005162

-0.891501

0.3798

INFLATION

3.630322

1.442099

2.517387

0.0174

FDI__US$_BILLION_

-0.000988

0.066251

-0.014906

0.9882

R-squared

0.383094

Mean dependent var

0.215901

Adjusted R-squared

0.259713

S.D. dependent var

0.206330

S.E. of regression

0.177527

Akaike info criterion

-0.450735

Sum squared resid

0.945470

Schwarz criterion

-0.145967

Log likelihood

15.33861

Hannan-Quinn criter.

-0.343290

F-statistic

3.104962

Durbin-Watson stat

2.016036

Prob(F-statistic)

0.017375

References
[1] Choi, A., & Hyland, G. (2025). 2025 Asia Pacific Investor Intentions Survey. In
[2] Chuang, Z., & Min, P. (2022). Real Estate Tax Reform, Economic Growth and Financial Stability. China Finance and Economic Review, 11(1), 89-112.
[3] Discover Key Insights into the Indian Real Estate Sector in 2024. (n.d.). India Brand Equity Foundation. Retrieved February 6, 2025, from
[4] Edison, J. C. (2017). Financial analysis of the real estate industry in India. Journal of Business and Economic Development, 2(1), 44.
[5] Fan, W., He, Y., Hao, L., & Wu, F. (2024). Do high house prices promote the development of China’s real economy? Empirical evidence based on the decomposition of real estate price. PLoS ONE, 19(1), e0295311.
[6] Gill, A., 1, Herbert, G. D., 1, Mand, H. S., 2, Sharma, S. P., 3, & Mathur, N., 4. (2012). Factors that Influence Indian Propensity to Invest in the Real Estate Market [Journal-article]. Journal of Finance and Investment Analysis, vol. 1 (no. 2), 137-156.
[7] Guo, J., Hao, A., & Ren, Y. (2014). Design optimization of real estate tax and effect analysis in China. Journal of Industrial Engineering and Management, 7(2).
[8] India population (2025) - Worldometer. (n.d.). Retrieved February 6, 2025, from
[9] Issah, M., & Antwi, S. (2017). Role of macroeconomic variables on firms’ performance: Evidence from the UK. Cogent Economics & Finance, 5(1), 1405581.
[10] India: leading real estate companies by market capitalization 2024 | Statista. (2024, August 30). Statista.
[11] Jianyu, G., Wenzhi, P., Mingqing, J., & Dong, Z. (2022). Construction of real estate debt crisis early warning model based on RBF neural network. Security and Communication Networks, 2022, 1-8.
[12] KPMG Assurance and Consulting Services LLP, Bansal, N., KPMG Assurance and Consulting Services LLP, Hari, & KPMG Assurance and Consulting Services LLP. (2024). Navigating the dynamics of real estate in India.
[13] KRAJNAKOVA, E., JEGELAVICIUTE, R., & NAVICKAS, V. (2018). THE ECONOMIC FACTORS INFLUENCE ON REAL ESTATE MARKET DEVELOPMENT. JOURNAL OF INTERDISCIPLINARY RESEARCH, 8(2).
[14] Li, J., Ji, J., Guo, H., & Chen, L. (2018). Research on the influence of real estate development on private investment: A case study of China. Sustainability, 10(8), 2659.
[15] Li, P., Wang, Y., Zhang, L., & Zhang, X. (2024). China’s GDP at risk: The role of housing prices. The Journal of Finance and Data Science, 10.
[16] Liow, K. H. (2004). Corporate real estate and stock market performance. The Journal of Real Estate Finance and Economics, 29(1), 119-140.
[17] Liu, F., Ren, H., Liu, C., & Tan, D. (2022). Formation of Financial Real Estate Risks and Spatial Interactions: Evidence from 35 Cities in China. Journal of Risk and Financial Management, 15(12), 576.
[18] Manganelli, B., Morano, P., Rosato, P., & De Paola, P. (2020). The effect of taxation on investment demand in the real estate market: the Italian experience. Buildings, 10(7), 115.
[19] Matysiak, G., & Fuerst, F. (2009). Analyzing the Performance of Non-Listed Real Estate Funds: A panel data analysis. SSRN Electronic Journal.
[20] MACROTRENDS. (2025a, January 31). India Foreign Direct Investment 1970-2025.
[21] MACROTRENDS. (2025b, January 31). India inflation rate 1960-2025.
[22] Mehta, N. (2021). The Study of Relationship Between FDI and Stock Market and The Real Estate Sector. Turkish Journal of Computer and Mathematics Education, 12(12), 3131-3141.
[23] Mitra, G., Gupta, V., & Gupta, G. (2023). Impact of macroeconomic factors on firm performance: Empirical evidence from India. Investment Management and Financial Innovations, 20(4), 1-12.
[24] Phuong, L. L., & Quynh, A. N. (2024). IMPACTS OF MACROECONOMIC FACTORS ON REAL ESTATE BUBBLE IN VIETNAM’S BIG CITIES WITH INDUSTRIAL ZONES. International Journal of Economics and Business Research, 27(3).
[25] Prasad, S., & Gupta, P. (2023, May 18). India High on Investor’s Agenda - Colliers India. Retrieved February 6, 2025, from
[26] RealEstate, E. (2025, January 10). Singapore, US and Canada dominate foreign investments in Indian real estate market in 2024: Report. ETRealty.com.
[27] Reporter, B. (2024, November 6). Banking on bricks: The real story behind India’s real estate boom.
[28] Ro, S., Lee, J., & Kim, D. (2024). The dark side of project financing: leverage, CEO overconfidence, and sustainability challenges in the construction sector. Sustainability, 17(1), 16.
[29] Rzeszut, S. J., Kowalski, M. J., & Kazak, J. K. (2023). Financial efficiency and investor behavior on the European real estate market in the rising inflation environment. Real Estate Management and Valuation, 32(1), 71-83.
[30] Salah, M., Faisal-E-Alam, M., Kader, A., Imran, M., & Beg, T. H. (2022). FINANCIAL PERFORMANCE EVALUATION THROUGH RATIO ANALYSIS: A STUDY ON RURAL POWER COMPANY LTD. International Journal of Business and Management Future, 9-18.
[31] Sanchaniya, R. J., Sanchaniya, J. V., & Bhalodi, P. P. (2023). Comparative analysis of the Indian and Canadian real estate markets. Baltic Journal of Real Estate Economics and Construction Management, 11(1), 1-13.
[32] Shishir Baijal & Ashwani Awasthi. (2023). Skilled employment in construction sector in India. In Knight Frank India.
[33] Singapore real estate companies - top company list. (n.d.).
[34] Singapore Real Estate Market Size & Trends. (2025). In
[35] Stanković, D. (2022). Analysis of the impact of macroeconomic factors on real estate prices in Bosnia And Herzegovina. Economics, 10(2), 147-160.
[36] Statista. (2024, November 28). Inflation rate in Singapore 2029.
[37] Statista. (n.d.-a). Real Estate - India | Statista market forecast. Retrieved February 6, 2025, from
[38] Statista. (n.d.-b). Real Estate - Singapore | Statista market forecast. Retrieved February 6, 2025, from
[39] Statista. (2024a, July 4). Urbanization in India 2023. Retrieved February 6, 2025, from
[40] Statista. (2024b, November 8). Gross domestic product (GDP) in Singapore 2029. Retrieved February 6, 2025, from
[41] Statista. (2025, January 10). Gross domestic product (GDP) in India 2029. Retrieved February 6, 2025, from
[42] Tajani, F., Morano, P., Saez-Perez, M. P., Di Liddo, F., & Locurcio, M. (2019). Multivariate dynamic analysis and Forecasting Models of future property bubbles: Empirical applications to the housing markets of Spanish metropolitan cities. Sustainability, 11(13), 3575.
[43] Terterashvili, N., & Shaburishvili, S. (2023). A STUDY OF THE FACTORS AFFECTING THE REAL ESTATE MARKET WITH a MACROECONOMIC CONTEXT. Zenodo (CERN European Organization for Nuclear Research).
[44] Top 64 largest Singaporean Real Estate Companies 2025. (n.d.). Disfold. Retrieved February 7, 2025, from
[45] India population (2025) - Worldometer. (n.d.).
[46] World Bank Open Data. (n.d.). World Bank Open Data.
[47] Zhang, R., & Pang, Y. (2024). The role of digital inclusive finance in weakening real estate market speculation. Buildings, 14(5), 1306.
[48] Zubairu, I., Akeba Atiawin, P., Jamal Iddrisu, A., & Amoako Amanquah, B. (2025). Assessing the effects of macroeconomic factors on the financial performance of Ghanaian listed manufacturing companies. International Journal of Accounting, Finance and Risk Management, 10(1), 23-41.
Cite This Article
  • APA Style

    Denzongpa, S. G. D., Shrivastava, N. (2025). Drivers of Financial Performance of Top Real Estate Companies in India and Singapore - A Comparative Analysis. International Journal of Accounting, Finance and Risk Management, 10(2), 94-110. https://doi.org/10.11648/j.ijafrm.20251002.12

    Copy | Download

    ACS Style

    Denzongpa, S. G. D.; Shrivastava, N. Drivers of Financial Performance of Top Real Estate Companies in India and Singapore - A Comparative Analysis. Int. J. Account. Finance Risk Manag. 2025, 10(2), 94-110. doi: 10.11648/j.ijafrm.20251002.12

    Copy | Download

    AMA Style

    Denzongpa SGD, Shrivastava N. Drivers of Financial Performance of Top Real Estate Companies in India and Singapore - A Comparative Analysis. Int J Account Finance Risk Manag. 2025;10(2):94-110. doi: 10.11648/j.ijafrm.20251002.12

    Copy | Download

  • @article{10.11648/j.ijafrm.20251002.12,
      author = {Sonam Gyaltsen Dorjee Denzongpa and Neharika Shrivastava},
      title = {Drivers of Financial Performance of Top Real Estate Companies in India and Singapore - A Comparative Analysis
    },
      journal = {International Journal of Accounting, Finance and Risk Management},
      volume = {10},
      number = {2},
      pages = {94-110},
      doi = {10.11648/j.ijafrm.20251002.12},
      url = {https://doi.org/10.11648/j.ijafrm.20251002.12},
      eprint = {https://article.sciencepublishinggroup.com/pdf/10.11648.j.ijafrm.20251002.12},
      abstract = {The Indian and Singaporean real estate markets are among the top investment destinations in the Asia-Pacific region, attracting significant foreign equity investments. This study provides a comparative analysis of the financial performance drivers of top real estate companies in India and Singapore. Through statistical analysis, key differences in financial structures, capital utilization, and profitability drivers were identified. The findings reveal that Return on Capital Employed (ROCE) significantly influences net profitability in both markets, though other financial ratios exhibit varying impacts. For Indian real estate firms, stock turnover ratio and debtor turnover ratio are critical determinants of financial performance, whereas for Singaporean firms, liquidity management (current ratio) and macroeconomic conditions (inflation) play a more significant role. The study also highlights that Indian firms maintain a more balanced capital structure, while Singaporean companies exhibit higher leverage and operational efficiency. Moreover, statistical tests indicate that the mean differences in net profitability ratio, current ratio, debt-to-capital employed ratio, and creditors' turnover ratio between Indian and Singaporean real estate companies are insignificant. However, significant differences exist in debt-equity ratio, stock turnover ratio, debtor turnover ratio, and ROCE. While FDI growth rates are comparable between the two countries, inflation rates vary significantly, impacting investment decisions and cost structures. The study suggests that Indian firms should enhance inventory turnover and debtor management, whereas Singaporean firms should optimize leverage and capital efficiency. Policymakers in India should focus on transparent debt management practices, while Singaporean authorities should regulate high leverage levels to mitigate financial risks. Future research should incorporate a broader dataset, including commercial and residential real estate segments, and analyze the impact of additional macroeconomic factors such as interest rates, housing demand, and government policies. These insights offer valuable recommendations for companies, investors, and policymakers to strengthen financial stability and improve market competitiveness in the real estate sector of India and Singapore.},
     year = {2025}
    }
    

    Copy | Download

  • TY  - JOUR
    T1  - Drivers of Financial Performance of Top Real Estate Companies in India and Singapore - A Comparative Analysis
    
    AU  - Sonam Gyaltsen Dorjee Denzongpa
    AU  - Neharika Shrivastava
    Y1  - 2025/03/21
    PY  - 2025
    N1  - https://doi.org/10.11648/j.ijafrm.20251002.12
    DO  - 10.11648/j.ijafrm.20251002.12
    T2  - International Journal of Accounting, Finance and Risk Management
    JF  - International Journal of Accounting, Finance and Risk Management
    JO  - International Journal of Accounting, Finance and Risk Management
    SP  - 94
    EP  - 110
    PB  - Science Publishing Group
    SN  - 2578-9376
    UR  - https://doi.org/10.11648/j.ijafrm.20251002.12
    AB  - The Indian and Singaporean real estate markets are among the top investment destinations in the Asia-Pacific region, attracting significant foreign equity investments. This study provides a comparative analysis of the financial performance drivers of top real estate companies in India and Singapore. Through statistical analysis, key differences in financial structures, capital utilization, and profitability drivers were identified. The findings reveal that Return on Capital Employed (ROCE) significantly influences net profitability in both markets, though other financial ratios exhibit varying impacts. For Indian real estate firms, stock turnover ratio and debtor turnover ratio are critical determinants of financial performance, whereas for Singaporean firms, liquidity management (current ratio) and macroeconomic conditions (inflation) play a more significant role. The study also highlights that Indian firms maintain a more balanced capital structure, while Singaporean companies exhibit higher leverage and operational efficiency. Moreover, statistical tests indicate that the mean differences in net profitability ratio, current ratio, debt-to-capital employed ratio, and creditors' turnover ratio between Indian and Singaporean real estate companies are insignificant. However, significant differences exist in debt-equity ratio, stock turnover ratio, debtor turnover ratio, and ROCE. While FDI growth rates are comparable between the two countries, inflation rates vary significantly, impacting investment decisions and cost structures. The study suggests that Indian firms should enhance inventory turnover and debtor management, whereas Singaporean firms should optimize leverage and capital efficiency. Policymakers in India should focus on transparent debt management practices, while Singaporean authorities should regulate high leverage levels to mitigate financial risks. Future research should incorporate a broader dataset, including commercial and residential real estate segments, and analyze the impact of additional macroeconomic factors such as interest rates, housing demand, and government policies. These insights offer valuable recommendations for companies, investors, and policymakers to strengthen financial stability and improve market competitiveness in the real estate sector of India and Singapore.
    VL  - 10
    IS  - 2
    ER  - 

    Copy | Download

Author Information