China’s Hang Seng Index (HSI) represents the mature market, and its Shanghai Stock Exchange Composite Index (SSE), the emerging market. I utilize six market timing (MT) methods and one dollar cost average (DCA) method to invest in the two stock indexes respectively. It is assumed that investors make a series of monthly cash contributions to an equity index in the long term. They do not possess lump-sum cash and cannot borrow cash. They buy and hold equity till the end of an investment period. The DCA method is simple, and it is to invest every monthly cash contribution immediately in an equity index. The six MT methods are complicated, and they are to invest more (less) than the monthly cash contribution, under the cash constraint, if the equity price has declined (risen). Empirical tests have been conducted for the 5-year, 10-year, and 20-year rolling investments during 1991-2022. My findings show that for both the HSI and SSE, the net returns generated by the six MTs are similar to those created by the DCA. In addition, the differences (MT-DCA) in the average monthly returns and modified Sharpe ratios are either statistically insignificant or negative and significant. Therefore, regardless the differences between the Hong Kong and mainland China markets, the complicated MTs do not outperform the simple CA in China’s mature and emerging stock indexes.
| Published in | International Journal of Economics, Finance and Management Sciences (Volume 13, Issue 1) |
| DOI | 10.11648/j.ijefm.20251301.12 |
| Page(s) | 20-33 |
| Creative Commons |
This is an Open Access article, distributed under the terms of the Creative Commons Attribution 4.0 International License (http://creativecommons.org/licenses/by/4.0/), which permits unrestricted use, distribution and reproduction in any medium or format, provided the original work is properly cited. |
| Copyright |
Copyright © The Author(s), 2025. Published by Science Publishing Group |
Market Timing, Dollar Cost Averaging, Hang Seng Index, Shanghai Stock Exchange Composite Index
HSI | SSE | |
|---|---|---|
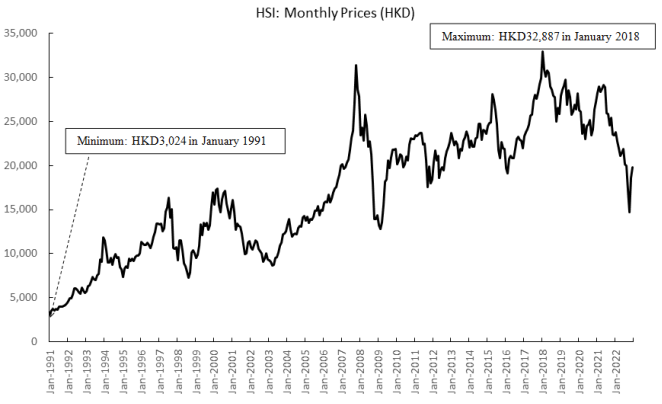
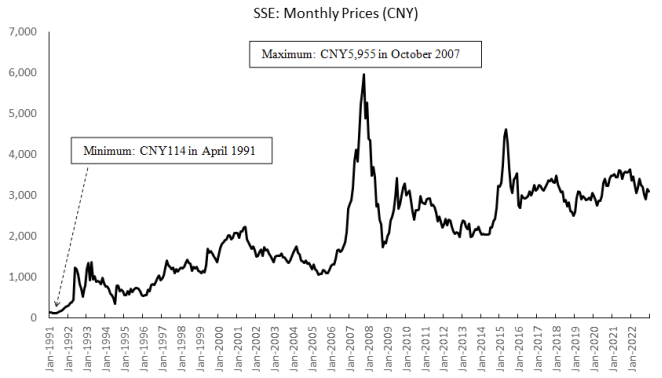
Average Index Price | HKD17,112 | CNY2,076 |
Minimum Index Price | HKD3,024 | CNY114 |
Maximum Index Price | HKD32,887 | CNY5,955 |
Beginning Index Price (January 1991) | HKD3,024 | CNY128 |
Ending Index Price (December 2022) | HKD19,781 | CNY3,089 |
%Change in Price from Jan 1991 to Dec 2022 | 554.15% | 2320.86% |
Mean of Monthly Returns | 0.7380% | 1.6137% |
SD of Monthly Returns | 7.0731% | 14.9007% |
Median of Monthly Returns | 1.0017% | 0.6077% |
Minimum of Monthly Returns | -29.4067% | -31.1529% |
Maximum of Monthly Returns | 30.2810% | 177.2262% |
Correlation of HSI and SSE Monthly Returns | 0.2040 | |
Total Shares Purchased | Average Cost per Share | Ending Cash | Ending Value | Net Return | Average Monthly Return | Modified Sharpe Ratio | |
|---|---|---|---|---|---|---|---|
Panel A. Summary Results of the HSI | |||||||
HKD | HKD | HKD million | |||||
MT1 | 285.51 | 13,353 | 27,613 | 5.675 | 47.80% | 0.7108% | 0.1015 |
MT2 | 273.58 | 13,547 | 133,847 | 5.546 | 44.42% | 0.6566% | 0.0987 |
MT3 | 237.68 | 13,719 | 579,291 | 5.281 | 37.52% | 0.5625% | 0.0987 |
MT1R | 287.83 | 13,332 | 2,761 | 5.696 | 48.34% | 0.7200% | 0.1019 |
MT2R | 286.56 | 13,352 | 13,877 | 5.682 | 47.98% | 0.7143% | 0.1016 |
MT3R | 283.09 | 13,364 | 56,716 | 5.657 | 47.31% | 0.7051% | 0.1015 |
DCA | 288.09 | 13,329 | 0 | 5.699 | 48.40% | 0.7210% | 0.1019 |
Panel B. Summary Results of the SSE | |||||||
CNY | CNY | CNY million | |||||
MT1 | 3,097.88 | 1,223 | 51,791 | 9.622 | 150.57% | 1.5610% | 0.1080 |
MT2 | 2,709.54 | 1,278 | 378,075 | 8.749 | 127.83% | 1.3429% | 0.1076 |
MT3 | 2,493.35 | 1,221 | 796,801 | 8.499 | 121.34% | 1.2481% | 0.1093 |
MT1R | 3,163.05 | 1,212 | 6,303 | 9.778 | 154.63% | 1.6071% | 0.1081 |
MT2R | 3,115.30 | 1,218 | 47,097 | 9.671 | 151.85% | 1.5759% | 0.1082 |
MT3R | 3,054.26 | 1,217 | 124,098 | 9.559 | 148.95% | 1.5348% | 0.1087 |
DCA | 3,171.49 | 1,211 | 0 | 9.798 | 155.14% | 1.6131% | 0.1081 |
HSI | HSI | HSI | SSE | SSE | SSE | |
|---|---|---|---|---|---|---|
Mean | SD | t-value on the mean diff. (MT-DCA) | Mean | SD | t-value on the mean diff. (MT-DCA) | |
Panel A. Net Return | ||||||
MT1 | 15.04% | 25.43% | 0.01 | 26.72% | 46.79% | 0.02 |
MT2 | 15.02% | 23.90% | 0.00 | 26.00% | 44.14% | -0.18 |
MT3 | 14.76% | 21.09% | -0.14 | 28.58% | 46.36% | 0.53 |
MT1R | 15.02% | 25.72% | 0.00 | 26.65% | 46.99% | 0.00 |
MT2R | 15.02% | 25.55% | 0.00 | 26.59% | 46.70% | -0.01 |
MT3R | 15.01% | 25.21% | 0.00 | 26.87% | 46.78% | 0.06 |
DCA | 15.02% | 25.75% | - | 26.64% | 47.01% | - |
Panel B. Average Monthly Return | ||||||
MT1 | 0.6522% | 0.6180% | -0.16 | 1.0982% | 1.4217% | -0.26 |
MT2 | 0.6118% | 0.5710% | -1.02 | 0.9250% | 1.1922% | -1.93 |
MT3 | 0.5117% | 0.4896% | -3.35* | 0.8597% | 1.1038% | -2.62* |
MT1R | 0.6591% | 0.6256% | -0.02 | 1.1240% | 1.4689% | -0.03 |
MT2R | 0.6549% | 0.6207% | -0.10 | 1.0996% | 1.4330% | -0.25 |
MT3R | 0.6453% | 0.6129% | -0.30 | 1.0644% | 1.3848% | -0.56 |
DCA | 0.6598% | 0.6265% | - | 1.1278% | 1.4754% | - |
Panel C. Modified Sharpe Ratio | ||||||
MT1 | 0.1003 | 0.0977 | -0.01 | 0.0917 | 0.1007 | -0.04 |
MT2 | 0.0995 | 0.0975 | -0.11 | 0.0893 | 0.1007 | -0.33 |
MT3 | 0.0980 | 0.0988 | -0.32 | 0.0889 | 0.1015 | -0.38 |
MT1R | 0.1004 | 0.0977 | 0.00 | 0.0919 | 0.1008 | 0.00 |
MT2R | 0.1003 | 0.0977 | -0.01 | 0.0916 | 0.1008 | -0.04 |
MT3R | 0.1002 | 0.0978 | -0.03 | 0.0913 | 0.1009 | -0.08 |
DCA | 0.1004 | 0.0977 | - | 0.0920 | 0.1008 | - |
HSI | HSI | HSI | SSE | SSE | SSE | |
|---|---|---|---|---|---|---|
Mean | SD | t-value on the mean diff. (MT-DCA) | Mean | SD | t-value on the mean diff. (MT-DCA) | |
Panel A. Net Return | ||||||
MT1 | 25.36% | 26.44% | 0.03 | 41.80% | 52.85% | -0.02 |
MT2 | 25.95% | 26.51% | 0.29 | 39.73% | 46.28% | -0.50 |
MT3 | 25.70% | 25.67% | 0.18 | 41.17% | 43.37% | -0.17 |
MT1R | 25.29% | 26.53% | 0.00 | 41.89% | 53.76% | 0.00 |
MT2R | 25.35% | 26.54% | 0.03 | 41.66% | 52.94% | -0.05 |
MT3R | 25.35% | 26.43% | 0.03 | 41.64% | 52.12% | -0.06 |
DCA | 25.28% | 26.54% | - | 41.91% | 53.87% | - |
Panel B. Average Monthly Return | ||||||
MT1 | 0.6122% | 0.2905% | -0.26 | 0.9543% | 0.8149% | -0.30 |
MT2 | 0.5793% | 0.2635% | -1.62 | 0.8185% | 0.6747% | -2.36* |
MT3 | 0.4870% | 0.2224% | -5.79* | 0.7642% | 0.6223% | -3.27* |
MT1R | 0.6180% | 0.2948% | -0.03 | 0.9732% | 0.8443% | -0.04 |
MT2R | 0.6146% | 0.2919% | -0.16 | 0.9551% | 0.8227% | -0.29 |
MT3R | 0.6058% | 0.2876% | -0.51 | 0.9288% | 0.7940% | -0.66 |
DCA | 0.6187% | 0.2953% | - | 0.9760% | 0.8482% | - |
Panel C. Modified Sharpe Ratio | ||||||
MT1 | 0.0882 | 0.0355 | -0.05 | 0.0927 | 0.0427 | -0.07 |
MT2 | 0.0874 | 0.0351 | -0.31 | 0.0904 | 0.0427 | -0.69 |
MT3 | 0.0861 | 0.0360 | -0.72 | 0.0904 | 0.0436 | -0.69 |
MT1R | 0.0883 | 0.0356 | 0.00 | 0.0929 | 0.0427 | -0.01 |
MT2R | 0.0882 | 0.0356 | -0.03 | 0.0927 | 0.0427 | -0.07 |
MT3R | 0.0881 | 0.0356 | -0.09 | 0.0924 | 0.0428 | -0.14 |
DCA | 0.0883 | 0.0356 | - | 0.0930 | 0.0427 | - |
HSI | HSI | HSI | SSE | SSE | SSE | |
|---|---|---|---|---|---|---|
Mean | SD | t-value on the mean diff. (MT-DCA) | Mean | SD | t-value on the mean diff. (MT-DCA) | |
Panel A. Net Return | ||||||
MT1 | 56.85% | 25.00% | -0.03 | 67.61% | 37.78% | -0.07 |
MT2 | 56.93% | 23.88% | -0.01 | 62.57% | 30.95% | -1.29 |
MT3 | 52.66% | 20.92% | -1.57 | 62.37% | 27.48% | -1.40 |
MT1R | 56.94% | 25.19% | 0.00 | 67.89% | 38.89% | -0.01 |
MT2R | 56.95% | 25.07% | 0.00 | 67.34% | 38.02% | -0.13 |
MT3R | 56.57% | 24.74% | -0.13 | 66.98% | 37.06% | -0.21 |
DCA | 56.95% | 25.21% | - | 67.93% | 39.03% | - |
Panel B. Average Monthly Return | ||||||
MT1 | 0.6207% | 0.1867% | -0.29 | 0.9272% | 0.4962% | -0.34 |
MT2 | 0.5889% | 0.1654% | -1.82 | 0.7981% | 0.4084% | -2.72* |
MT3 | 0.4964% | 0.1364% | -6.70* | 0.7460% | 0.3752% | -3.78* |
MT1R | 0.6265% | 0.1898% | -0.03 | 0.9450% | 0.5152% | -0.04 |
MT2R | 0.6232% | 0.1876% | -0.18 | 0.9279% | 0.5018% | -0.33 |
MT3R | 0.6144% | 0.1847% | -0.58 | 0.9032% | 0.4840% | -0.75 |
DCA | 0.6272% | 0.1902% | - | 0.9477% | 0.5178% | - |
Panel C. Modified Sharpe Ratio | ||||||
MT1 | 0.0902 | 0.0202 | -0.05 | 0.0916 | 0.0215 | -0.08 |
MT2 | 0.0896 | 0.0194 | -0.34 | 0.0893 | 0.0209 | -1.01 |
MT3 | 0.0885 | 0.0202 | -0.79 | 0.0893 | 0.0213 | -1.00 |
MT1R | 0.0904 | 0.0203 | -0.01 | 0.0918 | 0.0216 | -0.01 |
MT2R | 0.0903 | 0.0202 | -0.03 | 0.0916 | 0.0215 | -0.09 |
MT3R | 0.0901 | 0.0203 | -0.09 | 0.0914 | 0.0215 | -0.16 |
DCA | 0.0904 | 0.0203 | - | 0.0918 | 0.0216 | - |
AA | Asset Allocation |
CNY | Chinese Yuan |
DCA | Dollar Cost Average |
HKD | Hong Kong Dollar |
HSI | Hang Seng Index |
LS | Lump Sum |
MT | Market Timing |
SSE | Shanghai Stock Exchange Composite Index |
Price (HKD) | Investment (HKD) | ||||||
|---|---|---|---|---|---|---|---|
HSI | MT1 | MT2 | MT3 | MT1R | MT2R | MT3R | |
Jan 1991 | 3,243 | 10,000 | 10,000 | 10,000 | 10,000 | 10,000 | 10,000 |
Feb 1991 | 3,552 | 9,047 | 9,047 | 9,047 | 9,905 | 9,905 | 9,905 |
Mar 1991 | 3,745 | 9,457 | 8,556 | 8,556 | 9,946 | 9,851 | 9,851 |
Apr1991 | 3,588 | 10,419 | 8,914 | 8,914 | 10,042 | 9,892 | 9,892 |
May 1991 | 3,707 | 9,668 | 8,619 | 8,619 | 9,967 | 9,859 | 9,859 |
June 1991 | 3,668 | 10,105 | 8,709 | 8,709 | 10,011 | 9,870 | 9,870 |
July 1991 | 4,009 | 9,070 | 7,900 | 7,900 | 9,907 | 9,778 | 9,778 |
Aug 1991 | 3,998 | 10,027 | 7,921 | 7,921 | 10,003 | 9,781 | 9,781 |
Sept 1991 | 3,957 | 10,103 | 8,003 | 8,003 | 10,010 | 9,791 | 9,791 |
Oct 1991 | 4,039 | 9,793 | 7,837 | 7,837 | 9,979 | 9,771 | 9,771 |
Nov 1991 | 4,150 | 9,725 | 7,622 | 7,622 | 9,972 | 9,744 | 9,744 |
Dec 1991 | 4,297 | 9,645 | 7,351 | 7,351 | 9,964 | 9,709 | 9,709 |
Jan 1992 | 4,602 | 9,291 | 9,291 | 5,810 | 9,929 | 9,929 | 9,581 |
Feb 1992 | 4,929 | 9,289 | 8,631 | 5,397 | 9,929 | 9,859 | 9,513 |
Mar 1992 | 4,938 | 9,981 | 8,614 | 5,387 | 9,998 | 9,857 | 9,511 |
Apr 1992 | 5,370 | 9,127 | 7,862 | 4,916 | 9,913 | 9,771 | 9,428 |
May 1992 | 6,080 | 8,677 | 6,822 | 4,266 | 9,868 | 9,641 | 9,303 |
June 1992 | 6,104 | 9,961 | 6,795 | 4,249 | 9,996 | 9,638 | 9,300 |
July 1992 | 5,881 | 10,365 | 7,043 | 4,404 | 10,037 | 9,673 | 9,334 |
Aug 1992 | 5,629 | 10,429 | 7,345 | 4,593 | 10,043 | 9,714 | 9,374 |
Sept 1992 | 5,505 | 10,219 | 7,506 | 4,694 | 10,022 | 9,736 | 9,394 |
Oct 1992 | 6,191 | 8,755 | 6,572 | 4,109 | 9,876 | 9,614 | 9,277 |
Nov 1992 | 5,811 | 10,614 | 6,975 | 4,362 | 10,061 | 9,673 | 9,334 |
Dec 1992 | 5,512 | 10,513 | 7,333 | 4,586 | 10,051 | 9,723 | 9,382 |
Price (CNY) | Investment (CNY) | ||||||
|---|---|---|---|---|---|---|---|
SSE | MT1 | MT2 | MT3 | MT1R | MT2R | MT3R | |
Jan 1991 | 130 | 10,000 | 10,000 | 10,000 | 10,000 | 10,000 | 10,000 |
Feb 1991 | 133 | 9,766 | 9,766 | 9,766 | 9,905 | 9,905 | 9,905 |
Mar 1991 | 120 | 10,234 | 10,234 | 10,234 | 9,946 | 9,851 | 9,851 |
Apr1991 | 114 | 10,000 | 10,000 | 10,000 | 10,042 | 9,892 | 9,892 |
May 1991 | 115 | 9,922 | 9,922 | 9,922 | 9,967 | 9,859 | 9,859 |
June 1991 | 138 | 8,021 | 7,958 | 7,958 | 10,011 | 9,870 | 9,870 |
July 1991 | 144 | 9,546 | 7,597 | 7,597 | 9,907 | 9,778 | 9,778 |
Aug 1991 | 178 | 7,592 | 5,767 | 5,767 | 10,003 | 9,781 | 9,781 |
Sept 1991 | 181 | 9,860 | 5,687 | 5,687 | 10,010 | 9,791 | 9,791 |
Oct 1991 | 219 | 7,917 | 4,503 | 4,503 | 9,979 | 9,771 | 9,771 |
Nov 1991 | 260 | 8,124 | 3,658 | 3,658 | 9,972 | 9,744 | 9,744 |
Dec 1991 | 293 | 8,723 | 3,191 | 3,191 | 9,964 | 9,709 | 9,709 |
Jan 1992 | 313 | 9,300 | 9,300 | 0 | 9,929 | 9,929 | 9,581 |
Feb 1992 | 365 | 8,358 | 7,773 | 0 | 9,929 | 9,859 | 9,513 |
Mar 1992 | 381 | 9,545 | 7,420 | 0 | 9,998 | 9,857 | 9,511 |
Apr 1992 | 445 | 8,318 | 6,172 | 0 | 9,913 | 9,771 | 9,428 |
May 1992 | 1,235 | 0 | 0 | 0 | 9,868 | 9,641 | 9,303 |
June 1992 | 1,191 | 10,352 | 0 | 0 | 9,996 | 9,638 | 9,300 |
July 1992 | 1,052 | 11,168 | 0 | 0 | 10,037 | 9,673 | 9,334 |
Aug 1992 | 823 | 12,175 | 0 | 0 | 10,043 | 9,714 | 9,374 |
Sept 1992 | 702 | 11,469 | 0 | 0 | 10,022 | 9,736 | 9,394 |
Oct 1992 | 507 | 12,778 | 0 | 0 | 9,876 | 9,614 | 9,277 |
Nov 1992 | 725 | 5,715 | 0 | 0 | 10,061 | 9,673 | 9,334 |
Dec 1992 | 780 | 9,230 | 0 | 0 | 10,051 | 9,723 | 9,382 |
| [1] | Allen, Franklin, Jun Qian, Chenyu Shan, and Julie Lei Zhu, 2024, Dissecting the long-term performance of the Chinese stock market, Journal of Finance 79, 993-1054. |
| [2] | Atra, Robert J., and Thomas L. Mann, 2001, Dollar-cost averaging and seasonality: Some international evidence, Journal of Financial Planning 14, 99-103. |
| [3] | Bierman, Harold Jr., and Jerome E. Hass, 2004, Dollar cost averaging, Journal of Investing 13, 21-24. |
| [4] | Brennan, Michael J., Feifei Li, and Walter N. Torous, 2005, Dollar cost averaging, Review of Finance 9, 509-535. |
| [5] | Caporale, Guglielmo Maria, Luis A. Gil-Alana, and Kefei You, 2021, Global and regional financial integration in emerging Asia, Journal of Economic Integration 36, 185-202. |
| [6] | Carpenter, Jennifer N., and Robert F. Whitelaw, 2017, The development of China’s stock market and stakes for the global economy, Annual Review of Financial Economics 9, 233-257. |
| [7] | Chen, Haiwei, and Jim Estes, 2007, Value averaging for 401(k) plans makes more 'cents' than dollar-cost averaging, Journal of Financial Planning 20, 56-59. |
| [8] | Chen, Haiwei, and Jim Estes, 2010, A Monte Carlo study of the strategies for 401 (k) plans: Dollar cost-averaging, value-averaging, and proportional rebalancing, Financial Services Review 19, 95-109. |
| [9] | Cho, David D., and Emre Kuvvet, 2015, Dollar-cost averaging: The trade-off between risk and return, Journal of Financial Planning 28, 52-58. |
| [10] | Constantinides, George M., 1979, A note on the suboptimality of dollar-cost averaging as an investment policy, Journal of Financial and Quantitative Analysis 14, 443-450. |
| [11] | Dichtl, Hubert, and Wolfgang Drobetz, 2011, Dollar-cost averaging and prospect theory investors: An explanation for a popular investment strategy, Journal of Behavioral Finance 12, 41-52. |
| [12] | Dunham, Lee M., and Geoffrey C. Friesen, 2012, Building a better mousetrap: Enhanced dollar-cost averaging, Journal of Wealth Management 15, 41-50. |
| [13] | Grable, John E., and Swarn Chatterjee, 2015, Another look at lump-sum versus dollar-cost averaging, Journal of Financial Service Professionals 69, 16-18. |
| [14] | He, Wei, Bolong Cao, and H. Kent Baker, 2015, The performance and market timing ability of Chinese mutual funds, Financial Services Review 24, 289-311. |
| [15] | He, Yan, and Junbo Wang, 2022, Does Market Timing Beat Dollar Cost Averaging? Journal of Finance Issues 20, 10-24. |
| [16] | Jiang, Fuxiu, Zhan Jiang, and Kenneth A. Kim, 2020, Capital markets, financial institutions, and corporate finance in China, Journal of Corporate Finance 63, 1-21. |
| [17] | Jin, Xuejun, Hongze Li, and Bin Yu, 2023, The day-of-the-month effect and the performance of the dollar cost averaging strategy: Evidence from China, Accounting and Finance 63, 797-815. |
| [18] | Kapalczynski, Anna, and Donald Lien, 2021, Effectiveness of augmented dollar-cost averaging, North American Journal of Economics and Finance 56, 1-13. |
| [19] | Kirkby, J. Lars, Sovan Mitra, and Duy Nguyen, 2020, An analysis of dollar cost averaging and market timing investment strategies, European Journal of Operational Research 286, 1168-1186. |
| [20] | Lai, Hung-Cheng, Tseng-Chan Tseng, and Sz-Chi Huang, 2016, Combining value averaging and Bollinger Band for an ETF trading strategy, Applied Economics 48, 3550-3557. |
| [21] | Lai, Syouching, Teng Yuan Cheng, Hung Chih Li, and Sheng-Peng Chien, 2013, Dynamic interactions among macroeconomic variables and stock indexes in Taiwan, Hong Kong, and China, Emerging Markets Finance & Trade 49 (Supplement 4), 213-235. |
| [22] | Leggio, Karyl B., and Donald Lien, 2003, An empirical examination of the effectiveness of dollar-cost averaging using downside risk performance measures, Journal of Economics and Finance 27, 211-223. |
| [23] | Li, Xindan, and Bing Zhang, 2013, Spillover and cojumps between the U.S. and Chinese stock markets, Emerging Markets Finance & Trade 49 (Supplement 2), 23-42. |
| [24] | Li, Yu-wai Vic, 2020, The irreplaceable outpost? Whither Hong Kong in China’s financial future, China Review 20 (No. 3, Special Issue), 261-278. |
| [25] | Liao, Li, Xueyong Zhang, and Yeqing Zhang, 2017, Mutual fund managers’ timing abilities, Pacific-Basin Finance Journal 44, 80–96. |
| [26] | Lin, Eric C., and Helen Xu, 2016, Modified dollar cost averaging investment strategy: Evidence from major developed international stock markets, Journal of Finance Issues 15, 20-30. |
| [27] | Lu, Richard, Vu Tran Hoang, and Wing-Keung Wong, 2021, Do lump-sum investing strategies really outperform dollar-cost averaging strategies? Studies in Economics and Finance 38, 675-691. |
| [28] | Luskin, Jon M., 2017, Dollar-cost averaging using the CAPE ratio: An identifiable trend influencing outperformance, Journal of Financial Planning 30, 54-60. |
| [29] | Moosa, Imad, and Larry Li, 2011, Technical and fundamental trading in the Chinese stock market: Evidence based on time-series and panel data, Emerging Markets Finance & Trade 47 (Supplement 1), 23-31. |
| [30] | Panyagometh, Kamphol, and Kevin X. Zhu, 2016, Dollar-cost averaging, asset allocation, and lump sum investing, Journal of Wealth Management 19, 75-89. |
| [31] | Peng, Zhe, Kainan Xiong, and Yahui Yang, 2023, Segmentation of the Chinese stock market: A review, Journal of Economic Surveys 37, 1-43. |
| [32] | Richardson, Gary M., and Bruce D. Bagamery, 2011, Dynamic dollar cost averaging, Journal of Financial Service Professionals 65, 56-60. |
| [33] | Rozeff, Michael S., 1994, Lump-sum investing versus dollar averaging, Journal of Portfolio Management 21, 45-50. |
| [34] | Sherman, Meadhbh, Niall O’Sullivan, and Jun Gao, 2017, The market-timing ability of Chinese equity securities investment funds, International Journal of Financial Studies 5, 1-18. |
| [35] | Smith, Gary, and Heidi Margaret Artigue, 2018, Another look at dollar cost averaging, Journal of Investing 27, 66-75. |
| [36] | Statman, Meir, 1995, A behavioral framework for dollar-cost averaging, Journal of Portfolio Management 22, 70-78. |
| [37] | Statman, Meir, 2018, Dollar cost averaging is not rational, but it is normal and can be wise, Journal of Financial Planning 31, 35-37. |
| [38] | Xu, Xiaoqing Eleanor, 2005, Performance of securities investment funds in China, Emerging Markets Finance and Trade 41, 27–42. |
| [39] | Yang, Wan-Ru, and Yi-Ling Chen, 2015, The response of dynamic herd behavior to domestic and U.S. market factors, Emerging Markets Finance & Trade 51 (Supplement 1), S18-S41. |
| [40] | Yi, Li, Zilan Liu, Lei He, Zilong Qin, and Shunli Gan, 2018, Do Chinese mutual funds time the market? Pacific-Basin Finance Journal 47, 1–19. |
| [41] | Zhang, Zhichao, Wai Sun, and Hua Wang, 2008, A new perspective on financial anomalies in emerging markets: the case of China, Applied Financial Economics 18, 1681–1695. |
APA Style
He, Y. (2025). Does Market Timing Work Well in China’s Mature and Emerging Stock Markets. International Journal of Economics, Finance and Management Sciences, 13(1), 20-33. https://doi.org/10.11648/j.ijefm.20251301.12
ACS Style
He, Y. Does Market Timing Work Well in China’s Mature and Emerging Stock Markets. Int. J. Econ. Finance Manag. Sci. 2025, 13(1), 20-33. doi: 10.11648/j.ijefm.20251301.12
@article{10.11648/j.ijefm.20251301.12,
  author = {Yan He},
  title = {Does Market Timing Work Well in China’s Mature and Emerging Stock Markets},
  journal = {International Journal of Economics, Finance and Management Sciences},
  volume = {13},
  number = {1},
  pages = {20-33},
  doi = {10.11648/j.ijefm.20251301.12},
  url = {https://doi.org/10.11648/j.ijefm.20251301.12},
  eprint = {https://article.sciencepublishinggroup.com/pdf/10.11648.j.ijefm.20251301.12},
  abstract = {China’s Hang Seng Index (HSI) represents the mature market, and its Shanghai Stock Exchange Composite Index (SSE), the emerging market. I utilize six market timing (MT) methods and one dollar cost average (DCA) method to invest in the two stock indexes respectively. It is assumed that investors make a series of monthly cash contributions to an equity index in the long term. They do not possess lump-sum cash and cannot borrow cash. They buy and hold equity till the end of an investment period. The DCA method is simple, and it is to invest every monthly cash contribution immediately in an equity index. The six MT methods are complicated, and they are to invest more (less) than the monthly cash contribution, under the cash constraint, if the equity price has declined (risen). Empirical tests have been conducted for the 5-year, 10-year, and 20-year rolling investments during 1991-2022. My findings show that for both the HSI and SSE, the net returns generated by the six MTs are similar to those created by the DCA. In addition, the differences (MT-DCA) in the average monthly returns and modified Sharpe ratios are either statistically insignificant or negative and significant. Therefore, regardless the differences between the Hong Kong and mainland China markets, the complicated MTs do not outperform the simple CA in China’s mature and emerging stock indexes.
},
 year = {2025}
}
TY  - JOUR
T1  - Does Market Timing Work Well in China’s Mature and Emerging Stock Markets
AU  - Yan He
Y1  - 2025/02/26
PY  - 2025
N1  - https://doi.org/10.11648/j.ijefm.20251301.12
DO  - 10.11648/j.ijefm.20251301.12
T2  - International Journal of Economics, Finance and Management Sciences
JF  - International Journal of Economics, Finance and Management Sciences
JO  - International Journal of Economics, Finance and Management Sciences
SP  - 20
EP  - 33
PB  - Science Publishing Group
SN  - 2326-9561
UR  - https://doi.org/10.11648/j.ijefm.20251301.12
AB  - China’s Hang Seng Index (HSI) represents the mature market, and its Shanghai Stock Exchange Composite Index (SSE), the emerging market. I utilize six market timing (MT) methods and one dollar cost average (DCA) method to invest in the two stock indexes respectively. It is assumed that investors make a series of monthly cash contributions to an equity index in the long term. They do not possess lump-sum cash and cannot borrow cash. They buy and hold equity till the end of an investment period. The DCA method is simple, and it is to invest every monthly cash contribution immediately in an equity index. The six MT methods are complicated, and they are to invest more (less) than the monthly cash contribution, under the cash constraint, if the equity price has declined (risen). Empirical tests have been conducted for the 5-year, 10-year, and 20-year rolling investments during 1991-2022. My findings show that for both the HSI and SSE, the net returns generated by the six MTs are similar to those created by the DCA. In addition, the differences (MT-DCA) in the average monthly returns and modified Sharpe ratios are either statistically insignificant or negative and significant. Therefore, regardless the differences between the Hong Kong and mainland China markets, the complicated MTs do not outperform the simple CA in China’s mature and emerging stock indexes.

VL  - 13
IS  - 1
ER  -
School of Business, Indiana University Southeast, New Albany, The United States
Information