Research Article | | Peer-Reviewed

Genetic Characterization of Populations of Zeugodacus Cucurbitae (Coquillet, 1899), a Watermelon Pest

Received: 19 August 2025     Accepted: 3 September 2025     Published: 14 October 2025
Views:       Downloads:
Abstract

Zeugodacus cucurbitae or melon fly formerly called Bactrocera cucurbitae is an agricultural pest of Asian origin. Well known as a pest of fleshy fruits and vegetables damaging 81 host plants, the melon fly has been the subject of several studies due to its introduction and dissemination worldwide. Up to now, no study on the global structuring of Zeugodacus cucurbitae has been done. Therefore, knowledge of its genetic structuring would allow better management of the insect. It is in this context that the present study on the genetic characterization of populations of Z. cucurbitae watermelon pest insect fits. Our data was collected from the Genbank database. Phylogeographic analyses were made using mitochondrial cytochrome oxidase I (COI) DNA as a genetic marker. After analysis, the study demonstrated two distinct groups: a group composed of the population of Reunion and another group composed of populations from Africa, Asia, Oceania, and Hawaii. This is the result of a genetic isolation demonstrated by the Mantel Test for which the significant p-value confirms the correlation between genetic distances and geographical distances. However, there is a genetic differentiation between individuals in the Reunion population. For any fight against this insect, it would be interesting to take into account the existence of these two genetic groups.

Published in International Journal of Genetics and Genomics (Volume 13, Issue 4)
DOI 10.11648/j.ijgg.20251304.12
Page(s) 83-94
Creative Commons

This is an Open Access article, distributed under the terms of the Creative Commons Attribution 4.0 International License (http://creativecommons.org/licenses/by/4.0/), which permits unrestricted use, distribution and reproduction in any medium or format, provided the original work is properly cited.

Copyright

Copyright © The Author(s), 2025. Published by Science Publishing Group

Keywords

Zeugodacus Cucurbitae, Characterisation, COI, Phylogeography, Mitochondrial DNA

1. Introduction
Agriculture is a pillar of sustainable development, economic stability and food security for a country. Nowadays, watermelon is considered a "functional food" and a popular fruit with important nutritional and bioactive compounds offering several health benefits . The watermelon belongs to the Cucurbitaceae family. According to Badji , cucurbits such as melon, watermelon, and cucumber are also crops that are of increasing interest for export needs. Despite these assets, these crops are threatened by pest insects. Zeugodacus cucurbitae, also called the watermelon fly, is a serious pest belonging to the family Tephritidae. It is a major pest of fleshy fruits and vegetables . It has economic importance due to the damage it causes to vegetable and fruit crops . Probably originating from India , this species is very widespread throughout the world . Understanding the genetic structure and the genetic diversity of the insect is crucial for effective management. Previous studies have been conducted using cyto-chromium oxidase I in China, Southeast Asia , India , East Asia, Central Asia, Africa, Hawaii and Reunion on the genetic relationships between populations and their demographic evolution. They revealed low genetic diversity between populations and a genetic structuring according to environmental zones. Therefore, an assessment of the degree of homogeneity at the global level would be advantageous for the control of this pest.
It is in this wake that this study is undertaken, thus aiming to understand the genetics of Zeugodacus cucurbitae populations.
2. Materials and Methods
2.1. Study Sites
Our study took place in a total of 20 countries spread over the 5 continents:
1) Africa: Senegal, Tanzania
2) Oceania: Guam, Northern Mariana Islands, Salomon Islands
3) America: Hawaii
4) Europe: Reunion
5) Asia: Thailand, Japan, Laos, Cambodia, Nepal, Bangladesh, Indonesia, Malaysia, China, Sri Lanka, Taiwan, Philippines, Vietnam
2.2. Study Populations
The study populations were defined according to countries. Individuals from each country constitute a population. We have a total of 20 populations.
2.3. Data Collection
2.3.1. Interest in Cytochrome Oxidase I
The study was carried out on a molecular marker of mitochondrial DNA: cytochrome oxidase I (COI) which codes for a subunit of a transmembrane protein complex of the respiratory chain. Mitochondrial genes have low diversity among individuals of the same species because mitochondria are transmitted vertically from mother to daughter, thus creating a bottleneck . The COI is widely used in studies of phylogeny, phylogeography and population genetics but also for species identification . It is a determining marker in the process of Barcoding . Its rate of molecular evolution is rapid in addition to the absence of meiotic recombination (generally), variations are the result of accumulations of mutations allowing to consider polymorphic sequences as unique haplotypes .
In other words, the mitochondrial genome of animals is a better target for analysis than the nuclear genome due to its lack of introns, limited exposure to recombination, and haploid inheritance pattern .
2.3.2. Acquisition of Sequences
Sequences were downloaded from GENBANK genomic databases. It is a database that collects DNA sequences available publicly on NCBI (National Centre for Biotechnology Information: www.ncbi.nlm.nih.gov/genbank). Sequences are removed from Genbank thanks to their accession number and downloaded under the FASTA extension (fasta). They were then grouped by continent with 120 sequences from Asian countries (Malaysia, Thailand, Bangladesh, Sri Lanka, Vietnam, Indonesia, Philippines, China, Japan, Laos, Cambodia, Nepal, Taiwan), 25 sequences from Oceania countries (Solomon Islands, Northern Mariana Islands, Guam), 20 sequences from the countries of Africa (Senegal, Tanzania), 10 sequences from the USA (Hawaii) and 10 sequences from Europe (Reunion).
2.4. Genetic Analyses
2.4.1. Sequences Analysis
(i). Sequences Alignment
Sequences alignment is the first step in phylogenetic analysis. It is important because it allows us to evaluate the homology of the sites. Our sequences have been aligned and corrected by the BioEdit software version 7.2.5 using the ClustalW algorithm. As for the cleaning of the sequences, it is done in conjunction with the alignment.
(ii). Basic Parameters of Genetic Diversity
As part of the sequence polymorphism analysis, the DnaSP software version 5.10.01 was used to determine the identity card of our data, that is, the basic parameters of variability which are the number of sites (N), the sample size (n), variable sites such as singleton or non-informative sites and informative sites in parsimony. The MEGA 7.0.14 software was used to extract the nucleotidic frequencies which are the nature of the mutations, the rate of mutations (R) and the type of substitutions i.e. synonymous (Ks) and non-synonymous (Kns) mutations. The same software made it possible to highlight the percentages of transitions and transversions calculated using the nucleotide substitutions model.
2.4.2. Genetic Diversity Indices
The DnaSP software version 5.10.01 made it possible to determine genetic diversity indices, which are nucleotide diversity Pi (π) and haplotype diversity (Hd), as well as their variances. Moreover, π is defined as the probability according to which two sequences randomly drawn in a sample are different at a given site and Hd the probability that, two haplotypes randomly drawn in a population are similar . We have the signal of a stable population with a large effective size (or admixture) when Hd and Pi are strong; When the latter are weak, we have the signal of a severe and prolonged demographic bottleneck. However, a strong Hd and a weak Pi would mean rapid population growth from an ancestral population with low numbers and where time is not sufficient to find a high diversity between haplotypes. A short-lived bottleneck in a large ancestral population would mean low Hd and high Pi .
2.4.3. Haplotype Networks
Haplotype networks are an application of the median link model to show the relationships between different haplotypes. A minimum haplotype network is characterized by nodes (circles) and branches (links) that connect the nodes. Each node corresponds to a haplotype whose size is proportional to the frequency of the haplotype in the dataset . They are built with NETWORK version 10.2 using the Median-Joining method in order to identify their phylogenetic relationships.
2.4.4. Differentiation and Genetic Distance
Structuring requires the parameters of genetic differentiation, which are the Fst (the degree of genetic differentiation) determined with the software Arlequin version 3.5.1.3 and the genetic distance D executable with the program MEGA 7.0.14 . The genetic distance is calculated within each population (intra-populations distances) and between populations taken two by two (inter-populations distances).
2.4.5. Structuration
(i). Correlation Test Between Genetic Distance and Geographical Distance
Mantel test was used to measure the influence of geographical distance on genetic differentiation thanks to XLSTATS software version 2021.5. Geographical distances were obtained from Google earth. The hypothesis that genetic and geographical distances are not correlated is null. The hypothesis that genetic and geographical distances are correlated is alternative. If the p-value is below the threshold significance level of 0.05, the null hypothesis is rejected. Otherwise, the null hypothesis is accepted.
(ii). AMOVA Test
The Analysis of Molecular Variance (AMOVA) implemented in the software Arlequin version 3.5.1.3 allows to determinate the genetic structuring of populations based on a given factor.
2.4.6. Demographic Evolution
The genetic demo tests were carried out in order to distinguish the sequences (loci) whose evolution follows a neutral model to those evolving according to a non-random process. It is a question of comparing the level of adjustment between the diversity observed at the loci and that expected under the hypothesis of a neutralist model (at the mutation-drift equilibrium). The estimation of Tajima’s D, Fu’s and Li’s Fs was done with the software Arlequin . These values test the hypothesis that mutations are selectively neutral. The qualitative graphical representation of the distribution of genetic distances between individuals in a population taken two by two was done using the Dnasp software version 5.10.01 .
2.4.7. Phylogenetic Approach
Phylogenetic analysis is one of the main tools of evolutionary biology. Indeed, it allows the evaluation of the kinship relationships between the different strains of Z. cucurbitae. The reconstruction of phylogenetic trees was carried out using different approaches:
1) Distance methods: Neighbor joining (Kimura 2-prameter) which constructs the tree based on the similarities observed between each pair of sequences. It is based on the matrix of genetic commands.
2) Character methods: The maximum likelihood that evaluates, in terms of probabilities, the order of branches and the length of the branches of a tree within the framework of a given probability evolution model. It allows you to see all the events that may have generated the current data set analysed. This method leads to the result closest to the real evolutionary tree. The Akaike information criterion (AIC) was used to choose the model for the evolution of the sequence. The best model is the one with the lowest AIC value. In our case, the latter corresponds to model TN93 + G + I. The latter will be retained for the reconstruction of the trees. These trees are verified with the MEGA software version 7.0.14 and the robustness of the branches has been evaluated at 1000 Bootstrap.
3) The Bayesian approach is evaluated thanks to the skylog Mr BAYES version 3.2.6 . The distribution of posterior probabilities of trees was estimated by 4 MCMC chains (3 of which were burned gradually and one cold). One million (1,000,000) generations were carried out for each of the chains by sampling the different parameters of all the 1,000 generations. The degree of convergence of the chains can be verified by examining the evolution of the likelihood function during the journey of the "cold" chain in order to determine the ignition period. The generations carried out during this period are eliminated from the analyses. In a conservative manner, the first 250,000 generations were eliminated (25%) and the inferences were then made on the next 750,000 generations. The model used is the same as that of the likelihood (TN93 + G). The visualization of the trees was done with Fig Tree version 1.4.2 . A sequence of Bactrocera dorsalis was used as an out-group for the construction of phylogeographic trees.
3. Results
3.1. Genetic Variability
3.1.1. Basic Parameters of Genetic Variability
After alignment and cleaning, our dataset presents a total of 182 nucleotide sequences with each 592 sites including 33 sites with gaps. Among these sites, 247 are monomorphic and 312 are polymorphic including 12 singleton sites and 300 informative variable sites. The singleton sites have 2 variants and are at the following positions: 33, 117, 132, 254, 324, 338, 359, 371, 389, 429, 542, and 549. Within the informative variable sites, 284 sites constitute 2-variant sites, 13 sites are 3-variants and 3 sites are 4-variants. Moreover, the total number of mutations (Eta) is 331. All these results are summarized in Table 1.
Table 1. Genetic diversity parameters.

E

N

M

I

S=S2V

P

P2V

P3V

P4V

Eta

182

592

247

312

12

300

284

13

3

331

E: sample size; N: total number of sites; M: monomorphic site names; I: polymorphic site names; S: singleton site names; S2V: singleton site names with 2 variants; P: information site names; P2V: information site names with 2 variants; P3V: name of information sites with 3 variants; P4V: name of information sites with 4 variants; Eta: total number of mutations.
On all mutations, transitions (69.94%) are more numerous than transversions (30.06%). Transitions between pyrimidine bases (35.58%) are slightly more numerous than those between purine bases (34.36%). For transition-type mutations, in 24.20% of mutations, cytosine replaces thymine and vice versa for 11.38% of mutations. In 22.30% of mutations, guanine replaces adenine and the latter replaces the former in 12.06% of mutations. For those of the transversion type, adenine and guanine replace thymine (5.79%) and cytosine (2.72%). Similarly, the latter replace adenine in 4.23% and guanine in 2.29%. All these results are recorded in Table 2.
Table 2. Percentage of Transition and transversion.

Bases

A

T

C

G

A

-

5.79

2.72

12.06

T

4.23

-

11.38

2.29

C

4.23

24.20

-

2.29

G

22.30

5.79

2.72

-

The average number of nucleotide differences between species (K) was deduced according to the following two groups: Country (all populations except Reunion) and island (Reunion). The group of countries (K=0.784) is more homogeneous than Reunion Island (K=1.756).
3.1.2. Genetic Diversity Indices
Nucleotidic (Pi) and haplotypic (Hd) diversities are determined (Table 3) within each population and for all populations. For all populations, the Hd and Pi values are high. Populations like Bangladesh, Sri Lanka, Vietnam, and Nepal all have high Hd and low Pi. All other populations have low Hd and low Pi.
Table 3. Haplotypic (Hd) and Nucleotidic (Pi) diversities of populations.

Total population

Senegal

Tanzania

Thailand

Bangladesh

Sri Lanka

Indonesia

hd

0.390+/-0.002

0.2+/- 0.238

0.378+/-0.032

0.378+/-0.032

0.778+/-0.0188

0.778+/-0.02

0.286+/-0.038

Pi

0.056+/- 0.102

0.000+/-0.001

0.001+/-0.001

0.001+/-0.001

0.0017+/-0.003

0.003+/-0.004

0.0005+/-0.001

China

Vietnam

Philippines

Taiwan

Laos

Malaysia

Nepal

hd

0.378+/- 0.033

0.778+/-0.019

0.200+/-0.024

0.378+/-0.033

0.200+/-0.024

0.222+/-0.028

0.833+/-0.016

Pi

0.004+/-0.006

0.002+/-0.0036

0.000+/-0.0006

0.000+/-0.0012

0.000+/-0.0006

0.000+/-0.0006

0.003+/-0.0044

Japan

Mariana Islands

Salomon Island

Guam

Hawaii

Reunion

Cambodia

hd

0.400+/-0.0563

0.417+/-0.036

0.0

0.00

0.200+/-0.023

0.378+/-0.0328

0.286+/-0.0385

Pi

0.0006+/-0.0008

0.000+/-0.001

0.0

0.00

0.00034+/-0.00060

0.00312+/-0.00503

0.00049+/-0.00069

3.1.3. Haplotype Networks
Twenty-seven haplotypes were enumerated for our dataset. The haplotypes H1, H4, H5, H8, H14, and H26 are common. H1 is the majority haplotype with 142 individuals representing 78.02% of the 182 sequences and is shared in all sampled localities except Reunion. Haplotype 26 is a private haplotype consisting of 8 animals all from Reunion. Haplotype 8 is a common haplotype containing 4 individuals including 1 from Sri Lanka, 1 from Indonesia, 1 from China and 1 from the Philippines. Common haplotype 14 consists of 3 individuals from Vietnam, Taiwan, and Malaysia. The haplotypes 4 and 5 each have 2 individuals: haplotype 4 with Bangladesh and Laos and haplotype 5 with Bangladesh and Nepal. The individual haplotypes are 21 in number, including 4 from Sri Lanka (Hap_9, 10, 11 and 12), 4 from Nepal (Hap_18, 19, 20 and 21), 2 from Bangladesh (Hap_6 and Hap_7), 2 from Vietnam (Hap_15 and Hap_16), 2 from Reunion (Hap_25 and Hap_27), 1 from Hawaii (Hap_24), 1 from Taiwan (Hap_17), 1 from China (Hap_13), 1 from Thailand (Hap_3), 1 from Tanzania (Hap_2), 1 from Cambodia (Hap_22) and 1 from the Northern Mariana Islands (Hap_23). In the network (Figure 1), some haplotypes are regrapped into haplogroups (SN1 and SL2). Haplogroup SN1 includes the haplotypes H1, H2, H3, H4, H5, H6, H7, H11, H12, H14, H15, H17, H19, H20, H21, H22, H23, and H24. In the SL2 haplogroup (8 individuals) are concentrated the haplotypes H8, H9, H10, H16, and H18. The SN1 haplogroup is distributed in all sampled countries except the Reunion; it is composed of 163 individuals, or 89.56% of the total population. The SL2 haplogroup with 2.19% of the total population is composed mainly of individuals coming from Sri Lanka. The haplotypes H13 (located in China), H25, H26 and H27 (all located in Reunion) are individual and private, representing 0.54% of the total population for each.
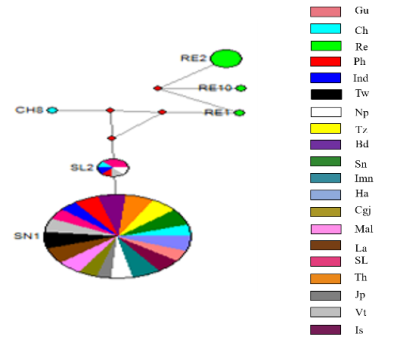
Figure 1. Haplotype network of Zeugodacus cucurbitae. The size of circles is proportional to the number of individuals in the haplotype or the number of haplotypes in the haplogroup.
3.2. Structuration and Genetic Distance
Analysis of genetic differentiation (Fst) (Table 4) shows that only the Fst between the population of the meeting and all other populations are significant; between the population of Nepal and the populations of Senegal, Tanzania, Laos, and Hawaii. There is a very large difference between the Reunion population and other populations. There is a slight difference between the populations of Nepal and those of Senegal, Tanzania, Laos, and Hawaii.
Table 4. Fst values taken between populations.

Nepal

P-value

Reunion

P-value

Senegal

0.012

0.013

0.997

0,00

Tanzania

0.009

0.046

0.997

0.00

Thailand

0.997

0.00

Bangladesh

0.994

0.00

Sri Lanka

0.996

0.00

Indonesia

0.997

0.00

China

0.997

0.00

Vietnam

0.996

0.00

Philippines

0.997

0.00

Taiwan

0.994

0.00

Laos

0.09

0.039

0.996

0.00

Malaysia

0.996

0.00

Nepal

0.996

0.00

Cambodia

0.996

0.00

Japan

0.996

0.00

Mariana Islands

0.997

0.00

Salomon Island

0.996

0.00

Guam

0.996

0.00

Hawaii

0,009

0,041

0.997

0.00

3.3. Genetic Distances
Considering two groups, with group 1 (G1) comprising all countries and group 2 (G2) composing all island sites.
The analysis of the genetic distance (Table 5) between the distance among populations within G1 is high and exceeds that observed within G2, which remains low. This suggest greater homogeneity among island populations and substantial differentiation among population in G1. Furthermore, the genetic distance between the two groups is higher than the within group distances. The COI gene displays marked genetic diversity between these groups.
Table 5. Genetic distances between countries and islands.

Distances

Intragroup distances

Intergroup distances

SD

Groups

G2

0.001

0.213

0.028

0.017

G1

0.338

0.000

If we consider the population of Reunion as a group, and all the other populations as another group, we obtain results in Table 6.
Table 6. Genetic distances between 2 groups.

Distances

Intragroup distances

Intergroup distances

SD

Groups

Reunion

0.003

0.213

0.001

0.017

Pays

0,001

0,000

If we consider as a group all the countries belonging to the same continent, we have five (5) groups which are: Africa, Asia, Oceania, Europe and the United States.
1. Intragroup distances
Genetic distances (Table 7) within Africa, Oceania, and US group are zero. The COI presents uniformity at the level of these 3 groups. On the other hand, they are low between the populations of the Asian group and those of Europe.
Table 7. Intra-group distances between continents.

Groups

Distances

SD

Africa

0.000

0.000

Asia

0.001

0.000

Oceania

0.000

0.000

Europe

0.003

0.001

US

0.000

0.000

2. Interpopulation distances
The results in Table 8 show high genetic distances between populations of the European group and those of other groups. This shows an isolation of the group from Europe compared to other groups. The genetic distance between the populations of the Africa group, the Oceania group and the United States group is zero. Similarly, the genetic distance between the populations of these 3 groups and those of the Asian group is very low.
Table 8. Inter-group genetic distances between continents.

Groups

Genetic distances

SD

Africa-Asia

0.001

0.000

Africa-Oceania

0.000

0.000

Asia-Oceania

0.001

0.000

Africa- United States

0.000

0.000

Asia- United States

0.001

0.000

Oceania- United States

0.000

0.000

Africa-Europe

0.954

0.080

Asia-Europe

0.955

0.080

Oceania-Europe

0.954

0.080

United States -Europe

0.954

0.080

3.4. Correlation Test Between Genetic Distance and Geographical Distance
The calculated p-value (0.012) is lower than the alpha signification level = 0.05 (Table 9), we must reject the null hypothesis H0 and retain the alternative hypothesis Ha. There is indeed a correlation between geographical distance (Matrix A) and genetic differentiation (Matrix B). (Figures 2 & 3).
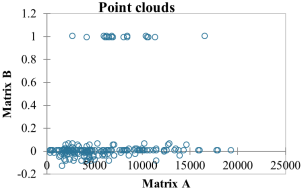
Figure 2. Correlation between geographical distances and Fst of Z. cucurbitae.
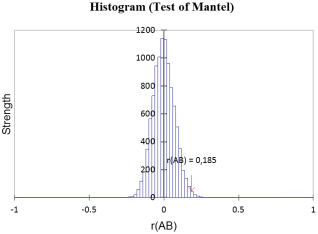
Figure 3. Mantel Pearson-type histogram of Z. cucurbitae.
Table 9. Test of Mantel results.

r (AB)

p-value

alpha

0.185

0.012

0.05

3.5. Structuration
The analysis of molecular variance by AMOVA of the 2 groups (Table 10) indicates that most of the molecular variance is due to the high average genetic differentiation between groups representing 99.81% of the total variation. The differentiation between individuals of the same population being very low is 0.19% of the total variation. However, the differentiation index (Fst) between groups is high and significant (0.99812).
Table 10. AMOVA test for 2 groups: Reunion and other populations.

Source of Variation

d.f

Sum of squares

Variance component

Variance percentage

Between groups

1

3107.501

164.39391Va

99.81

Between populations inside groups

18

5.006

-0.00345Vb

-0.00

Inside populations

162

50.103

0.30928Vc

0.19

Total

181

3162.610

164.69975

Indices of fixation

Fst entre groupes = 0.99812 p value: 0.00000+-0.00000

3.6. Demographic Evolution: D of Tajima and Fs of Fu
Results of Tables 11 and 12 indicate the values of Tajima’s D and Fu’s Fs significant within the populations. For all these populations, the values of D of Tajima and Fs of Fu are significantly negative, so we retain a demographic expansion of these regions.
Table 11. D Tajima of populations.

Populations

D of Tajima

P value

Bangladesh

-1.66706

0.03350

China

-1.72953

0.02990

Vietnam

-1.66706

0.02830

Nepal

-1.76663

0.01700

Reunion

-1.63600

0.04160

Table 12. Fs Fu of populations.

Populations

D of Tajima

P value

Bangladesh

2.84720

0.00160

Sri Lanka

-2.01642

0.04930

Vietnam

-1.34464

0.04530

Taiwan

-1.16394

0.03670

Nepal

-2.87184

0.00820

3.7. Phylogenetic Approach
The phylogenetic tree displays two clades (Figure 4). The first clade contains the haplotypes of Reunion. On the other hand, the second clade is composed of two subclades; one formed by haplotypes H8, H9, H10 from Sri Lanka, H13 from China, H16 from Vietnam and H18 from Nepal, and the larger one contains the remaining haplotypes. The Bayesian inference tree reflects the results of the haplotypes network.
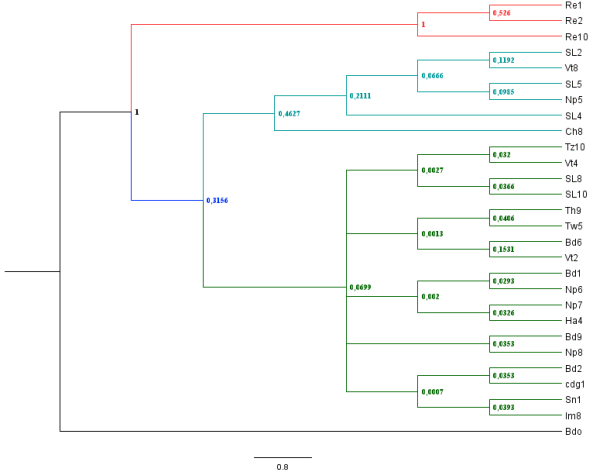
Figure 4. Phylogenetic tree of haplotypes by the Bayesian inference method.
4. Discussion
The objective of this study is to genetically characterize populations of Zeugodacus cucurbitae, watermelon pest insect, at the global level.
Our dataset contains 182 sequences. After sequence analysis, we found a high degree of polymorphism (52.70% on all sites, 96.15% of which are informative in parsimony and 3.84% are variable singletons). According to Gasparich et al. , the ancestor populations generally have high levels of genetic diversity unlike recent populations. Which suggests that our populations are close to the ancestor populations. The populations of Bangladesh, Sri Lanka, Vietnam, and Nepal all have high haplotypical (Hd) diversity and low nucleotide (Pi) diversity. This would indicate that these populations have a diversified genetic origin of ancestral populations which would have undergone a bottleneck followed by rapid population growth with an accumulation of mutations. This could be explained by the use of anthropogenic methods to control this pest. These results are somewhat in agreement with the work of Wu et al. which suggests that western populations (Nepal, Bangladesh, Thailand, Burma, and western China) exhibit greater diversity than eastern regions. Prabhakar et al. state that the population expansion of this pest insect is an event related to hot post-Pleistocene climatic conditions with a small number of founder populations. On the other hand, all other populations have low nucleotide and haplotypic diversities; therefore these populations would have undergone a severe and prolonged demographic bottleneck which could be due to climate changes, interspecific competition because Denno et al. concluded that interspecific competition significantly affected the distribution and abundance of phytophagous insects. This would lead to a genetic homogenization affirmed by the studies of Prabhakar et al. with whom we have populations in common; they argue that the populations of Zeugodacus cucurbitae are homogeneous regardless of their geographical distribution. The set of populations presents strong haplotypic and nucleotide diversities; therefore an admixture, that is to say a mix of genes from different ancestral populations. This may result from migrations or gene flow between populations. The nucleotide changes made on all sequences allowed to detect 27 haplotypes with H1 being the dominant haplotype present in all populations except the Reunion population. The relationship between the mitochondrial haplotypes was revealed by the network that shows 2 closely related haplogroups (SN1 and SL2), an individual haplotype at the level of Chinese propulsion and the three grouped haplotypes (H25, H26, H27) of the Reunion population distant from the latter. The unique H13 haplotype of the Chinese population would result from a recent mutation. This is not in agreement with the studies of Hu et al. which estimate that the Chinese melon fly populations as a single and homogeneous phyletic unit. These three haplotypes within the Reunionese population reflect a greater intra-population diversity than between other countries. These results are supported by the intra-group distance within Reunion (0.003) which is greater than that between countries (0.001). Our results are in agreement with those of Jacquard et al. , who using ten microsatellites on two mitochondrial gene fragments found the existence of three genetically distinct groups of Z. cucurbitae at Reunion Island all clearly different from their African and Asian parents. The genetic differentiation index Fst between the Reunion population and other populations varies between 94 and 97%, which could be synonymous with a genetic isolation that could be due to geographical barriers, habitat differences that have limited gene flow. The strong genetic distance (0.213) between them testifies to this. The intra-population diversity within the meeting population could be a consequence of host preference due to specific intra competition. Our results are supported by the work of Virgilio et al. who showed that the samples from the island of Reunion are genetically different from all other groups. The slight genetic differentiation between Nepal and the populations of Senegal, Tanzania, Laos and Hawaii would be justified by limited gene flow.
The Mantel Test reveals a correlation between geographical distance and Fst (bilateral p value < 0.05) (Figure 2). This finding is supported by the Mantel histogram (Figure 3) which presents a symmetric unimodal distribution. In other words, geographical distance would influence the genetic structuring of melon fly populations. This does not accord with the work of Wu et al. in which there is no Reunion population and where geographical distances do not seem to influence the genetic structuring of the different melon fly populations. Molecular analysis (AMOVA) further confirms this genetic peculiarity of Reunion but also that there is no genetic differentiation between the other populations. This lack of genetic differentiation could be explained by the strong migratory capacity of Z. cucurbitae. The significant values of Tajima’s D and Fu’s Fs for the populations recorded in Tables 11 and 12 show a population growth that could be linked to climatic conditions. Globally at the level of each phylogenetic tree there is a clade that groups only individuals from the Reunion population. This would mean that this new variant of the Chinese population would come from the Reunionese population. This confirms the isolation by distance of the latter with the works of Virgilio et al. which asserted a significant correlation between geographical distances and genetic distances. There is a clade that groups only the individuals from Vietnam and Bangladesh present in all the trees, so the individuals of these populations would share mutations. The Bayesian inference tree presents more similarities with the haplotype network and reveals that melon fly populations can be subdivided into two main groups corresponding to populations coming from Reunion (1) and other continents (2). This is not in agreement with the work of Virgilio et al. which subdivided these populations into five groups, including the African continent (1), Reunion (2), Central Asia (3), East Asia (4), and Hawaii (5).
5. Conclusion
This study, based on the genetic characterization of Z. cucurbitae populations using cytochrome oxidase I (COI), revealed the existence of isolation by distance and genetic structuring according to 2 groups: Reunion and other continents. An adaptation to the environment following a recent expansion of Reunion’s population from an African or Asian melon fly population could be at the origin of this isolation. Furthermore, environmental differences have favoured genetic divergence.
Moreover, an intra-population structuring has been detected within the Reunionese population. This may be due to host preference in some populations given that the melon fly has a polyphagous diet.
Further studies would provide a better understanding of the structuring of Z. cucurbitae populations as distinct populations or subpopulations may have different responses to control methods such as pesticides or biological control agents.
Abbreviations

Re

Reunion

SL

Sri Lanka

Vt

Vietnam

Np

Nepal

Ch

China

Tz

Tanzania

Th

Thailand

Tw

Taiwan

Bd

Bangladesh

Ha

Hawaii

Im

Mariana Islands

Bdo

Bactrocera dorsalis

Author Contributions
Madeleine ivonne Mendy: Conceptualization, Writing - original draft, Investigation, Writing - review & editing, Methodology, Software
Toffène Diome: Resources, Writing - review & editing, Formal analysis
Mamecor Faye: Resources, Writing - review & editing, Visualization
Mbacké Sembène: Supervision, Validation
Conflicts of Interest
The authors declare no conflicts of interest.
References
[1] Hdider, C., Tlili, I., & Ilahy, R. (2020). Watermelon. In Nutritional Composition and Antioxidant Properties of Fruits and Vegetables. Elsevier. p. 515-531.
[2] Badji, H., & Coly, E. V. (2010). Gestion des Attaques de la Mouche des Fruits sur les Cultures de Cucurbitacées au Moyen de Pesticides Naturels au Sénégal. International Symposium on Urban and Peri-Urban Horticulture in the Century of Cities: Lessons, Challenges, Opportunitites 1021, 421-426.
[3] Kunprom, C., & Pramual, P. (2017). Genetic structure and demographic history of the melon fly Zeugodacus cucurbitae (Coquillet) (Diptera: Tephritidae) in Thailand. Agr. For. Entomol, 20, 180-190.
[4] White, I. M., De Meyer, M. & Stonehouse, J. M. (2000) A review of native and introduced fruit flies (Diptera, Tephritidae) in the Indian Ocean islands of Mauritius, Réunion, and Seychelles. Proceedings, Indian Ocean Commission, Regional Fruit Fly Symposium (ed. by N. S. Price and S. I. Seewooruthun). Indian Ocean Commission/European Union, Flic en Flac, Mauritius. pp. 15-21.
[5] Dhillon, M. K., Singh, R., Naresh, J. S., & Sharma, H. C. (2005). The melon fruit fly, Bactrocera cucurbitae: A review of its biology and management. Journal of Insect Science, 5(1), 40-56.
[6] Bezzi, M. (1913). Indian Trypaneids [Trypetids](Fruit-Flies) in the Collection of the Indian Museum, Calcutta. Memoirs of The Indian Museum, 3, 53-168.
[7] Nishida T, Bess HA (1957). Studies on the ecology and control of the melon fly Dacus (Strumeta) cucurbitae Coquillet (Diptera: Tephritidae). Hawaii Agricultural Experiment Station, University of Hawaii. Tech Bull 84: 12-29.
[8] Virgilio, M., Delatte, H., Backeljau, T., & De Meyer, M. (2010). Macrogeographic population structuring in the cosmopolitan agricultural pest Bactrocera cucurbitae (Diptera: Tephritidae). Molecular Ecology, 19(13), 2713-2724.
[9] Jacquard, C., Virgilio, M., David, P., Quilici, S., De Meyer, M., & Delatte, H. (2013). Population structure of the melon fly, Bactrocera cucurbitae, in Reunion Island. Biological Invasions, 15(4), 759-773.
[10] Delatte, H., De Meyer, M., & Virgilio, M. (2019). Genetic structure and range expansion of Zeugodacus Cucurbitae (Diptera: Tephritidae) in Africa. Bulletin of Entomological Research, 109(6), 713-722.
[11] Hu Jian, H. J., Zhang, J. L., Nardi, F., & Zhang, R. J. (2008). Population genetic structure of the melon fly, Bactrocera cucurbitae (Diptera: Tephritidae), from China and Southeast Asia. 134, 319-324.
[12] Prabhakar, C. S., Mehta, P. K., Sood, P., Singh, S. K., Sharma, P., & Sharma, P. N. (2012). Population genetic structure of the melon fly, Bactrocera cucurbitae (Coquillett) (Diptera: Tephritidae) based on mitochondrial cytochrome oxidase (COI) gene sequences. Genetica, 140(1-3), 83-91.
[13] Wu, Y., McPheron, B. A., Wu, J., & Li, Z. (2012). Genetic relationship of the melon fly, Bactrocera cucurbitae (Diptera: Tephritidae) inferred from mitochondrial DNA. Insect Science, 19(2), 195-204.
[14] Warot, S. F. (2018). Caractérisation moléculaire et isolements reproducteurs chez des auxiliaires de lutte biologique. Mémoire. Université Paris sciences et lettres, Paris. 94p. HAL Id: hal-03236272
[15] Avise, J. C., Arnold, J., Ball, R. M., Bermingham, E., Lamb, T., Neigel, J. E., Reeb, C. A., & Saunders, N. C. (1987). Intraspecific phylogeography: The Mitochondrial DNA Bridge Between Population Genetics and Systematics. Annual Review of Ecology and Systematics, 18(1), 489-522.
[16] Hebert, P. D. N., Cywinska, A., Ball, S. L., & deWaard, J. R. (2003). Biological identifications through DNA barcodes. Proceedings of the Royal Society of London. Series B: Biological Sciences, 270(1512), 313-321.
[17] Ndiaye, M. R. (2018). Evolution phylogéographique et structure génétique des populations de Sitophilus zeamais (Coleoptera, Curculionidae), ravageur du maïs stocke en Afrique de l’Ouest [Phdthesis, Université Cheikh Anta DIOP de Dakar, Sénégal ; Faculté des Sciences et Techniques; Département de Biologie Animale]. 178p.
[18] Sabir, J. S. M., Rabah, S., Yacoub, H., Hajrah, N. H., Atef, A., Al-Matary, M., Edris, S., Alharbi, M. G., Ganash, M., Mahyoub, J., Al-Hindi, R. R., Al-Ghamdi, K. M., Hall, N., Bahieldin, A., Kamli, M. R., & Rather, I. A. (2019). Molecular evolution of cytochrome C oxidase-I protein of insects living in Saudi Arabia. PLoS ONE, 14(11), 1-18.
[19] NDONG, A., THIAW, C., Diallo, B., SARR, M., DIOME, T., KANE, M., & SEMBENE, M. (2015). Barcoding: Comparison of Variation Degree of COI and Cytochrome b Mitochondrial Markers in Two Species Primary Maize Pests (Sitophilus zeamais and Sitophilus oryzae). International Journal of Sciences: Basic and Applied Research, 20(1), 373-393.
[20] Avise, J. C. (2000). Phylogeography: The history and formation of species. Harvard university press. Cambridge, MA. 441p.
[21] Saccone, C., De Giorgi, C., Gissi, C., Pesole, G., & Reyes, A. (1999). Evolutionary genomics in Metazoa: The mitochondrial DNA as a model system. Gene, 238(1), 195-209.
[22] Hall, T. A. (1999). BioEdit: A user-friendly biological sequence alignment editor and analysis program for Windows 95/98/NT. Nucleic acids symposium series, 41(41), p 95-98.
[23] Librado, P., & Rozas, J. (2009). DnaSP v5: A software for comprehensive analysis of DNA polymorphism data. Bioinformatics, 25(11), 1451-1452.
[24] Tamura, K., Stecher, G., Peterson, D., Filipski, A., & Kumar, S. (2013). MEGA6: Molecular evolutionary genetics analysis version 6.0. Molecular biology and evolution, 30(12), 2725-2729.
[25] Nei, M. (1973). Analysis of Gene Diversity in Subdivided Populations. Proceedings of the National Academy of Sciences, 70(12), 3321-3323.
[26] Nei, M. (1977). F ‐statistics and analysis of gene diversity in subdivided populations. Annals of Human Genetics, 41(2), 225-233.
[27] Bandelt, H. J., Forster, P., Röhl, A., (1999). Median-joining networks for inferring intraspecific phylogenies. Molecular Biology and Evolution, 16(1), 37-48,
[28] Excoffier, L., & Lischer, H. E. L. (2010). Arlequin suite ver 3.5: A new series of programs to perform population genetics analyses under Linux and Windows. Molecular Ecology Resources, 10(3), 564-567.
[29] Huelsenbeck, J. P., & Ronquist, F. (2001). MRBAYES: Bayesian inference of phylogenetic trees. Bioinformatics, 17(8), 754-755.
[30] Rambaut, A., & Drummond, A. J. (2012). Figtree, a graphical viewer of phylogenetic trees. V. 1.4. 0. Available from
[31] Gasparich, G. E., Silva, J. G., Han, H.-Y., Mcpheron, B. A., Steck, G. J., & Sheppard, W. S. (1997). Population genetic structure of Mediterranean fruit fly (Diptera: Tephritidae) and implications for worldwide colonization patterns. Annals of the Entomological Society of America, 90(6), 790-797.
[32] Denno, R. F., McClure, M. S., & Ott, J. R. (1995). Interspecific interactions in phytophagous insects: Competition reexamined and resurrected. Annual review of entomology, 40(1), 297-331.
[33] Jacquard, C., Virgilio, M., Quilici, S., De Meyer, M., & Delatte, H. (2012). Spatial scales of genetic structuring in Bactrocera cucurbitae (Diptera, Tephritidae): Population structure on la Réunion.
Cite This Article
  • APA Style

    Mendy, M. I., Diome, T., Faye, M., Sembène, M. (2025). Genetic Characterization of Populations of Zeugodacus Cucurbitae (Coquillet, 1899), a Watermelon Pest. International Journal of Genetics and Genomics, 13(4), 83-94. https://doi.org/10.11648/j.ijgg.20251304.12

    Copy | Download

    ACS Style

    Mendy, M. I.; Diome, T.; Faye, M.; Sembène, M. Genetic Characterization of Populations of Zeugodacus Cucurbitae (Coquillet, 1899), a Watermelon Pest. Int. J. Genet. Genomics 2025, 13(4), 83-94. doi: 10.11648/j.ijgg.20251304.12

    Copy | Download

    AMA Style

    Mendy MI, Diome T, Faye M, Sembène M. Genetic Characterization of Populations of Zeugodacus Cucurbitae (Coquillet, 1899), a Watermelon Pest. Int J Genet Genomics. 2025;13(4):83-94. doi: 10.11648/j.ijgg.20251304.12

    Copy | Download

  • @article{10.11648/j.ijgg.20251304.12,
      author = {Madeleine Ivonne Mendy and Toffène Diome and Mamecor Faye and Mbacké Sembène},
      title = {Genetic Characterization of Populations of Zeugodacus Cucurbitae (Coquillet, 1899), a Watermelon Pest
    },
      journal = {International Journal of Genetics and Genomics},
      volume = {13},
      number = {4},
      pages = {83-94},
      doi = {10.11648/j.ijgg.20251304.12},
      url = {https://doi.org/10.11648/j.ijgg.20251304.12},
      eprint = {https://article.sciencepublishinggroup.com/pdf/10.11648.j.ijgg.20251304.12},
      abstract = {Zeugodacus cucurbitae or melon fly formerly called Bactrocera cucurbitae is an agricultural pest of Asian origin. Well known as a pest of fleshy fruits and vegetables damaging 81 host plants, the melon fly has been the subject of several studies due to its introduction and dissemination worldwide. Up to now, no study on the global structuring of Zeugodacus cucurbitae has been done. Therefore, knowledge of its genetic structuring would allow better management of the insect. It is in this context that the present study on the genetic characterization of populations of Z. cucurbitae watermelon pest insect fits. Our data was collected from the Genbank database. Phylogeographic analyses were made using mitochondrial cytochrome oxidase I (COI) DNA as a genetic marker. After analysis, the study demonstrated two distinct groups: a group composed of the population of Reunion and another group composed of populations from Africa, Asia, Oceania, and Hawaii. This is the result of a genetic isolation demonstrated by the Mantel Test for which the significant p-value confirms the correlation between genetic distances and geographical distances. However, there is a genetic differentiation between individuals in the Reunion population. For any fight against this insect, it would be interesting to take into account the existence of these two genetic groups.
    },
     year = {2025}
    }
    

    Copy | Download

  • TY  - JOUR
    T1  - Genetic Characterization of Populations of Zeugodacus Cucurbitae (Coquillet, 1899), a Watermelon Pest
    
    AU  - Madeleine Ivonne Mendy
    AU  - Toffène Diome
    AU  - Mamecor Faye
    AU  - Mbacké Sembène
    Y1  - 2025/10/14
    PY  - 2025
    N1  - https://doi.org/10.11648/j.ijgg.20251304.12
    DO  - 10.11648/j.ijgg.20251304.12
    T2  - International Journal of Genetics and Genomics
    JF  - International Journal of Genetics and Genomics
    JO  - International Journal of Genetics and Genomics
    SP  - 83
    EP  - 94
    PB  - Science Publishing Group
    SN  - 2376-7359
    UR  - https://doi.org/10.11648/j.ijgg.20251304.12
    AB  - Zeugodacus cucurbitae or melon fly formerly called Bactrocera cucurbitae is an agricultural pest of Asian origin. Well known as a pest of fleshy fruits and vegetables damaging 81 host plants, the melon fly has been the subject of several studies due to its introduction and dissemination worldwide. Up to now, no study on the global structuring of Zeugodacus cucurbitae has been done. Therefore, knowledge of its genetic structuring would allow better management of the insect. It is in this context that the present study on the genetic characterization of populations of Z. cucurbitae watermelon pest insect fits. Our data was collected from the Genbank database. Phylogeographic analyses were made using mitochondrial cytochrome oxidase I (COI) DNA as a genetic marker. After analysis, the study demonstrated two distinct groups: a group composed of the population of Reunion and another group composed of populations from Africa, Asia, Oceania, and Hawaii. This is the result of a genetic isolation demonstrated by the Mantel Test for which the significant p-value confirms the correlation between genetic distances and geographical distances. However, there is a genetic differentiation between individuals in the Reunion population. For any fight against this insect, it would be interesting to take into account the existence of these two genetic groups.
    
    VL  - 13
    IS  - 4
    ER  - 

    Copy | Download

Author Information
  • Abstract
  • Keywords
  • Document Sections

    1. 1. Introduction
    2. 2. Materials and Methods
    3. 3. Results
    4. 4. Discussion
    5. 5. Conclusion
    Show Full Outline
  • Abbreviations
  • Author Contributions
  • Conflicts of Interest
  • References
  • Cite This Article
  • Author Information