Comminution flow sheet design is a critical process in the production of iron ore. In this study, the flow rate was fixed at 150 t/h with the Crusher specification of a Cedarapids JC24x36 jaw crusher model and a Nordberg Hp 300 S/M cone crusher. Based on the mineralogical information and ore properties provided the Agg Flow Version 460.22 software is used to conduct, a comprehensive comminution flow sheet design to achieve the desired particle size distribution. In the comminution of primary crusher stage Iron ore at top size of 42 inches or (1066.8 mm) generates 5 different ranges of materials, the first is at a size of 45 mm, the second at 10 mm, and the third is at 8 mm, between 15 and 8 mm and between 23.5 and 15 mm. The primary crusher, a Cedarapids JC2436 Model Jaw crusher, was required to reduce the feed size with closed side setting of 69.85 mm to a manageable size of end product 21 Mtph for further processing. The Nordberg Hp 300 S/M cone crusher was used as a secondary crusher with closed side setting (CSS) of 28 mm to further reduce the particle size to 26 Mtph. To complete the task several choices analyzed and as final design used 1 jaw crusher Cedarapids Jc 2436, and two cone crushers Nordberg HP 300 S/M. some screening and conveyors placed in the design to increase the reduction ratio of the equipment.
| Published in | International Journal of Mineral Processing and Extractive Metallurgy (Volume 10, Issue 1) |
| DOI | 10.11648/j.ijmpem.20251001.11 |
| Page(s) | 1-26 |
| Creative Commons |
This is an Open Access article, distributed under the terms of the Creative Commons Attribution 4.0 International License (http://creativecommons.org/licenses/by/4.0/), which permits unrestricted use, distribution and reproduction in any medium or format, provided the original work is properly cited. |
| Copyright |
Copyright © The Author(s), 2025. Published by Science Publishing Group |
Comminution, Crusher, Flow Sheet
2 Deck Inclined Screen 2 Deck Screen (2) - Deck 1 | |||
|---|---|---|---|
Grading | % Pass | % Ret. | TPH |
1066.8 | 100 | 0 | 0 |
914.4 | 80.5 | 19.5 | 20.4 |
508 | 61 | 19.5 | 20.4 |
406.4 | 49.3 | 11.7 | 12.2 |
355.6 | 42.8 | 6.5 | 6.8 |
304.8 | 37.6 | 5.2 | 5.4 |
254 | 29.8 | 7.8 | 8.2 |
203.2 | 23.3 | 6.5 | 6.8 |
152.4 | 14.2 | 9.1 | 9.5 |
101.6 | 4.7 | 9.5 | 9.9 |
80 | 0 | 4.7 | 4.9 |
76.2 | 0 | 0 | 0 |
Total | - - | 100 | 105 |
2 Deck Inclined Screen 2 Deck Screen (2) - Deck 2 | |||
|---|---|---|---|
Grading | % Pass | % Ret. | TPH |
80 | 100 | 0 | 0 |
76.2 | 91.7 | 8.3 | 0.85 |
50.8 | 27.8 | 63.9 | 6.5 |
45 | 10.7 | 17 | 1.7 |
38.1 | 8.2 | 2.5 | 0.26 |
25.4 | 4.5 | 3.7 | 0.38 |
19.05 | 2.6 | 2 | 0.2 |
12.7 | 1.5 | 1.1 | 0.11 |
4.76 | 0.2 | 1.3 | 0.14 |
2.38 | 0 | 0.2 | 0.02 |
Total | - - | 100 | 10.2 |
2 Deck Inclined Screen 2 Deck Screen (2) – Output | |||
|---|---|---|---|
Grading | % Pass | % Ret. | TPH |
45 | 100 | 0 | 0 |
38.1 | 91.5 | 8.5 | 1.8 |
25.4 | 74.7 | 16.8 | 3.6 |
19.05 | 61.5 | 13.1 | 2.8 |
12.7 | 51.1 | 10.4 | 2.2 |
4.76 | 27.4 | 23.7 | 5 |
2.38 | 19.2 | 8.2 | 1.8 |
2 | 17.3 | 1.9 | 0.41 |
0.595 | 8.3 | 9 | 1.9 |
0.297 | 5.8 | 2.6 | 0.54 |
0.149 | 2.6 | 3.2 | 0.68 |
0.074 | 0 | 2.6 | 0.54 |
0 | 0 | 0 | 0 |
Total | - - | 100 | 21.2 |
JC 2436 Jaw Crusher (4) – Output | |||
|---|---|---|---|
Grading | % Pass | % Ret. | TPH |
127 | 100 | 0 | 0 |
101.6 | 90 | 10 | 10.5 |
88.9 | 81 | 9 | 9.4 |
76.2 | 72 | 9 | 9.4 |
69.85 | 67.5 | 4.5 | 4.7 |
63.5 | 62.5 | 5 | 5.2 |
57.15 | 58 | 4.5 | 4.7 |
50.8 | 53 | 5 | 5.2 |
44.45 | 48 | 5 | 5.2 |
38.1 | 42 | 6 | 6.3 |
31.75 | 37 | 5 | 5.2 |
25.4 | 31 | 6 | 6.3 |
22.23 | 28 | 3 | 3.1 |
19.05 | 22.5 | 5.5 | 5.8 |
15.88 | 21 | 1.5 | 1.6 |
12.7 | 18 | 3 | 3.1 |
9.53 | 13.7 | 4.3 | 4.5 |
7.94 | 12.3 | 1.4 | 1.5 |
6.35 | 10.3 | 2 | 2.1 |
4.76 | 8 | 2.3 | 2.4 |
2.38 | 4.6 | 3.4 | 3.6 |
2 | 3.9 | 0.7 | 0.73 |
1.19 | 3.4 | 0.5 | 0.52 |
0.595 | 1.4 | 2 | 2.1 |
0.42 | 1.2 | 0.2 | 0.21 |
0.297 | 1 | 0.2 | 0.21 |
0.149 | 0.5 | 0.5 | 0.52 |
0 | 0 | 0.5 | 0.52 |
Total | - - | 100 | 105 |
Conveyor Flow Stream – Input | (to cone crusher) | ||
|---|---|---|---|
Grading | % Pass | % Ret. | TPH |
127 | 100 | 0 | 0 |
101.6 | 81.7 | 18.3 | 10.5 |
88.9 | 65.2 | 16.5 | 9.4 |
80 | 53.7 | 11.5 | 6.6 |
76.2 | 47.3 | 6.4 | 3.7 |
69.85 | 36.2 | 11.1 | 6.3 |
63.5 | 24.2 | 12 | 6.9 |
63 | 23.3 | 0.9 | 0.5 |
57.15 | 12.6 | 10.7 | 6.1 |
56 | 10.3 | 2.3 | 1.3 |
51 | 9.2 | 1.1 | 0.64 |
50.8 | 9.2 | 0.1 | 0.03 |
45 | 7.8 | 1.3 | 0.77 |
44.45 | 7.7 | 0.1 | 0.05 |
38.1 | 6.6 | 1.2 | 0.67 |
38 | 6.5 | 0 | 0.01 |
32 | 4.7 | 1.8 | 1.1 |
31.75 | 4.6 | 0.1 | 0.04 |
25.4 | 2.9 | 1.7 | 0.99 |
25 | 2.8 | 0.1 | 0.05 |
22.23 | 2.1 | 0.7 | 0.38 |
22 | 2.1 | 0.1 | 0.04 |
19.05 | 1.4 | 0.6 | 0.36 |
19 | 1.4 | 0 | 0 |
16 | 1 | 0.5 | 0.27 |
15.88 | 1 | 0 | 0.01 |
13 | 0.6 | 0.4 | 0.22 |
12.7 | 0.5 | 0 | 0.02 |
10 | 0.3 | 0.3 | 0.16 |
9.53 | 0.2 | 0 | 0.03 |
8 | 0.1 | 0.1 | 0.06 |
7.94 | 0.1 | 0 | 0 |
6.35 | 0 | 0.1 | 0.05 |
6 | 0 | 0 | 0.01 |
Total | - - | 100 | 57.2 |
Conveyor 01 Stream – Input | |||
|---|---|---|---|
Grading | % Pass | % Ret. | TPH |
56 | 100 | 0 | 0 |
51 | 90.5 | 9.5 | 5 |
50.8 | 90.1 | 0.4 | 0.22 |
45 | 77.3 | 12.8 | 6.8 |
44.45 | 76.3 | 1 | 0.52 |
38.1 | 63.1 | 13.2 | 7 |
38 | 62.9 | 0.2 | 0.09 |
32 | 37.9 | 25 | 13.2 |
31.75 | 36.9 | 1.1 | 0.56 |
25.4 | 7.9 | 29 | 15.3 |
25 | 6 | 1.8 | 0.97 |
22.23 | 4.7 | 1.3 | 0.7 |
22 | 4.6 | 0.1 | 0.07 |
19.05 | 3.3 | 1.3 | 0.66 |
19 | 3.3 | 0 | 0.01 |
16 | 2.3 | 1 | 0.5 |
15.88 | 2.3 | 0 | 0.02 |
13 | 1.5 | 0.8 | 0.42 |
12.7 | 1.5 | 0.1 | 0.03 |
10 | 0.9 | 0.5 | 0.29 |
9.53 | 0.8 | 0.1 | 0.05 |
8 | 0.6 | 0.2 | 0.11 |
7.94 | 0.6 | 0 | 0 |
6.35 | 0.4 | 0.2 | 0.1 |
6 | 0.4 | 0 | 0.02 |
4.76 | 0.2 | 0.2 | 0.08 |
4 | 0.1 | 0.1 | 0.04 |
2.38 | 0 | 0.1 | 0.06 |
2 | 0 | 0 | 0.01 |
Total | - - | 100 | 52.7 |
Deck with 25 mm mesh | |||
|---|---|---|---|
Conveyor Flow Stream – Input | |||
Grading | % Pass | % Ret. | TPH |
25 | 100 | 0 | 0 |
22.23 | 81.8 | 18.2 | 6.5 |
22 | 79.8 | 1.9 | 0.69 |
19.05 | 59.5 | 20.3 | 7.2 |
19 | 59.4 | 0.2 | 0.06 |
16 | 41.2 | 18.1 | 6.5 |
15.88 | 40.6 | 0.6 | 0.23 |
13 | 22 | 18.6 | 6.6 |
12.7 | 20.5 | 1.5 | 0.54 |
10 | 3.6 | 16.8 | 6 |
9.53 | 3.3 | 0.4 | 0.13 |
8 | 2.4 | 0.8 | 0.3 |
7.94 | 2.4 | 0 | 0.01 |
6.35 | 1.7 | 0.8 | 0.27 |
6 | 1.5 | 0.2 | 0.06 |
4.76 | 0.9 | 0.6 | 0.22 |
4 | 0.6 | 0.3 | 0.11 |
2.38 | 0.1 | 0.5 | 0.17 |
2 | 0 | 0.1 | 0.03 |
Total | - - | 100 | 35.6 |
Product Pile End Product Stockpile (7) – Output | |||
|---|---|---|---|
Grading | % Pass | % Ret. | TPH |
10 | 100 | 0 | 0 |
9.53 | 96.1 | 3.9 | 1 |
8 | 85.9 | 10.3 | 2.7 |
7.94 | 85.5 | 0.4 | 0.1 |
6.35 | 73.9 | 11.6 | 3.1 |
6 | 71 | 2.8 | 0.75 |
4.76 | 58.2 | 12.8 | 3.4 |
4 | 50.3 | 7.9 | 2.1 |
2.38 | 33.2 | 17.1 | 4.5 |
2 | 28.5 | 4.7 | 1.2 |
1.19 | 21.3 | 7.3 | 1.9 |
0.595 | 9.4 | 11.8 | 3.1 |
0.42 | 7.5 | 1.9 | 0.51 |
0.297 | 5.9 | 1.6 | 0.42 |
0.149 | 3 | 2.9 | 0.78 |
0 | 0 | 3 | 0.78 |
Total | - - | 100 | 26.3 |
HP 300 S/M cone crusher (15) – Output | |||
|---|---|---|---|
Grading | % Pass | % Ret. | TPH |
32 | 100 | 0 | 0 |
25 | 98 | 2 | 1.9 |
22 | 95 | 3 | 2.9 |
19 | 92 | 3 | 2.9 |
16 | 80 | 12 | 11.5 |
13 | 66 | 14 | 13.5 |
10 | 55 | 11 | 10.6 |
8 | 45 | 10 | 9.6 |
6 | 36 | 9 | 8.7 |
4 | 26 | 10 | 9.6 |
2 | 13 | 13 | 12.5 |
0 | 0 | 13 | 12.5 |
Total | - - | 100 | 88.3 |
Product Pile End Product Stockpile (17) – Output | |||
|---|---|---|---|
Grading | % Pass | % Ret. | TPH |
8 | 100 | 0 | 0 |
6 | 81.8 | 18.2 | 7.1 |
4 | 60.4 | 21.4 | 8.4 |
2 | 31 | 29.4 | 11.5 |
0 | 0 | 31 | 12.2 |
Total | - - | 100 | 39.2 |
Product Pile End Product Stockpile (18) – Output | |||
|---|---|---|---|
Grading | % Pass | % Ret. | TPH |
15 | 100 | 0 | 0 |
13 | 72.6 | 27.4 | 7.4 |
10 | 39.1 | 33.5 | 9.1 |
8 | 7.5 | 31.5 | 8.5 |
6 | 4.7 | 2.8 | 0.76 |
4 | 2.4 | 2.3 | 0.62 |
2 | 0.6 | 1.8 | 0.49 |
0 | 0 | 0.6 | 0.17 |
Total | - - | 100 | 27.1 |
End Product Stockpile (19) – Output | |||
|---|---|---|---|
Grading | % Pass | % Ret. | TPH |
23.5 | 100 | 0 | 0 |
22 | 94.2 | 5.8 | 1.3 |
19 | 82.5 | 11.7 | 2.6 |
16 | 34.8 | 47.7 | 10.5 |
15 | 15.9 | 18.9 | 4.1 |
13 | 11.9 | 3.9 | 0.86 |
10 | 8.1 | 3.9 | 0.85 |
8 | 5.3 | 2.8 | 0.61 |
6 | 3.3 | 2 | 0.43 |
4 | 1.7 | 1.6 | 0.35 |
2 | 0.4 | 1.3 | 0.27 |
0 | 0 | 0.4 | 0.09 |
Total | - - | 100 | 21.9 |
CIDs | Channel Iron Deposits |
DID | Detrital Iron Deposits |
EAF | Electric Arc Furnace |
COS | Combined on the Coarse Ore Stockpile |
POSCO | Prospecting and South Korean Steel Giant |
FCL | Ferruginous Clay |
IOCG | Iron Oxide Coated Gangue |
XRD | X-ray Diffraction |
OM | Optical Microscope |
CSS | Closed Side Setting |
AEPA | Addis Ababa Environmental Protection Authority |
| [1] | Clout, J. M. F., & Manuel, J. R. (2022). Mineralogical, chemical, and physical metallurgical characteristics of iron ore. In Iron Ore (pp. 59-108). Woodhead Publishing. |
| [2] | Lessard, J., de Bakker, J., & McHugh, L. (2014). Development of ore sorting and its impact on mineral processing economics. Minerals Engineering, 65, 88-97. |
| [3] | Jankovic, A. (2015). Developments in iron ore comminution and classification technologies. Iron Ore, 251-282. |
| [4] | Ohmoto, H. (2003). Nonredox transformations of magnetite-hematite in hydrothermal systems. In Mineralogical, chemical, and physical characteristics of iron ore (pp. Econ. Geol. 98, 157–161). |
| [5] | Morris, R. (1985). In Mineralogical, chemical, and physical characteristics of iron ore, Elsevier (pp. 73–235.). Amsterdam. |
| [6] | Weller, K. R., Morrell, S. and Gottlieb, P., 1996. Use of grinding and liberation models to simulate tower mill circuit performance in a lead/zinc concentrator to increase flotation recovery. International Journal of Mineral Processing, 44, pp. 683-702. |
| [7] | Zhang, X., Han, Y., & Kawatra, S. K. (2021). Effects of grinding media on grinding products and flotation performance of sulfide ores. Mineral Processing and Extractive Metallurgy Review, 42(3), 172-183. |
| [8] | Bustillo Revuelta, M., & Bustillo Revuelta, M. (2018). Mineral Processing. Mineral Resources: From Exploration to Sustainability Assessment, 423-530. |
| [9] | Mwanga, A., Parian, M., Lamberg, P., & Rosenkranz, J. (2017). Comminution modeling using mineralogical properties of iron ores. Minerals Engineering, 111, 182-197. |
| [10] | Parapari, P. S., Parian, M., & Rosenkranz, J. (2020). Breakage process of mineral processing comminution machines–An approach to liberation. Advanced Powder Technology, 31(9), 3669-3685. |
| [11] | Mariano, R. A. (2016). Measurement and modelling of the liberation and distribution of minerals in comminuted ores. |
| [12] | Altun, O., & Altun, D. (2021). Estimation of mineral liberation distribution functions to be used in modelling of impact and attrition milling. Minerals Engineering, 173, 107236. |
| [13] | Hamid, M. (2017). Recent Developments in the Separation of Low-Grade Iron Ore. Procedia Engineering, 190, pp. 68-75. |
| [14] | Burt, R. (1984). Development in Mineral Processing-gravity Concentration Technology. In Elsevier. Amsterdam. |
| [15] | Bevan, R. R. (1977). Review of industrial size reduction equipment used in the processing of coal. [Rotary breakers, roll crushers, hammer mills, impactors, tumbling mills, roller mills and misc]. |
| [16] | Major K. ((2002):). Types and Characteristics of Crushing Equipment and Circuit Flowsheet. Reaserchgate, Vol.1, pp 566-583. |
APA Style
Tilahun, E., Mesert, G., Negese, A. (2025). Communition Circuit Flowsheet Development for Optimum Performance of Iron Ore Processing, in the Case of Sekota, Wagehemira, Northern Ethiopia. International Journal of Mineral Processing and Extractive Metallurgy, 10(1), 1-26. https://doi.org/10.11648/j.ijmpem.20251001.11
ACS Style
Tilahun, E.; Mesert, G.; Negese, A. Communition Circuit Flowsheet Development for Optimum Performance of Iron Ore Processing, in the Case of Sekota, Wagehemira, Northern Ethiopia. Int. J. Miner. Process. Extr. Metall. 2025, 10(1), 1-26. doi: 10.11648/j.ijmpem.20251001.11
@article{10.11648/j.ijmpem.20251001.11,
  author = {Ephrem Tilahun and Getahun Mesert and Ageru Negese},
  title = {Communition Circuit Flowsheet Development for Optimum Performance of Iron Ore Processing, in the Case of Sekota, Wagehemira, Northern Ethiopia},
  journal = {International Journal of Mineral Processing and Extractive Metallurgy},
  volume = {10},
  number = {1},
  pages = {1-26},
  doi = {10.11648/j.ijmpem.20251001.11},
  url = {https://doi.org/10.11648/j.ijmpem.20251001.11},
  eprint = {https://article.sciencepublishinggroup.com/pdf/10.11648.j.ijmpem.20251001.11},
  abstract = {Comminution flow sheet design is a critical process in the production of iron ore. In this study, the flow rate was fixed at 150 t/h with the Crusher specification of a Cedarapids JC24x36 jaw crusher model and a Nordberg Hp 300 S/M cone crusher. Based on the mineralogical information and ore properties provided the Agg Flow Version 460.22 software is used to conduct, a comprehensive comminution flow sheet design to achieve the desired particle size distribution. In the comminution of primary crusher stage Iron ore at top size of 42 inches or (1066.8 mm) generates 5 different ranges of materials, the first is at a size of 45 mm, the second at 10 mm, and the third is at 8 mm, between 15 and 8 mm and between 23.5 and 15 mm. The primary crusher, a Cedarapids JC2436 Model Jaw crusher, was required to reduce the feed size with closed side setting of 69.85 mm to a manageable size of end product 21 Mtph for further processing. The Nordberg Hp 300 S/M cone crusher was used as a secondary crusher with closed side setting (CSS) of 28 mm to further reduce the particle size to 26 Mtph. To complete the task several choices analyzed and as final design used 1 jaw crusher Cedarapids Jc 2436, and two cone crushers Nordberg HP 300 S/M. some screening and conveyors placed in the design to increase the reduction ratio of the equipment.},
 year = {2025}
}
TY  - JOUR
T1  - Communition Circuit Flowsheet Development for Optimum Performance of Iron Ore Processing, in the Case of Sekota, Wagehemira, Northern Ethiopia
AU  - Ephrem Tilahun
AU  - Getahun Mesert
AU  - Ageru Negese
Y1  - 2025/02/10
PY  - 2025
N1  - https://doi.org/10.11648/j.ijmpem.20251001.11
DO  - 10.11648/j.ijmpem.20251001.11
T2  - International Journal of Mineral Processing and Extractive Metallurgy
JF  - International Journal of Mineral Processing and Extractive Metallurgy
JO  - International Journal of Mineral Processing and Extractive Metallurgy
SP  - 1
EP  - 26
PB  - Science Publishing Group
SN  - 2575-1859
UR  - https://doi.org/10.11648/j.ijmpem.20251001.11
AB  - Comminution flow sheet design is a critical process in the production of iron ore. In this study, the flow rate was fixed at 150 t/h with the Crusher specification of a Cedarapids JC24x36 jaw crusher model and a Nordberg Hp 300 S/M cone crusher. Based on the mineralogical information and ore properties provided the Agg Flow Version 460.22 software is used to conduct, a comprehensive comminution flow sheet design to achieve the desired particle size distribution. In the comminution of primary crusher stage Iron ore at top size of 42 inches or (1066.8 mm) generates 5 different ranges of materials, the first is at a size of 45 mm, the second at 10 mm, and the third is at 8 mm, between 15 and 8 mm and between 23.5 and 15 mm. The primary crusher, a Cedarapids JC2436 Model Jaw crusher, was required to reduce the feed size with closed side setting of 69.85 mm to a manageable size of end product 21 Mtph for further processing. The Nordberg Hp 300 S/M cone crusher was used as a secondary crusher with closed side setting (CSS) of 28 mm to further reduce the particle size to 26 Mtph. To complete the task several choices analyzed and as final design used 1 jaw crusher Cedarapids Jc 2436, and two cone crushers Nordberg HP 300 S/M. some screening and conveyors placed in the design to increase the reduction ratio of the equipment.
VL  - 10
IS  - 1
ER  -
Mineral Industry Development Institute, Ministry of Mines, Addis Ababa, Ethiopia
Mineral Industry Development Institute, Ministry of Mines, Addis Ababa, Ethiopia
Department of Mining Engineering, College of Engineering and Technology, Injibara University, Injibara, Ethiopia
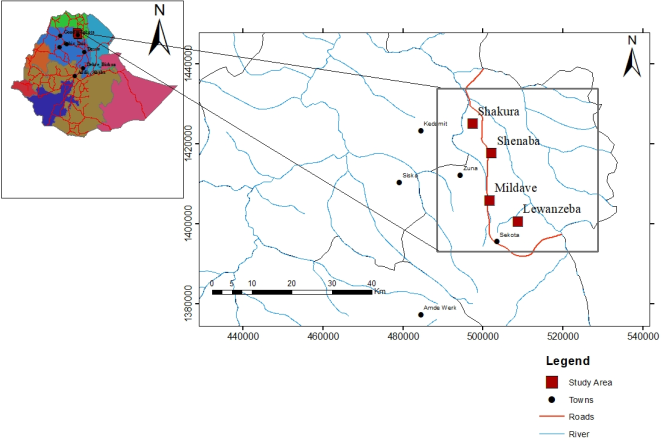
Figure 1. Sampling localities of study Area.
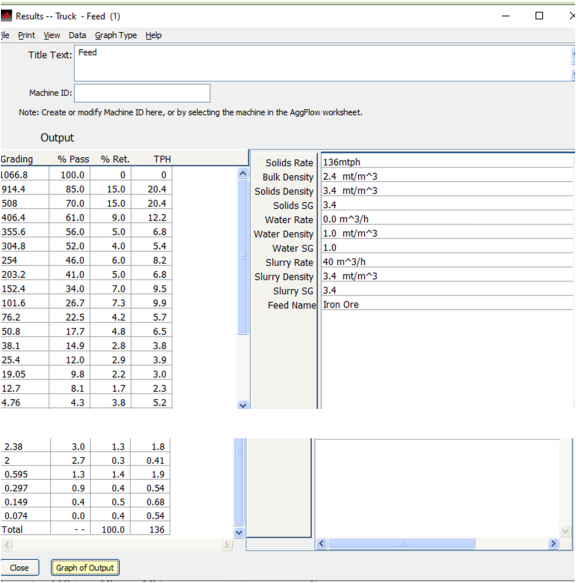
Figure 2. Material being loaded.
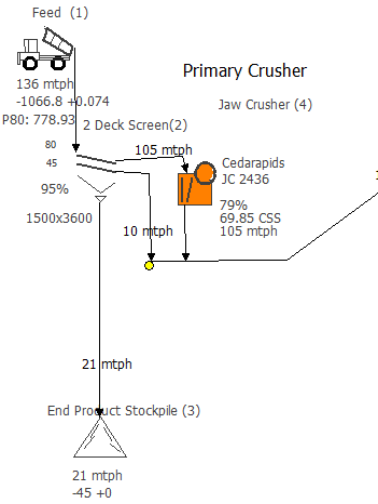
Figure 3. Primary Crushing.
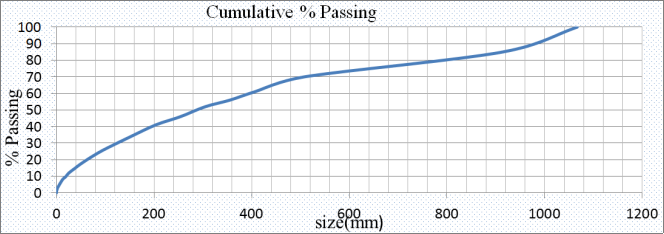
Figure 4. Feed Cumulative Passing curve.
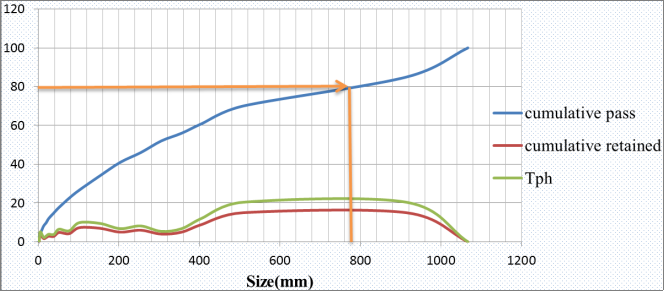
Figure 5. Feed Graph.

Figure 6. Screen Deck 1 cumulative pass graph.
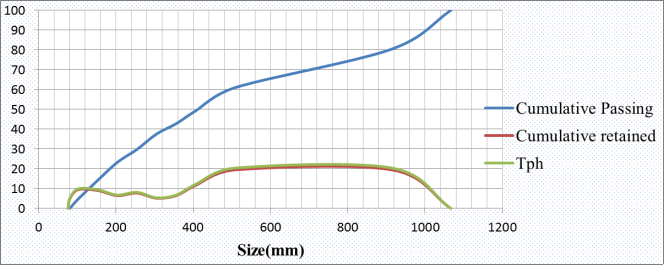
Figure 7. Screen Deck 1 graph.
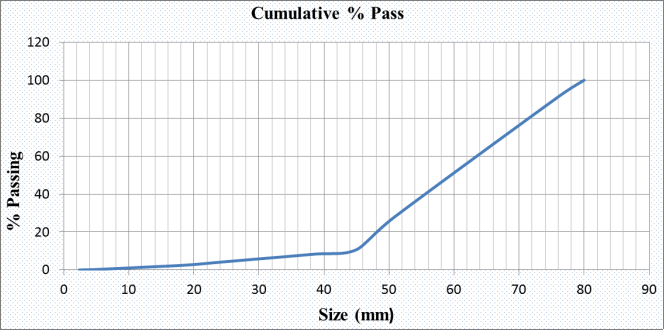
Figure 8. Screen Deck 2 cumulative pass graph.
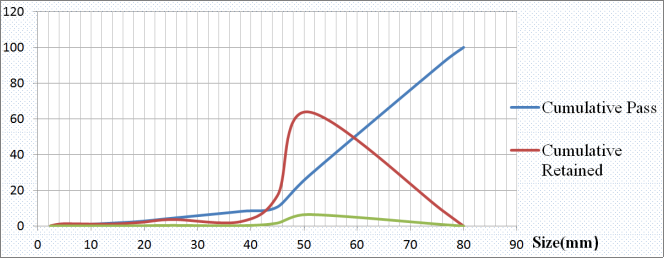
Figure 9. Screen Deck 2 graph.
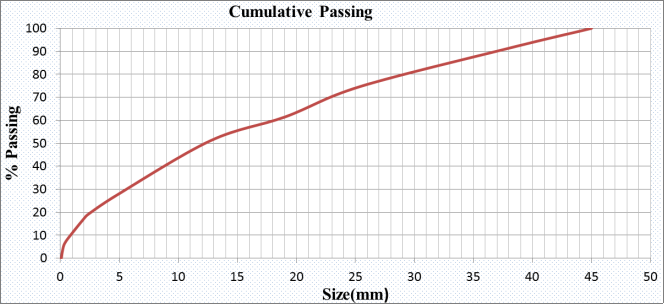
Figure 10. Primary crusher end product stockpile Cumulative passing graph.
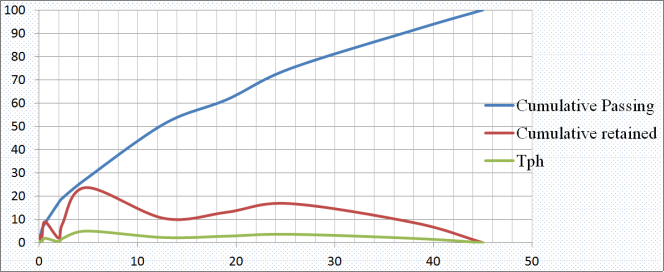
Figure 11. Primary crusher end product stockpile graph.
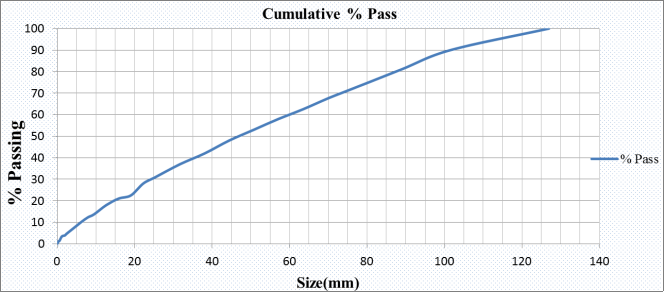
Figure 12. Jaw Crusher output passing graph.
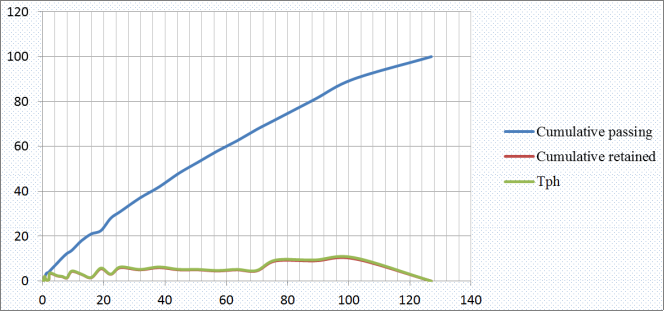
Figure 13. Jaw Crusher output graph.
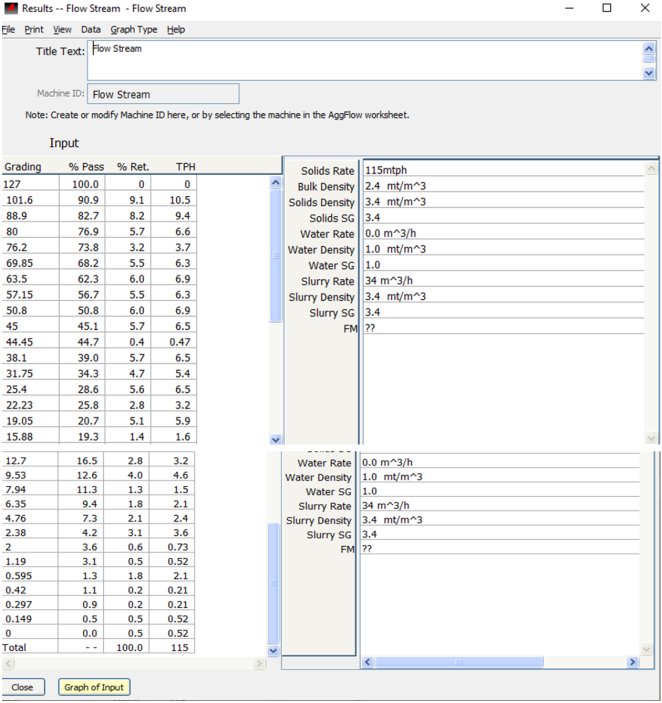
Figure 14. Flow stream from the primary crushing.
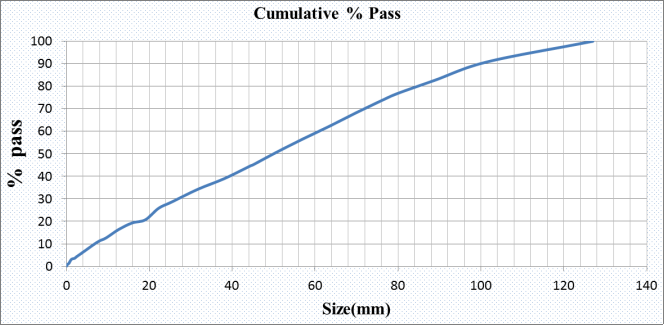
Figure 15. Secondary crusher flow stream passing graph.
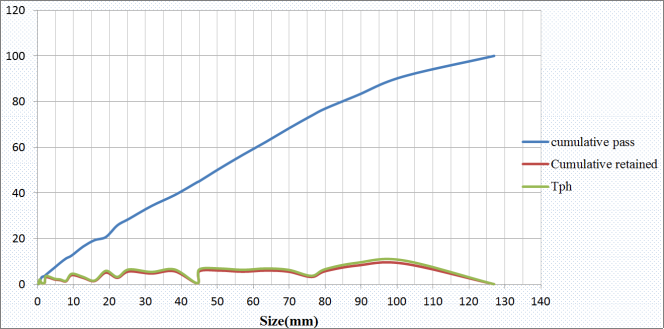
Figure 16. Secondary crusher flow stream graph.
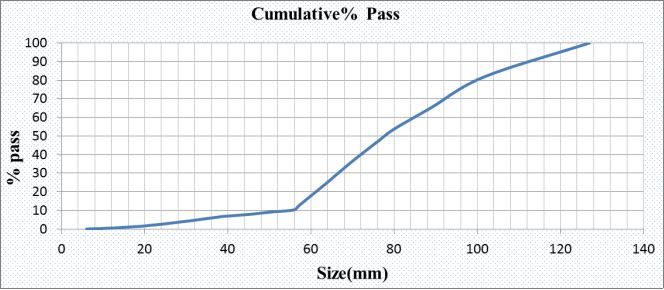
Figure 17. Flow Stream to Cone Crusher Cumulative Passing graph.
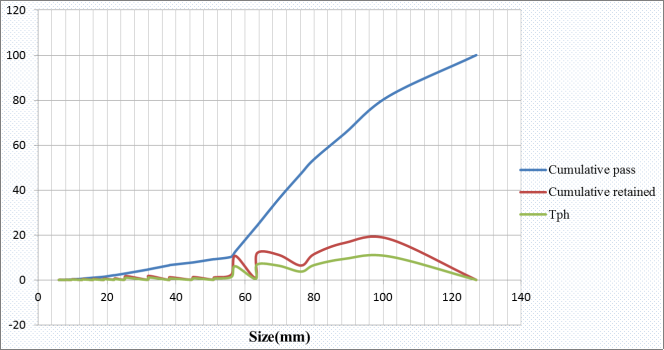
Figure 18. Flow Stream to Cone Crusher graph.
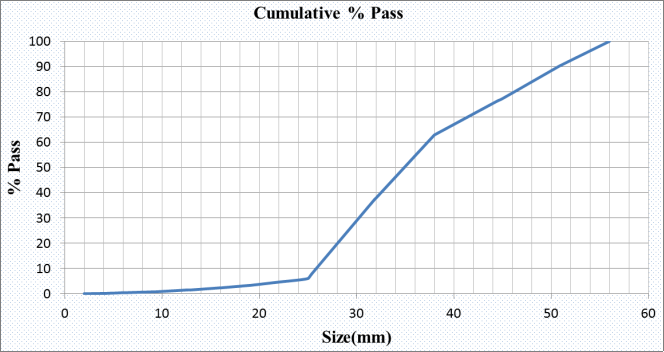
Figure 19. Cut size (50 mm) Deck screen to belt conveyor passing graph.
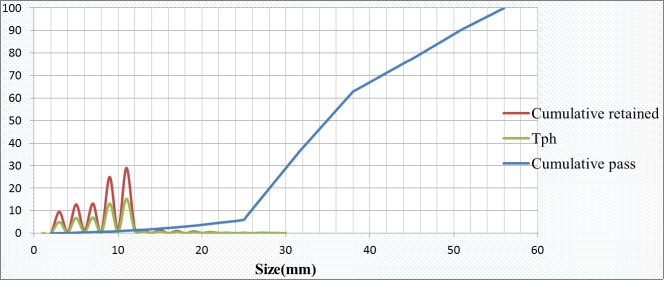
Figure 20. Cut size (50 mm) Deck screen to belt conveyor relation graph.
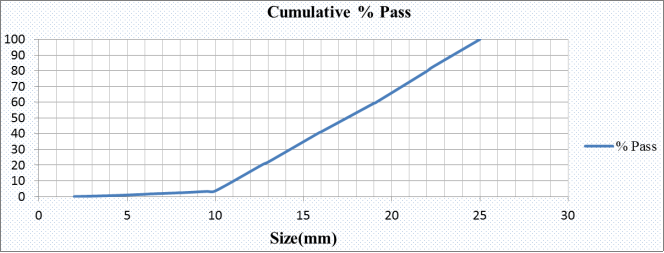
Figure 21. Cut size (25 mm) to Belt conveyor passing graph.
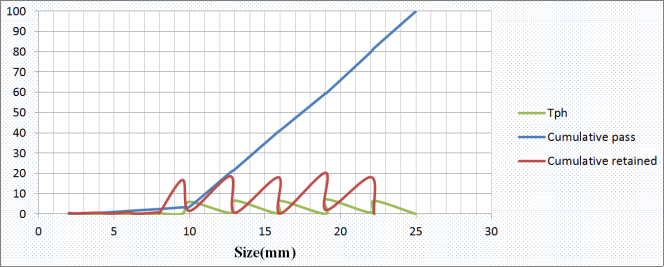
Figure 22. Cut size (25 mm) to Belt conveyor graph.
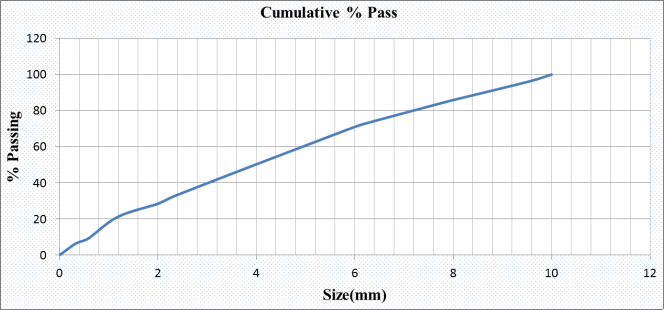
Figure 23. End product stockpile result on secondary crusher.
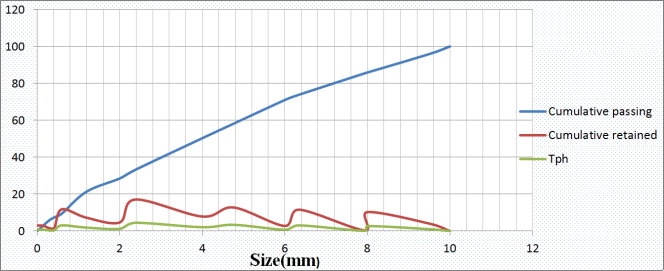
Figure 24. End Product stockpile graph on secondary crusher.

Figure 25. Tertiary Crusher.
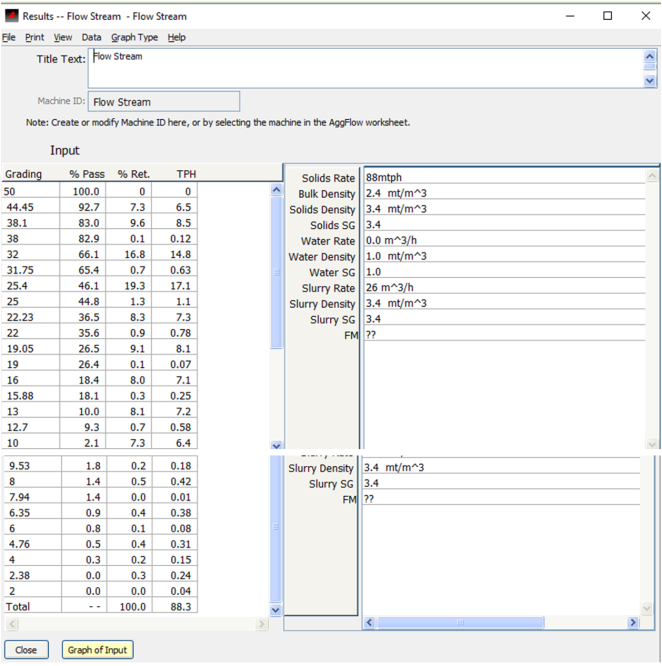
Figure 26. Flow stream from the secondary crushing.
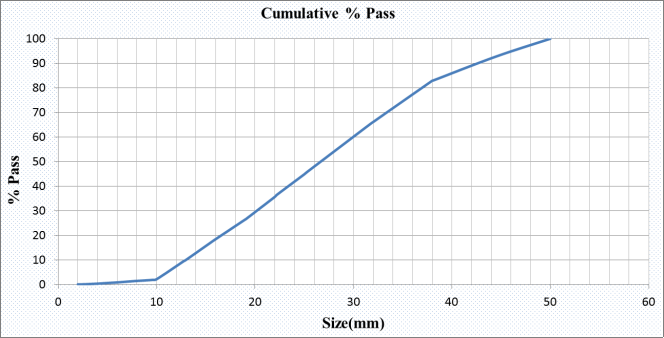
Figure 27. Cumulative Pass graph of tertiary crusher feed.
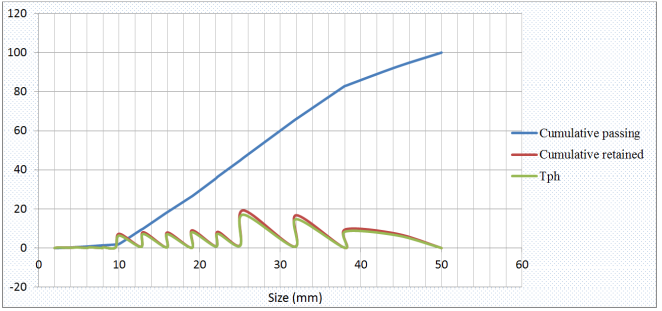
Figure 28. Cumulative graph of tertiary crusher feed.
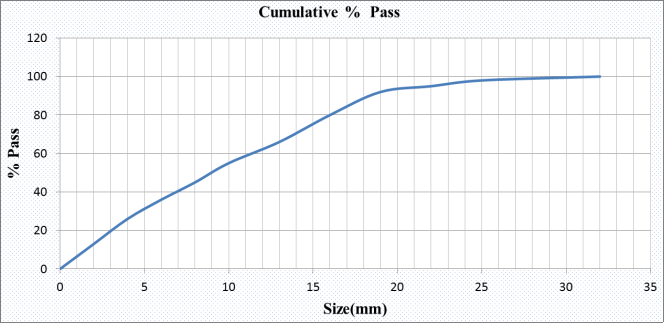
Figure 29. Cone crusher output pass graph on tertiary crusher.
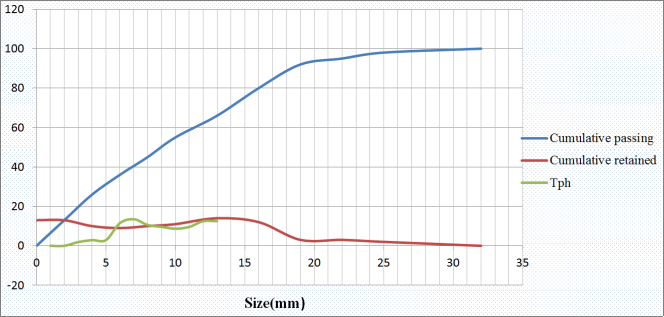
Figure 30. Cone crusher output graph on tertiary crusher.
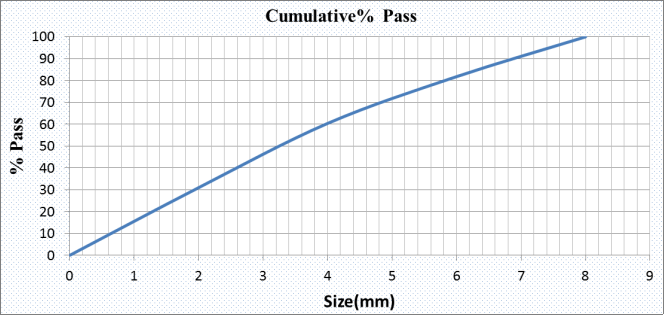
Figure 31. End Product Stockpile (17) - Output pass graph on tertiary crusher.
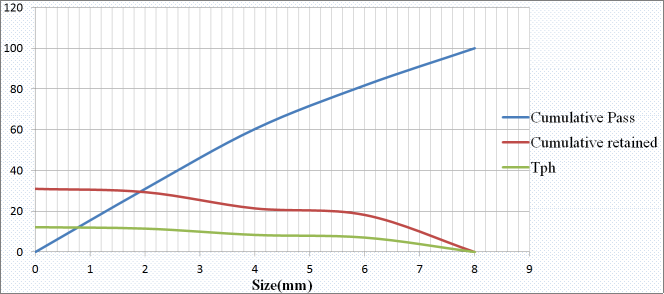
Figure 32. End Product Stockpile (17) - Output graph on tertiary crusher.
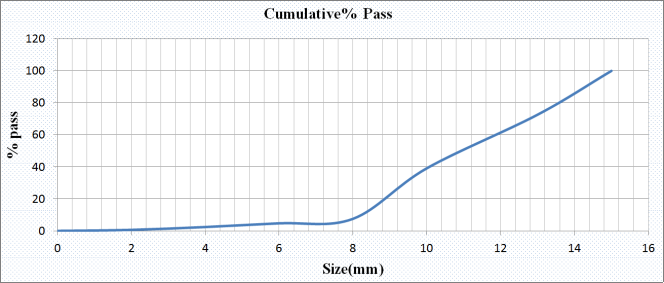
Figure 33. End Product Stockpile (18) - Output pass graph on tertiary crusher.
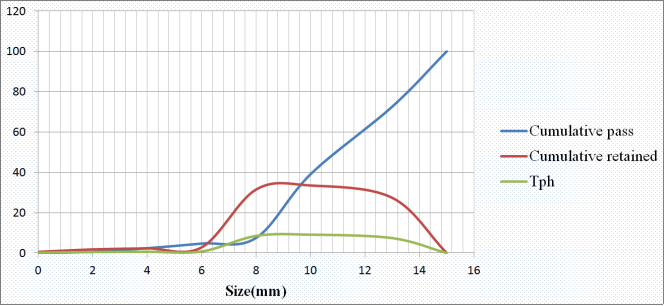
Figure 34. End Product Stockpile (18) - Output graph on tertiary crusher.
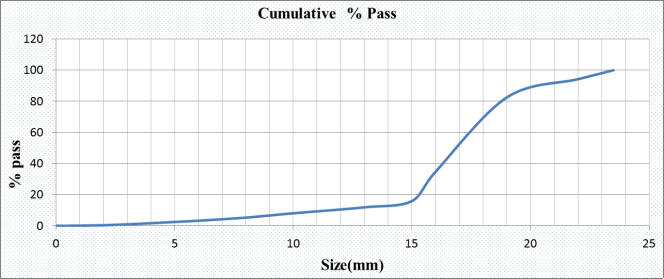
Figure 35. End Product Stockpile (19) - Output pass graph on tertiary crusher.
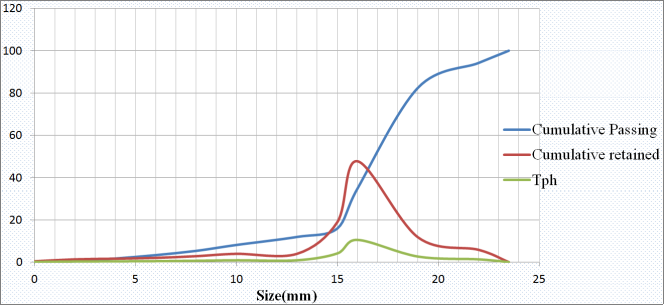
Figure 36. End Product Stockpile (19) - Output graph on tertiary crusher.
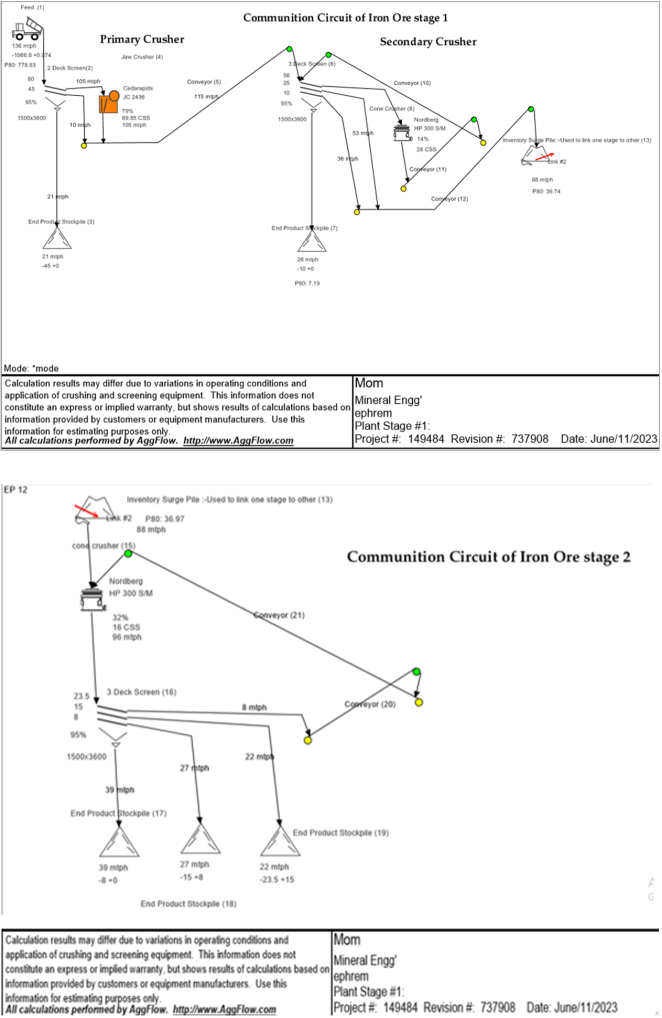
Figure 37. Overall view of the Comminution Flow sheet project.
Information

