2. Physical Model and Magnetic Parameters
2.1. Description of the Simulated Solar Cell
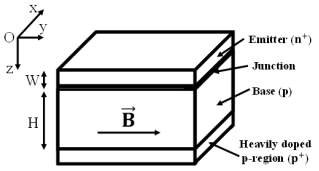
Figure 1. Simulated solar cell model.
The study is based on a three-dimensional columnar model centered on a single grain of polycrystalline silicon. A magnetic field is applied perpendicularly to the plane of the junction, thereby altering the charge carrier transport conditions. In this context, the expressions for the diffusion coefficient and the diffusion length are given respectively by:
where:
1) D: classical diffusion coefficient in the absence of a magnetic field (en cm²·s⁻¹),
2) μ: charge carrier mobility (en cm²·V⁻¹·s⁻¹),
3) B: applied magnetic field intensity (en teslas, T),
4) τ: average lifespan of minority shareholders (en secondes, s),
These relations reflect the reduction in the effective carrier mobility caused by the magnetic deflection induced by the applied field.
As illustrated in the previous figures, the bifacial solar cell under investigation comprises four main functional regions:
1) The emitter, of n⁺ type and reduced thickness (ranging from 0.5 to 1µm), is heavily doped with donor atoms at concentrations between 1e17 and 1e19 cm−3. It is covered with a metal grid that ensures the collection of photogenerated carriers.
2) The p-n junction, also referred to as the space charge region (SCR), is located between the emitter and the base. It features a strong internal electric field that efficiently separates electron-hole pairs reaching this zone.
3) The base, of p-type, is lightly doped with acceptors in the range of 1e15 to 1e17 cm-3, and serves as the main active region for carrier generation, diffusion, and recombination. Its thickness, denoted by H, is a variable parameter in this study and ranges from 100 to 400µm depending on the configuration.
4) The Back Surface Field (BSF) region, located at the rear side of the base, is heavily doped with acceptors (p⁺ type) at concentrations between 1e17 and 1e19 cm-3. It induces an electric field oriented toward the junction, promoting the return of minority carriers generated near the back surface.
To simplify the modeling approach, the following assumptions are made:
1) The contribution of the emitter to the overall photocurrent generation is considered negligible compared to that of the base.
2) The internal crystalline electric field within the base is disregarded; only the field present across the junction is taken into account.
A three-dimensional modeling framework is adopted, in which the junction is positioned at the origin of the z-axis, and the plane containing this junction defines the origin of the (x, y) coordinate system. The base thickness H is explored as a variable parameter in the range of 100 to 400µm.
The continuity equation governing the diffusion of minority photogenerated charge carriers in the base is as follows:
(3)
where D* represents the diffusion coefficient and L* represents the diffusion length.
G(z) represents the generation rate, and its expression is given by the following equation (
4):
and are coefficients derived from the modeling of the generation rate, considering the entire solar radiation spectrum when n is equal to 1.5 AM;
Where n is the number of suns.
The general solution of this continuity equation is given by the following expression (
5):
(5)
with:
The coefficients and are obtained from the boundary conditions at the grain boundaries as follows:
(7)
(8)
Where represents the recombination velocity at the grain boundaries.
By solving these boundary conditions, two transcendental equations are derived from which the coefficients and can be determined either graphically or by using a program.
These equations are as follows:
(10)
By integrating the general solution into the continuity equation, we obtain:
(11)
With:
(13)
and
represent the effective diffusion length and the effective diffusion coefficient, respectively
.
The solution to this equation (
11) is:
(14)
With:
(15)
The constants and are determined from the boundary conditions at the junction and the rear surface as follows:
(16)
(17)
Where Sf is the sum of two contributions:
| [6] | A. DIENG, M. NDIAYE, M. L. SAMB, F. I. BARRO, G. SISSOKO 24th European Photovoltaic Solar Energy Conference and Exhibition, Reference: 1CV.4.16, Abstract No. 1326. |
[6]
, the intrinsic recombination velocity at the junction induced by the shunt resistance, and
| [6] | A. DIENG, M. NDIAYE, M. L. SAMB, F. I. BARRO, G. SISSOKO 24th European Photovoltaic Solar Energy Conference and Exhibition, Reference: 1CV.4.16, Abstract No. 1326. |
[6]
, which represents the current flux imposed by an external charge and defines the operating point of the cell:
is the effective recombination velocity at the rear surface of the solar cell.
2.2. Expression of the Photogenerated Current Density Jph (in A·cm-2)
This section presents the analytical expressions for the photogenerated current density, derived from the solution of the minority carrier continuity equation under three illumination configurations: front-side illumination, rear-side illumination, and dual-face illumination.
The general expression of the photogenerated current density under illumination mode m ∈ {Front, Rear, dual} is given by:
(19)
where:
1) : photogenerated current density for illumination mode mmm (in A·cm-2),
2) q: elementary charge of the electron (1,602.e−19 C),
3) : effective diffusion coefficient under the influence of the magnetic field (cm²/s),
4) : lateral dimensions of the simulation domain along the x and y directions (in cm),
5) : excess minority carrier density induced by optical generation for mode m,
6) : derivative of the excess carrier density evaluated at the junction plane ().
2.2.1. Front-side Illumination
In this configuration, incident photons are absorbed near the top surface, close to the junction, leading to efficient carrier collection. The resulting photogenerated current density is:
(20)
with:
1) : spectral coefficients determined by the boundary conditions in x and y, possibly dependent on magnetic field B,
2) : mode amplitude coefficients for front-side illumination,
3) : modified diffusion length associated with modes (j, k),
4) , : constants derived from the analytical solution, associated with generation and recombination mechanisms.
2.2.2. Rear-side Illumination
Here, the illumination occurs from the bottom side of the cell. Generated carriers must travel a longer distance before reaching the junction, affecting the collection probability.
The expression becomes:
(21)
where:
1) : mode amplitude coefficients for rear-side illumination,
2) H: base thickness of the solar cell (in cm),
3) : exponential attenuation term representing carrier recombination in deeper regions.
2.2.3. Dual-face Illumination
When both front and rear surfaces are illuminated simultaneously, the resulting current density is not a simple sum of the previous cases due to recombination and spatial interactions between both contributions.
The resulting expression is:
(22)
Where:
1) : mode amplitude coefficients under dual-face illumination,
2) : contribution of photogenerated carriers throughout the full base thickness.
3. Results and Discussion
Evaluating the impact of an external magnetic field on carrier transport in bifacial polycrystalline silicon solar cells is critical for optimizing photovoltaic device performance. Applying a magnetic field to a semiconductor modifies the motion of charge carriers (electrons and holes), primarily by inducing Lorentz force effects that reduce their effective diffusion lengths. This directly influences the photogenerated current density, with the magnitude of the impact depending on both the device geometry and the illumination configuration.
The present simulation relies on the classical transport equations for semiconductors, with magnetic field-dependent modifications to the diffusion coefficient and diffusion length, in line with established theories by Sze and Ng
| [1] | S. M. Sze and K. K. Ng, Physics of Semiconductor Devices, 3rd ed., Wiley-Interscience, 2006. |
[1]
, Green
| [2] | M. A. Green, Silicon Solar Cells: Advanced Principles & Practice, Centre for Photovoltaic Devices and Systems, UNSW, 1995. |
[2]
and Schroder
| [7] | D. K. Schroder, Semiconductor Material and Device Characterization, 3rd ed., Wiley, 2006. |
[7]
, and extended magnetic field formulations proposed by Lee et al.
| [3] | K. Lee, J. Park, and H. Kim, “Magnetic field influence on carrier transport in PV cells,” Journal of Applied Physics, vol. 126, no. 12, 2019. |
[3]
. While surface passivation is not explicitly modeled in this framework, its effect on carrier collection is assumed to be negligible in the idealized context of this study
.
Prior to analyzing the main simulation results, it is essential to determine the magnetic field intensity range within which these effects become significant. For this purpose,
Figures 2 and 3 present the variation of the diffusion coefficient and diffusion length as functions of magnetic field strength, helping to establish a relevant operating window for the simulations that follow.
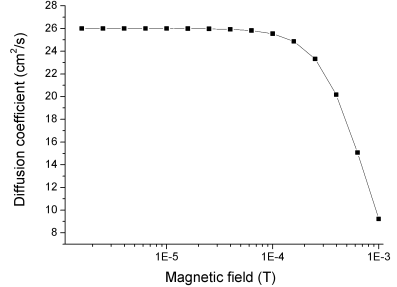
Figure 2. Variation of the carrier diffusion coefficient with magnetic field intensity.
This figure shows that the diffusion coefficient remains constant (around 25 cm²/s) for magnetic field intensities below 10−4 T. Beyond this threshold, a rapid decrease is observed, with the value dropping to approximately 10 cm²/s, indicating a strong reduction in effective mobility due to the magnetic field.
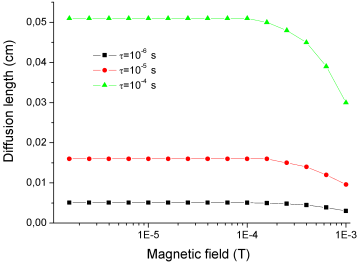
Figure 3. Evolution of the diffusion length as a function of magnetic field, for different carrier lifetimes.
The analysis of this figure reveals that the diffusion length increases with longer carrier lifetimes. However, for magnetic field values below 10−4 T, it remains mostly unchanged. A significant decrease appears only when the field exceeds this limit, especially for carriers with high lifetime values.
These preliminary observations made it possible to define an optimal magnetic field range, starting from 10−4 T, in which transport parameters exhibit pronounced variations. The following sections focus on the combined influence of the magnetic field and base thickness on the photogenerated current density.
The choice of magnetic field intensities between 10
−4 T and 10
−3 T is motivated by preliminary analyses of the diffusion coefficient and diffusion length variations under magnetic influence. As demonstrated in
Figures 2 and 3, magnetic fields below 10
−4 T produce negligible effects on carrier transport parameters, resulting in minimal variation of the photogenerated current density. Conversely, within the range of 10
−4 to 10
−3 T, the impact becomes sufficiently pronounced to highlight the coupling between magnetic perturbations and transport phenomena. This range is therefore appropriate for revealing the magnetic sensitivity of the device and for exploring potential performance degradation under realistic industrial or environmental conditions.
3.1. Influence of Carrier Collection Velocity on the Photogenerated Current Density of a Front-illuminated Solar Cell Under Various Magnetic Fields
i) For a solar cell with a base thickness of 100μm:
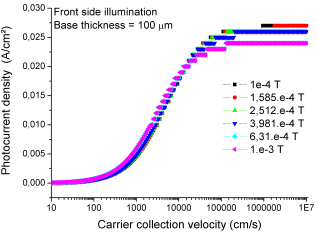
Figure 4 shows how the photocurrent density of a 100μm thick solar cell, front-illuminated, varies with the carrier collection velocity at the p-n junction, which is here interpreted as the carrier collection velocity, under different magnetic field strengths.
Figure 4. Photocurrent density of a 100μm PV cell under front illumination as a function of carrier collection velocity for different magnetic field values.
Three regimes are observed:
1) Regime 1: Low recombination velocities (10 to 100cm/s )
This regime corresponds to a near open-circuit condition, where few carriers are collected, and the photocurrent density remains nearly zero, regardless of the magnetic field intensity.
Figure 4 illustrates this low carrier collection at low recombination velocities, highlighting the photocurrent density's dependence on carrier collection velocity.
2) Regime 2: Intermediate velocities (1e2 to 1e5cm/s )
This is a transition phase toward short-circuit conditions. The photocurrent density increases rapidly, and this growth is more pronounced when the magnetic field is weak, suggesting that the magnetic field hinders carrier collection during this sensitive stage. As shown in the figure, this increase in photocurrent density and its sensitivity to magnetic field intensity is evident.
3) Regime 3: High velocities (1e5 to 1e7cm/s )
The system reaches short-circuit conditions, and the photocurrent density saturates. However, increasing the magnetic field intensity slightly reduces the maximum photocurrent, indicating a negative effect of the magnetic field on carrier transport in this regime. This observation is confirmed by the curves, which show the photocurrent saturation and the impact of the magnetic field.
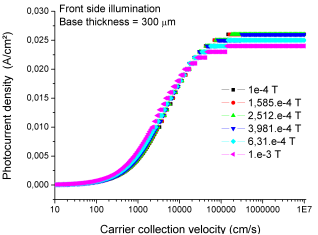
iii) For a solar cell with a base thickness of 300μm:
Figure 5 presents the same analysis for a solar cell with a 300μm base thickness.
Figure 5. Photocurrent density of a 300μm PV cell under front illumination as a function of carrier collection velocityfor different magnetic field values.
The overall behavior remains similar, with the three regions clearly identifiable. However, in comparison with the 100μm cell:
1) The rise in photocurrent during the transition zone (1e2 to 1e5cm/s ) is less pronounced;
2) The saturation level is lower, reflecting greater recombination losses due to the increased base thickness;
3) The magnetic field still reduces the photocurrent, but the effect is less severe than for the thinner cell.
These results demonstrate that although the magnetic field systematically reduces the photogenerated current density, the extent of this influence depends on the base thickness. A thicker base mitigates the detrimental impact of the magnetic field. Nevertheless, achieving high carrier collection velocity (i.e., high carrier collection velocity at the junction) remains critical to ensure optimal photovoltaic performance.
3.2. Influence of Carrier Collection Velocity on the Photogenerated Current Density of a Rear-illuminated Solar Cell Under Various Magnetic Fields
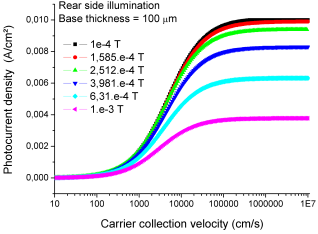
i) For a cell with a 100μm base thickness:
Figure 6 shows the variation of the photogenerated current density in a 100μm-thick photovoltaic cell illuminated from the rear side, as a function of the carrier collection velocity at the p-n junction and for different magnetic field intensities.
Figure 6. Photocurrent density of a 100μm PV cell under rear illumination as a function of carrier collection velocity for different magnetic field values.
The behavior can be divided into three distinct phases taking into account the shapes of the curves represented in
Figure 6.
Regardless of the operating regime, the magnetic field consistently reduces the photogenerated current density. In Phase 1, where the photocurrent density remains very low and approaches zero, the system is in an open-circuit regime with minimal carrier collection. In Phase 2, as the photocurrent density increases sharply, transitioning toward a short-circuit regime, the growth is more significant in the absence of a magnetic field. The magnetic field slightly slows this increase by reducing carrier mobility. Finally, in Phase 3, where the current density reaches saturation, the maximum photocurrent is observed; however, as the magnetic field intensity increases, this plateau decreases, reflecting the negative impact of magnetic deflection on carrier transport. Thus, the magnetic field’s presence results in a reduction of the photocurrent density across all regimes.
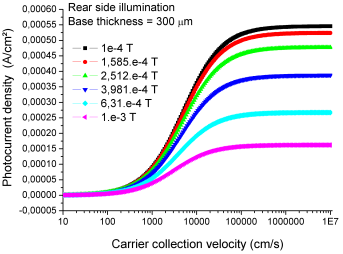
ii) For a solar cell with a base thickness of 300μm
Figure 7 depicts the behavior of a thicker PV cell (300μm), also rear-illuminated, under similar variations in carrier collection velocity and magnetic field.
Figure 7. Photocurrent density of a 300μm PV cell under rear illumination as a function of carrier collection velocity for different magnetic field values.
Figure 7 shows the same analysis for a 300μm thick solar cell under rear-side illumination and varying magnetic field intensities.
Although the general behavior mirrors that of the 100μm cell, the maximum photocurrent density is approximately ten times lower, due to increased recombination losses in the thicker base. Furthermore, the magnetic field continues to negatively affect the current, although the impact is slightly less severe than in the thinner cell.
Overall, cells with thinner bases (100μm) generate higher photocurrent densities (between 3e-3 and 1e-2 A/cm²) compared to 300μm cells (between 1.5×e-5 and 5.5e-5 A/cm²) under identical rear-illumination and magnetic field conditions.
3.3. Influence of Carrier Collection Velocity on the Photocurrent Density of a Bifacially Illuminated Solar Cell Under Various Magnetic Field Strengths
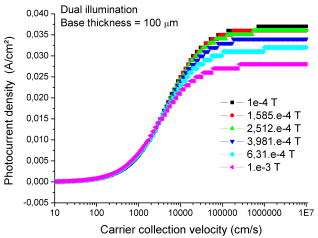
i) Case of a 100μm Thick Solar Cell
Figure 8 shows the variation of the photocurrent density generated in a 100μm thick photovoltaic cell illuminated simultaneously on both the front and rear sides, as a function of the carrier collection velocity at the p-n junction, under different magnetic field intensities.
Figure 8. Photocurrent density of a 100μm PV cell under dual illumination as a function of carrier collection velocity for different magnetic field values.
Regardless of the operating regime, the magnetic field consistently reduces the photogenerated current density. In the case of dual-face illumination, the contribution from rear-side illumination slightly increases the photocurrent density, complementing the contribution from the front side. However, the influence of the magnetic field on photocurrent density is more pronounced under rear illumination. This is due to the greater impact of the magnetic field on charge collection when the rear surface is illuminated, as the carriers generated at the rear of the cell have to travel a longer distance before reaching the junction. The magnetic field’s effect on carrier mobility and transport becomes more significant under these conditions, leading to a more noticeable reduction in the photocurrent density. Thus, while dual-side illumination enhances the overall photocurrent, the magnetic field exacerbates its detrimental effect, especially during rear-side illumination, where the field has a stronger influence on the collection efficiency.
ii) Case of a 300μm Thick Solar Cell
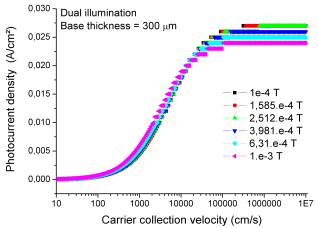
Figure 9 depicts the same analysis for a 300μm thick solar cell under bifacial illumination, with varying magnetic field intensities.
The photocurrent density remains very low and nearly constant for recombination velocities below 100cm/s, then increases exponentially between e2 and e⁵ cm/s, before plateauing for higher values. As before, the maximum photocurrent density reached is reduced by stronger magnetic fields.
Comparison of
Figures 8 and 9 reveals that the 100μm cell consistently achieves higher photocurrent densities than the 300μm cell in the saturation regime (1e5 - 1e7cm/s ). The photocurrent ranges from 25e-3 to 35e-3 A/cm² for the thinner cell, compared to 24e-3 to 28e-3 A/cm² for the thicker one.
The detrimental impact of magnetic field intensity on photocurrent generation, particularly under short-circuit conditions, has also been reported in prior studies
| [3] | K. Lee, J. Park, and H. Kim, “Magnetic field influence on carrier transport in PV cells,” Journal of Applied Physics, vol. 126, no. 12, 2019. |
| [4] | H. Kim, Y. Choi, and D. Lee, “Magnetic field-resilient photovoltaic structures,” Solar RRL, vol. 4, no. 3, 2020. |
| [9] | Wang, T., Zhao, L., Qiu, Y., & Huang, J. (2016). Carrier collection efficiency in high-performance silicon solar cells. IEEE Journal of Photovoltaics, 6(3), 790-798. https://doi.org/10.1109/JPHOTOV.2016.2531043 |
| [10] | Wang, H. B., Bagnall, D. M., Lu, J. P., & Wang, J. B. (2000). Effect of magnetic field on photovoltaic characteristics. Solar Energy Materials & Solar Cells, 63(2), 161-167. https://doi.org/10.1016/S0927-0248(00)00021-0 |
| [11] | A. Kachare and A. D. Sah, “Effects of series and shunt resistance on the I-V characteristics of solar cells,” Solar Cells, vol. 8, no. 2, pp. 137-148, 1983. (Classical analysis of series resistance impact on PV cell performance.). |
| [12] | C. Cornaro, “Magnetic field effects in silicon solar cells: analysis and applications,” Journal of Applied Physics, vol. 95, no. 2, pp. 879-885, 2004. (In-depth discussion on magnetic-field-modified transport and associated resistive losses.). |
| [13] | A. Luque and S. Hegedus (Eds.), Handbook of Photovoltaic Science and Engineering, 2nd ed., Wiley, 2011, pp. 296-299 https://doi.org/10.1002/9780470974704 |
[3, 4, 9-13]
. These works attribute the performance degradation to enhanced carrier deflection and scattering, reduced collection efficiency, or magnetic-field-induced modifications in series and shunt resistances. Our simulations corroborate these mechanisms, especially for thin-base configurations that are more sensitive to Lorentz force effects. Comme cela a aussi été suggéré par Sze et Ng, l'influence du champ magnétique sur la mobilité des porteurs est bien observée dans nos résultats, où une réduction de la mobilité entraîne une diminution de la densité de photocourant, surtout dans les régimes de court-circuit.
Figure 9. Photocurrent density of a 300μm PV cell under dual illumination as a function of carrier collection velocity for different magnetic field values.
Figures 4 to 9 reveal a noticeable decrease in the measured photogenerated current density when the solar cell operates under short-circuit conditions, particularly in the presence of an external magnetic field. This apparent drop can be attributed to the increased influence of the internal series resistance, which becomes more significant under high current conditions. Indeed, several studies have shown that the series resistance acts as an ohmic barrier, reducing the cell's ability to efficiently extract current, especially when external disturbances such as a magnetic field alter the trajectory or mobility of charge carriers.
3.4. Influence of Magnetic Field on the Photocurrent Density of a Solar Cell with Varying Thicknesses
i) Front-Illuminated PV Cells
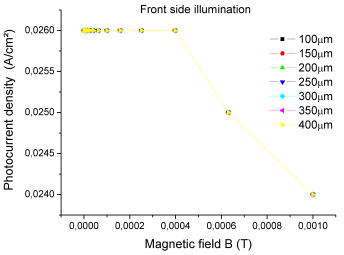
Figure 10 illustrates the variation of the photocurrent density in a photovoltaic (PV) cell illuminated from the front side, for base thicknesses ranging from 100μm to 400μm in 50μm increments, as a function of the magnetic field intensity (B).
Two distinct regimes can be observed:
For magnetic field values between 0 and 4e-4 T, the photocurrent density remains constant at approximately 25e-3 A/cm², regardless of the cell thickness.
Beyond 4e-4 T, a linear decrease is observed, with the density dropping gradually to 24e-3 A/cm² as B reaches 1e-3 T.
Taking into account the curves in
Figures 2 and 3, which show that the magnetic field begins to influence the diffusion coefficient and diffusion length, it is normal to observe that the field does not affect the photocurrent density in the range of values between 0 and 1E-4 T. However, beyond this value, the detrimental effect of the magnetic field becomes evident, as the photocurrent density continuously decreases as the field strength increases. The overlap of the curves as a function of base thickness simply shows that the collection at the front surface occurs in a smaller region than the chosen base thicknesses.
Figure 10. Photocurrent density as a function of magnetic field for a PV cell with different base thicknesses under front-side illumination.
ii) Rear-Illuminated PV Cells
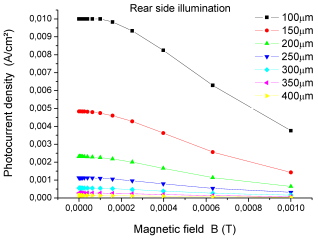
Figure 11 shows the evolution of the photocurrent density for the same range of cell thicknesses (100 - 400μm), this time under rear-side illumination, as a function of the magnetic field.
Figure 11. Photocurrent density as a function of magnetic field for a PV cell with different base thicknesses under rear-side illumination.
The following trends are observed:
1) The photocurrent density decreases as the base thickness increases.
2) For B ≤ 1e-4 T, the density remains unchanged.
3) When B > 1e-4 T, a linear drop in photocurrent is noted, with a more pronounced effect in thinner cells (100 - 150μm), highlighting their greater sensitivity to magnetic perturbation.
In summary:
Front-illuminated cells maintain a higher and nearly constant photocurrent density (~0.025 A/cm²), regardless of base thickness.
1) In contrast, rear-illuminated cells exhibit lower photocurrent density, which is inversely proportional to the base thickness.
2) Here, even low magnetic field values cause a decrease in photocurrent density, which can be explained by the increase in bulk recombination due to the presence of the magnetic field B.
iii) PV cells illuminated on both sides
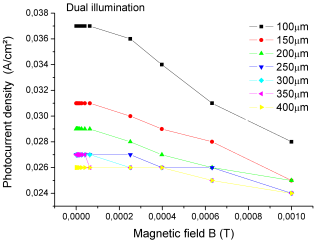
Figure 12 presents the variation of the photocurrent density in a PV cell subjected to bifacial illumination (both front and rear sides) for base thicknesses ranging from 100 to 400μm, as a function of magnetic field intensity.
Figure 12. Photocurrent density as a function of magnetic field for a PV cell with different base thicknesses under dual-side illumination.
The analysis reveals the following behavior:
1) In the absence of magnetic field, the photocurrent density decreases as the cell thickness increases.
2) For B ≤ 5e-5 T, no significant variation is observed.
3) When B exceeds 5e-5 T, the photocurrent density drops sharply and linearly in thinner cells (100 - 200μm).
4) In contrast, for thicker cells (250 - 400μm), the photocurrent remains almost constant up to 2.5e-4 T, after which a moderate decline sets in.
The
results
in
Figures 10 to 12 reveal
a
marked
dependence
of
photocurrent
density
on
base
thickness
under
rear-side
illumination.
As
shown
by
Green
| [2] | M. A. Green, Silicon Solar Cells: Advanced Principles & Practice, Centre for Photovoltaic Devices and Systems, UNSW, 1995. |
[2]
and
Aberle
,
minority
carrier
diffusion
lengths
and
recombination
rates
are
critically
dependent
on
the
bulk
properties
and
geometry
of
the
base.
Our
findings
align
with
these
theoretical
insights
and
reinforce
the
importance
of
optimizing
base
thickness
for
efficient
rear-side
carrier
collection.
Furthermore,
Cuevas
highlights
how
recombination
losses
in
thicker
bases
significantly
affect
bifacial
cell
efficiency,
consistent
with
the
observed
drop
in
photocurrent
for
base
thicknesses
above
300
μm.
3.5. Influence of Carrier Collection Velocity on the Photocurrent Density of a Solar Cell with Varying Thicknesses Under Magnetic Fields
i) Front-illuminated Cells
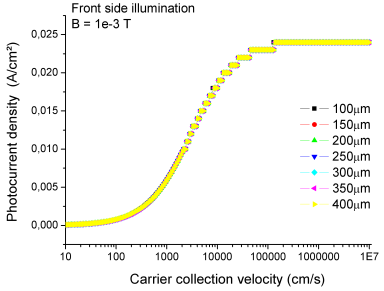
Figure 13 illustrates the variation of the photocurrent density in PV cells with different base thicknesses (ranging from 100μm to 400μm in 50μm steps), front-illuminated and subjected to a constant magnetic field of B = 1e-3 T.
Figure 13. Photocurrent density as a function of carrier collection velocity for PV cells of varying base thickness under front illumination and a constant magnetic field.
From the analysis of
Figure 13, it is evident that all front-illuminated PV cells, regardless of their thickness, exhibit a similar behavior with respect to recombination velocity:
1) For low recombination velocities (below 100cm/s ), the photocurrent density remains zero, corresponding to an open-circuit condition.
2) In the intermediate range (1e2 to 1e5cm/s ), the photocurrent density increases exponentially as the collection of carriers improves.
3) Beyond 1e5cm/s, the photocurrent density saturates, indicating a short-circuit regime where carrier extraction becomes optimal and no longer sensitive to increased recombination velocity.
ii) Rear-illuminated Cells
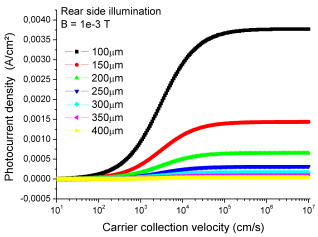
Figure 14 presents the photocurrent density variation in rear-illuminated PV cells of the same range of thicknesses under the same constant magnetic field (B = 1e-3 T).
Figure 14. Photocurrent density as a function of carrier collection velocity for PV cells of varying base thickness under rear illumination and a constant magnetic field.
The following observations emerge:
1) For all thicknesses, no variation in photocurrent density is observed in the 10 to 100cm/s carrier collection velocity range (open-circuit regime).
2) PV cells with thin bases (≤ 200μm) exhibit a rapid increase in photocurrent density in the 100 to 1e5cm/s interval, followed by saturation beyond that.
3) Medium-thickness cells (250 - 300μm) show a slight increase on the second plateau, with stable photocurrent in the third.
4) For thicker cells (350 - 400μm), the photocurrent density remains negligible or zero across the entire carrier collection velocity range.
In summary:
1) Front-illuminated cells, regardless of base thickness, show similar photocurrent density evolution, ranging from 0 to 25e-3 A/cm².
2) Rear-illuminated cells present a broader variation (0 to 35e-3 A/cm²), depending on base thickness and recombination velocity, with thinner cells outperforming thicker ones.
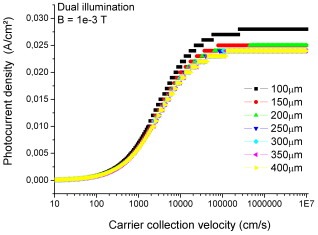
iii) PV cells illuminated on both sides
Figure 15 displays the photocurrent density in PV cells of various base thicknesses (100 to 400μm), bifacially illuminated (front and rear) as a function of the carrier collection velocity at the p-n junction, under a constant magnetic field.
The analysis shows the following:
1) For recombination velocities between 10 and 100cm/s, the cells operate in open-circuit mode and the photocurrent density remains zero.
2) In the transition range (100 to 1e5cm/s ), the photocurrent density rises sharply, indicating improved carrier collection.
3) For high recombination velocities (1e5 to 1e7cm/s ), the photocurrent density stabilizes for all cell thicknesses.
4) However, thinner cells exhibit higher saturated values than thicker ones, confirming their enhanced sensitivity to recombination dynamics under bifacial illumination.
Figure 15. Photocurrent density as a function of carrier collection velocity for bifacially illuminated PV cells of varying thicknesses under a constant magnetic field.
The analysis of
Figures 13 to 15 reveals that, under front-side illumination, the photogenerated current density remains largely independent of the base thickness. This stability can be explained by the fact that photogenerated carriers near the p-n junction, within the region influenced by the electric field of the space-charge region, are quickly collected, thereby minimizing the impact of long-range diffusion mechanisms. This behavior is well documented in the literature, particularly in the works of Aberle
| [7] | D. K. Schroder, Semiconductor Material and Device Characterization, 3rd ed., Wiley, 2006. |
[7]
, Cuevas et al.
and Green
| [15] | M. A. Green, Solar Cells: Operating Principles, Technology and System Applications, Prentice-Hall, 1982. |
[15]
, which show that the majority of useful carrier generation occurs near the junction in standard front-illuminated configurations.
Conversely, when illumination is applied to the rear side, photogenerated carriers must traverse the entire base to reach the junction. A thicker base increases the likelihood of recombination before collection, thereby reducing these carriers’ contribution to the total current. This phenomenon is confirmed by the analyses of Basore
| [16] | P. A. Basore, “Extended spectral analysis of internal quantum efficiency: Novel approach to measuring base diffusion length,” in Proc. 23rd IEEE Photovoltaic Specialists Conference (PVSC), 1993, pp. 147-152. |
[16]
and Yin et al.
| [17] | Yin, G., Li, S., & Zhang, D. (2011). Numerical modeling of grain boundaries in multicrystalline silicon solar cells. IEEE Transactions on Electron Devices, 58(5), 1321-1327. https://doi.org/10.1109/TED.2011.2113023 |
[17]
, who highlight the reduction of rear-side external quantum efficiency when the diffusion length is insufficient compared to the base thickness. These results are consistent with previous modeling of high-efficiency silicon solar cells, where the role of bulk recombination and base geometry has been extensively studied
| [18] | Cuevas, A., Samundsett, C., & Macdonald, D. (2003). Characterization and modeling of high-efficiency silicon solar cells. Progress in Photovoltaics: Research and Applications, 11(7), 419-430. https://doi.org/10.1002/pip.508 |
[18]
.
Thus, the thinner the base, the more beneficial rear-side illumination becomes in terms of contributing to the generated current. This behavior is also observed under bifacial illumination: while the front side provides a steady contribution, the share of current attributed to the rear side becomes more significant as the base becomes thinner. Base thickness therefore emerges as a critical parameter in optimizing bifacial solar cells, as also suggested by advanced numerical simulations by Liu et al.
.
3.6. Influence of Base Thickness on the Photocurrent Density of a Rear-illuminated PV Solar Cell
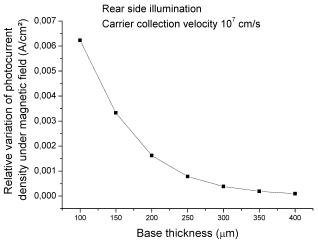
Figure 16 presents the evolution of the photogenerated current density in a photovoltaic (PV) solar cell illuminated from the rear side, as a function of base thickness under the effect of a magnetic field.
Figure 16. Photocurrent density as a function of base thickness in a rear-illuminated PV cell.
The analysis highlights the pronounced effect of the magnetic field on silicon solar cells with thin bases compared to those with thicker ones. For base thicknesses below 200μm, the photogenerated current density can reach up to 6.2 mA/cm². However, as the base thickness increases toward 400μm, the current density declines sharply and tends toward zero. This behavior suggests that thin-base cells are more sensitive to magnetic perturbations, likely due to shorter carrier transit times and reduced recombination losses. In contrast, thicker bases result in longer diffusion paths, increasing the likelihood of bulk recombination before collection. As such, base thickness emerges as a critical factor in modulating the influence of an external magnetic field on photocurrent generation in c-Si solar cells.
Similar
trends
have
been
reported
by
Wang
et
al.
,
who
observed
a
decrease
in
short-circuit
current
under
magnetic
fields
due
to
enhanced
carrier
deflection.
Cornaro
| [12] | C. Cornaro, “Magnetic field effects in silicon solar cells: analysis and applications,” Journal of Applied Physics, vol. 95, no. 2, pp. 879-885, 2004. (In-depth discussion on magnetic-field-modified transport and associated resistive losses.). |
[12]
and
Yin
et
al.
| [17] | Yin, G., Li, S., & Zhang, D. (2011). Numerical modeling of grain boundaries in multicrystalline silicon solar cells. IEEE Transactions on Electron Devices, 58(5), 1321-1327. https://doi.org/10.1109/TED.2011.2113023 |
[17]
also
emphasized
the
importance
of
device
geometry,
particularly
base
thickness
and
grain
structure,
in
determining
sensitivity
to
external
fields.