Review Article | | Peer-Reviewed

The Effect of Land Cover Change on Soil Erosion in Awach Kibuon Sub-basin, Kenya

Received: 3 July 2024     Accepted: 30 July 2024     Published: 15 August 2024
Views:       Downloads:
Abstract

Land cover change is a significant driver of soil erosion. While soil erosion is a natural process, human activities can significantly alter the landscape, making soil more vulnerable to erosion. This erosion reduces a watershed's capacity to sustain vital natural resources and ecosystem services. This study investigated the impact of these changes on soil erosion within four hydrological units (Awach Kibuon, Awach Owade, Awach Kasipul, and Awach Kabondo) of the Awach Kibuon sub-basin between 2018 and 2023. The specific objective of the study was to quantify the effect of land cover change on soil erosion rate and determine how specific land cover types affect soil erosion in the study area. This study employed a quasi-longitudinal design to assess the influence of land cover changes on soil erosion. Sentinel-2 NDVI satellite imagery provided land cover data. The land cover maps, soil data, rainfall data and the Digital Elevation Model were used in the Revised Universal Soil Loss Equation Model within a GIS environment to estimate soil erosion rates. The study revealed a consistent decline in vegetation cover across all hydrological units, as indicated by a decrease in NDVI. The mean NDVI decreased by 12.88%, 10.92%, 4.78%, and 11.92% in Awach Kibuon, Awach Owade, Awach Kasipul and Awach Kabondo respectively. Conversely, the mean soil erosion rate increased by 23.9% in Awach Kibuon, 17.85% in Awach Owade, 24.43% in Awach Kasipul, and 20.54% in Awach Kabondo. Sediment yield increased by 33% in Awach Kibuon, 18% in Awach Owade, 17% in Awach Kasipul, and 23% in Awach Kabondo. These findings suggest a direct relationship between reduced vegetation and elevated soil erosion. The relationship between land cover and erosion varies depending on the density of vegetation. Areas with dense vegetation cover have an inverse relationship, highlighting the protective role of vegetation cover. However, the study also observed that very dense vegetation areas which were also found in high-sloped areas experienced high soil erosion rates. The erosion rate increases even in areas that have experienced an increase in vegetation cover. This is because these areas are also found in high-sloped areas. The slope factor superseded the ability of vegetation cover to protect against soil loss. In conclusion, the change in land cover has significantly increased soil erosion in the Awach Kibuon Sub-basin, however, the slope factor also accelerated soil loss in the basin. Therefore, a holistic approach that combines promoting vegetation cover with land management techniques like terracing and drainage channels is crucial for mitigating soil degradation and water sedimentation in sub-basin.

Published in International Journal of Natural Resource Ecology and Management (Volume 9, Issue 3)
DOI 10.11648/j.ijnrem.20240903.12
Page(s) 82-96
Creative Commons

This is an Open Access article, distributed under the terms of the Creative Commons Attribution 4.0 International License (http://creativecommons.org/licenses/by/4.0/), which permits unrestricted use, distribution and reproduction in any medium or format, provided the original work is properly cited.

Copyright

Copyright © The Author(s), 2024. Published by Science Publishing Group

Keywords

Rusle Model, Land Cover, Soil Erosion Rate, Sediment Yield, Awach Kibuon Sub-Basin

1. Introduction
Land cover change is an indication of human influence on natural landscapes . Human activities such as overgrazing, deforestation, agriculture, mining, and settlement have significantly accelerated land cover change . While there are social and economic benefits associated with land cover change, it also has significant impacts on the natural environment, human livelihood, and sustainability . Global studies have shown that there has been a rapid decline in natural ecosystems. Lambin et al. and Newbold et al. demonstrated that agriculture has encroached upon forests, savannas, and grasslands across the globe to satisfy the need for food and fiber. According to Foley et al. , there was an approximate 3% increase in the world's croplands and pastures between 1985 and 2005. FAO estimated that the global forest had declined by approximately 129 million hectares between 1990 and 2015. A recent study by Winkler et al. and Potapov et al. estimated that the global land cover change is four times greater than it was last estimated.
One of the major consequences of land cover change is increased soil erosion . The presence of vegetation controls soil erosion through, its canopy, roots, and litter via rainfall interception, splash reduction, and rill erosion . The removal of natural vegetation through, deforestation, overgrazing, and extensive crop cultivation has increased the vulnerability of soil to erosion . This can have a significant impact on food security due to a decline in soil fertility affecting productivity and a reduction in water quality and quantity caused by high sedimentation in water resources . Soil erosion is considered one of the most serious environmental hazards throughout the world . Borelli et al. ascertained that soil erosion restricts economic development due to its impact on soil fertility. According to Blake et al. the on-site impact of soil erosion multiplies the physical and sociocultural problems of rural communities.
It has been estimated that approximately 2.5 to 4 billion tons of soil are eroded annually worldwide, and landscape characteristics account for about 65% to 74% of changes in sediment yield and soil erosion . According to Ouyang et al. , land use change has a greater impact on soil erosion than the soil's inherent characteristics. Studies have predicted that future soil erosion rates will depend on the increase or decrease in land use . Zhang et al. have revealed that different conversion scenarios, such as converting farmland to forest or grassland to farmland, can result in varying sediment yield values. Borelli et al. have suggested that a global reduction in agricultural land in favour of forest and semi-natural areas could reduce soil erosion from 54% to 48% by 2070.
Soil erosion is a major concern worldwide, with Africa facing a severe risk as a result of unsustainable land management practices and the lack of proper policies . According to Blake et al. , and Fenta et al. soil erosion is a pressing social, economic, and environmental issue in many African countries since about 83% of sub-Saharan African countries depend on land for their livelihood and food production. Soil erosion in Africa is driven by factors such as high soil erodibility, deforestation, desertification, poor soil conservation methods, and intensive agriculture . Addressing soil erosion in African countries is important as it will also address various economic, social, and environmental challenges.
Soil erosion assessment risk in Kenya revealed that 61.4% of the total area of Kenya was affected by high soil erosion and 27.2% was affected by very high soil erosion. This was attributed to biophysical conditions such as topography, erodible soils, and weather conditions. However, human activities pose a great threat to soil erosion due to unsustainable land management practices such as over-cultivation, overgrazing, and conversion of forest areas to other land use. Several studies conducted in Kenya have also found links between land cover change and soil erosion in different catchment areas. For example, studies by Humphrey et al. in the Lake Victoria basin, Moses in the River Nzoia basin, Boitt et al. in Kerio Valley, and Watene et al. in the Great Rift Valley demonstrated that change in land cover affects soil erosion at different spatial and temporal scales. Therefore, developing catchment-level models that can accurately predict soil loss from a watershed level based on its unique conditions such as land use and land cover changes can be extremely useful for land use planners, resource managers, policymakers and conservation practitioners, who are working to manage and mitigate impacts at the watershed level agriculture. The Sub Catchment Management Plan (SCMP) and the Homabay County Integrated Development Plan (CIDP) both identify deforestation, soil erosion, wetland and river bank degradation, land fragmentation, sedimentation, and flooding as the primary environmental challenges in the sub-basin. Rapid population and general poverty have led to inefficient and unsustainable economic activities, such as inappropriate farming practices and encroachment of agricultural lands into fragile natural habitats, particularly in buffer zones along river courses, hill slopes, woodlands, forest reserves, and wetlands. Multiple yearly cropping has also contributed to the problem. According to Misigo & Suzuki , the sediment load in the sub-basin is the highest in comparison to other river basins in Nyanza Gulf, with a value of 1.06 t/ha.
Studies have not been done in the Awach Kibuon sub-basin to quantify the effect of land cover change on soil erosion. The existing conservation efforts by Water Resource Users Associations (WRUAs) lack crucial scientific guidance on erosion hot spots, hindering their effectiveness. Effective soil erosion control demands a deeper understanding of its mechanisms, predicted erosion quantity and distribution, and potential mitigating strategies to inform conservation policies . This study addresses these gaps by quantifying the effect of land cover change on soil erosion in the Awach Kibuon sub-basin. This study aims to quantify the impact of land cover change on soil erosion within the Awach Kibuon sub-basin. Specifically, it addresses the following questions: How does land cover change affect the soil erosion rate? And how do different land cover types contribute to soil erosion? By determining the relationship between land cover and erosion, the study identifies high-risk erosion areas and quantifies the relative contribution of each land cover type to soil loss. These findings will inform the development of targeted conservation strategies to mitigate soil erosion in the sub-basin.
2. Materials and Methods
2.1. Study Area
The Awach Kibuon sub-basin is situated in western Kenya and falls under the Lake Victoria South Basin Area (LVSBA). The sub-basin covers an area of 634 km2. The altitude of the basin varies from 1200-2000m above sea level. The sub-basin is subdivided into four major basins namely Awach Kabondo, Awach Owade, Awach Kasipul, and Awach Kibuon. Figure 1 shows the map of the study area. Approximately 1400 mm of rainfall falls into the basin annually . The major river in the basin is River Awach Kibuon which is about 52km long and begins at the confluence of Awach Kabondo and Awach Kasipul, both having their origins in Nyamira highlands. It flows in the North-west direction and drains its water into Lake Victoria .
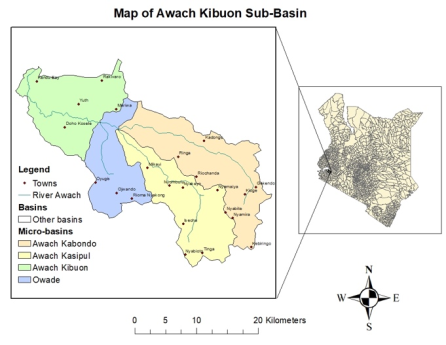
Figure 1. The map of Awach Kibuon Sub-basin.
2.2. Methodology
2.2.1. Land Cover Analysis
The creation of automated pipelines that enable the downloading of satellite datasets based on specific requirements such as dates, location, and processing, and the ability to perform operations such as generating Normalized Difference Vegetation Index (NDVI), has helped to overcome the limitations in satellite data processing . One of these pipelines is the System for Earth Observation Data Access, Processing and Analysis for Land and Monitoring (SEPAL) designed by the Food and Agriculture Organization (FAO). SEPAL platform allows users to access powerful cloud-computing resources to query, access and process satellite data quickly and efficiently for creating advanced analyses . In this study, high-resolution Sentinel-2 NDVI images were downloaded from SEPAL for the four hydrological units (HRUs) within the study area: Awach Kibuon, Awach Owade, Awach Kasipul, and Awach Kabondo, to analyse the land cover changes between 2018 and 2023. Established thresholds were used to classify NDVI values into six land cover categories as shown in Table 1 below. ArcMap 10.8 was then used to analyze the images and determine the area under each category. Microsoft Excel was used to calculate the area percentage change for each category from 2018 to 2023. The NDVI allowed for the delineation of vegetation distribution based on the characteristic reflectance patterns of green vegetation. NDVI of the four HRUs were generated following their difference in land cover categories in the study area. This yielded different vegetation cover categories depending on vegetation healthiness and extent. The advantage of using NDVI for land cover classification lies in its simplicity and ease of use by leveraging the distinct reflectance properties of vegetation compared to other land cover types .
Table 1. NDVI classification Scheme.

NDVI Range

Land Cover Category

Below 0

Water bodies

0 - 0.3

Non-photosynthetic

0.3 - 0.4

Moderately vegetated

0.4 - 0.6

Sparsely vegetated

0.7 – 0.6

Densely vegetated

Above 0.7

Very Densely vegetated

2.2.2. Soil Erosion Rate Analysis
This study employed the RUSLE model to estimate soil erosion rate. The model considers five key aspects: rainfall erosivity, soil erodibility, slope characteristics, land cover management, and conservation practices, allowing for targeted evaluation of erosion risk . The RUSLE model is popular in soil erosion estimation because it is straightforward, user-friendly, easy to incorporate erosion factors, and it is adaptable within GIS for spatially mapping soil loss . The model estimates gross soil erosion using Equation 1 below
A=R x K xLSx C x P(1)
Where A is the average annual soil loss per unit area (t/ha/year), R is the rainfall erosivity factor (MJ.mm.ha-1h-1yr-1), K is a soil erodibility factor (t/ha/MJ/mm), LS is a slope length and steepness factor (Dimensionless), C is a cover management factor (Dimensionless), and P is a support practice factor (Dimensionless).
Rainfall erosivity (R-factor)
R factor is an indicator of the capability of water to detach and transport soil particles. It is sensitive to the intensity and duration of the rainfall and is calculated based on the average precipitation of the area . In this study, 50 random points were selected from the study area. Daily rainfall (in mm) of each point from the year 2018 to 2023 was obtained from CHIRPS using Google Earth Engine. The mean annual precipitation (MAP) for each point was then calculated using Microsoft Excel. The ArcMap 10.8 was used to analyze the data by first editing the attribute table to include MAP. The Inverse Distance Weighting Method (IDWM) interpolation technique in the Spatial Analyst tool of ArcMap was then used to interpolate MAP for the whole study area. The raster calculator in the ArcMap was used to estimate the rainfall erosivity factor using Hurni method . The equation is expressed as;
R = -8.12 + (0.562×MAP)(2)
Where R is the Rainfall erosivity factor in MJ mm h ha-1 yr-1 and MAP is the mean annual precipitation in mm.
Soil erodibility (K-factor)
The K-factor plays a pivotal role in evaluating soil susceptibility to erosion from rainfall and runoff erosive forces, signifying the impact of soil properties on the process of soil loss . In this study, the soil data was acquired from Soil and Terrain Database for Kenya (KENSOTER) database raster maps. The sand, clay, silt and organic carbon content of each soil type was extracted and used to calculate the soil erodibility in excel. The Williams equation was used to determine the K factor. The equation is presented as;
K = fcsand× fcl−si× forgc× fhisand(3)
Where fcsand reflects lower soil erodibility for soils with higher proportions of coarse sand. Soils rich in coarse sand are typically less prone to erosion, hence receiving lower erodibility factors. fcl−si addresses the clay to silt ratio, this factor reduces soil erodibility for soils with higher clay to silt ratios. Forgc reflects a reduced soil erodibility, this factor pertains to soils with higher organic carbon content. Fhisand is specifically related to soils with extremely high sand contents, this factor diminishes soil erodibility .
fcsand =0.2+0.3×exp-0.256×Ms×1-Msilt100(4)
 fcl-si=MsiltMc+Msilt0.3(5)
forgC =0.0256×MoMo+exp[3.72-(2.95×Mo)](6)
fhisand =1-0.7×1-Ms1001-Ms100+exp-5.51+22.9×1-Ms100(7)
Where the K-factor, influenced by soil composition, encompasses various components such as sand (%), silt (%), clay (%), and organic matter (%). The values of the K-factor typically fall within the range of 0 to 1. A higher K-factor value indicates an increased susceptibility to erosion caused by water .
Slope length and steepness (LS factor)
The LS factor, a key component of the Revised Universal Soil Loss Equation (RUSLE), quantifies the influence of topography on soil erosion processes . It integrates the impacts of slope length (L) and steepness (S), reflecting the combined effect of gravity on surface runoff dynamics . On longer and steeper slopes, runoff accumulates and accelerates, intensifying flow velocity . This, in turn, increases shear stress on soil particles, leading to greater detachment and transport by erosive forces . GIS and remote sensing techniques, particularly Digital Elevation Models (DEMs), provide efficient tools for calculating the LS factor at various scales . The LS factor for this study was determined using 12.5m DEM for the area of interest downloaded from ALOS PALSAR available for free at http://search.asf.alaska.edu. The Hydrology tool in ArcGIS was then used to generate slope and flow accumulation. The flow accumulation was generated by first undertaking DEM fill sink, then flow direction, and lastly flow accumulation. The LS factor was then calculated using Stone and Hilborn method as presented in the equation is presented as follows:
LS=(slope lenght/22.13),NM×(0.065+0.045×slope+0.0065*slope×slope)(8)
Where slope length (m) is Flow accumulation × DEM cell resolution, the slope is in degrees, and NM is the value dependent on an average slope. NM is 0.2 if slope <1, 0.3 if 1 ≤ slope < 3, 0.4 if 3 ≤ slope < 5, and 0.5 if slope ≥ 5
Cover Management Practice (C-Factor)
Among the factors in the RUSLE model, the C-factor stands out for its dynamism. While soil characteristics, rainfall, and even slope can remain relatively stable over long periods, land cover and management practices, captured by the C-factor, are subject to constant change due to human activities . This dynamism makes the C-factor crucial in assessing soil erosion risk and evaluating the effectiveness of conservation efforts. This approach leverages the strong correlation observed between the Normalized Difference Vegetation Index (NDVI) and the C-factor . NDVI, derived from remote sensing data, provides a readily available and objective measure of vegetation cover, making it a valuable tool for rapid and large-scale C-factor estimation . The C-factor in this study was derived from the Sentinel-2 NDVI data downloaded from the SEPAL platform. Using ArcMap, the attribute table of the images was used to derive the C-factor using Equation 9.
C= -NDVI+12(9)
Conservation practice (P-factor)
The support practice factor (P-factor) is crucial in defining how land management practices impact the runoff and erosion rates, encompassing methods like contouring, strip-cropping, terraces, and contour furrows . However, due to challenges in directly observing or quantifying the effects of support practices, numerous studies have encountered difficulties in accurately determining this factor. Consequently, many studies opt not to consider the P-factor . Additionally, according to Fente et al. , the distribution of conservation practices is scant and their effectiveness often quickly declines over time in various parts of East Africa. Therefore, this study did not take into consideration the P-factor.
2.2.3. Sediment Yield Analysis
Sediment yield is not usually available as a direct measure but can be estimated as a statistical product of SDR and mean soil erosion (35). Sediment yield is estimated as;
Sy = SE × SDR(10)
Where Sy is sediment yield in t/h/yr, SE is the average annual soil erosion in t/h/yr, and SDR is the sediment delivery ratio.
SDR reflects the storage capacity of eroded soil or sediment within a basin (33). The basin area methods are the most commonly used methods to determine the SDR (21). For this study, the estimation of SDR adopted the Boyce (1975) method expressed as in equation 11 below
SDR=0.41A0.3(11)
Where; A is the basin area in square kilometers.
3. Results
3.1. Land Cover Trend in Awach Kibuon Sub-Basin
The general mean NDVI declined from 0.598 to 0.5211 in Awach Kibuon, 0.641 to 0.571 in Awach Owade, 0.669 to 0.637 in Awach Kasipul and 0.663 to 0.584 in Awach Kabondo from 2018 to 2023. Awach Kibuon recorded the highest reduction in land cover at 12.88% while Awach Kasipul recorded the least reduction by 4.78%.
Figure 2 shows the percentage area under each land cover class. The study revealed increased non-vegetated, sparsely vegetated, and moderately vegetated areas across all the
HRUs. Conversely, densely vegetated areas declined in all 4 HRUs from 2018 to 2023. Very densely vegetated areas increased in Awach Kibuon and Kasipul and decreased in Awach Owade and Awach Kabondo. Generally the study showed a significant decline in densely and very densely vegetated areas and a significant increase in moderately vegetated areas. This demonstrates expansion of agricultural lands at the expenses of natural forest and shrub lands and grasslands. Figure 4 shows the spatial distribution of land cover classes in the sub-basin.
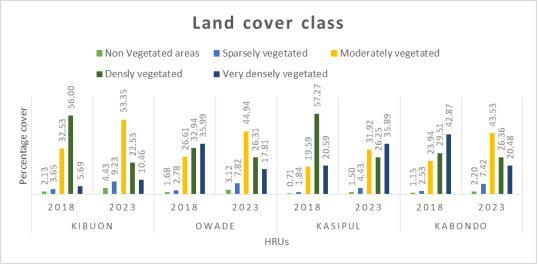
Figure 2. Percentage area per land cover class.
Table 2. Percentage land cover change.

NDVI Class

NDVI Range

HRUs

Kibuon

Owade

Kasipul

Kabondo

Non Vegetated areas

0-0.3

2.24

1.44

0.79

1.06

Sparsely vegetated

0.3-0.4

5.44

5.03

2.59

4.89

Moderately vegetated

0.4-0.6

20.38

18.34

12.33

19.59

Densely vegetated

0.6-0.7

-32.53

-6.63

-31.02

-3.15

Very densely vegetated

Above 0.7

4.67

-18.17

15.30

-22.40

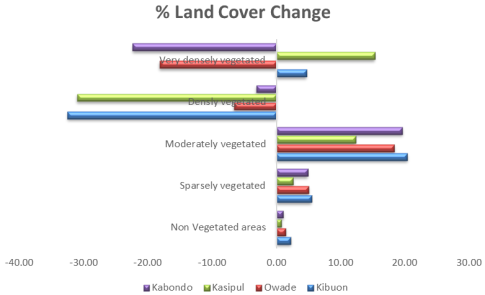
Figure 3. Graphical presentation of % land cover change.
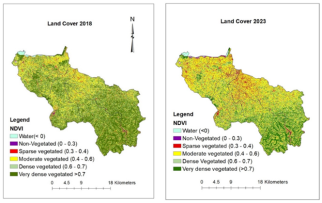
Figure 4. Spatial distribution of land cover types in 2018 and in 2023.
3.2. RULSE Factors
The mean R-factor of the sub-basin ranged from 825.65 – 1189.73 MJ mm ha/h/yr. The R-factor increased with an increase in MAP. The mean K-Factor of the sub-basin ranges from 0.107 to 0.122 ton ha-1 MJ/mm. The low K-factor values were majorly attributed to the soil type and soil texture in the sub-basin. The dominant soil types in the Awach Kibuon sub-basin are the Luvic Phaeozems and Humic Nitisols. Both the soil types are characterized by significant accumulation of clay . The soil texture classification indicated that over 90% of the land had clay soil texture. Clay soils have high water retention capacity, reducing the susceptibility to erosion . The mean LS factor of Awach Kibuon. Owade, Kasipul and Kabondo were determined to be 0.56, 0.87, 1.09 and 0.87 respectively. The mean C-factor in 2018 was determined to be 0.200, 0.178, 0.150, and 0.168 in Awach Kibuon, Owade, Kasipul, and Kabondo respectively. These values increased in 2023 to 0.239, 0.214, 0.181, and 0.207 respectively. Low C-factor was associated with densely and very densely vegetated areas. Figure 5 shows the spatial distribution of RUSLE factors.
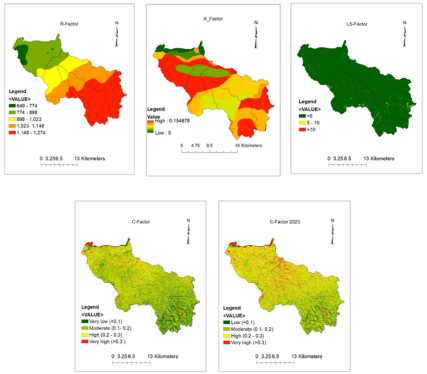
Figure 5. Spatial distribution of RUSLE factors.
3.3. Soil Erosion Rate
The study revealed an increase in soil erosion rates between 2018 and 2023 across all four HRUs as shown in Table 3.
Table 3. Mean soil erosion rate t/ha/yr per HRU.

HRU

2018

2023

% change in soil erosion rate

Kibuon

9.54

11.82

23.9%

Owade

15.41

18.16

17.85%

Kasipul

20.5

25.52

24.43%

Kabondo

19.43

23.42

20.54%

Areas experiencing very low and low soil erosion rates decreased while areas experiencing moderate, high and very high erosion rates increased Table 4.
Table 4. Percentage area under each soil erosion risk class.

HRU

Kibuon

Owade

Kasipul

Kabondo

Year

2018

2023

2018

2023

2018

2023

2018

2023

very Low

38.5

30.2

21.2

14.4

12.0

8.5

19.3

12.8

low

26.8

25.7

27.9

25.2

19.1

15.3

26.6

22.8

moderate

22.9

27.0

28.4

31.6

29.9

27.6

24.7

28.1

High

8.3

11.7

13.1

16.3

20.6

23.7

13.4

16.4

Very high

3.5

5.4

9.4

12.4

18.3

24.9

15.9

20.0

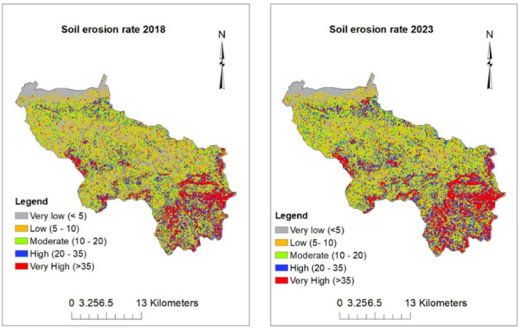
Figure 6. Spatial distribution of soil erosion risk.
Soil erosion hotspots were identified as areas experiencing extremely high soil loss rates exceeding 35 t/ ha/ yr. These critical areas include Rakwaro, Oyugis, Isecha, Nyabiota, Tinga, Nyamaiya, Kioge, Gekendo, Nyabite, Nyamira, and Kebiring.
3.4. Influence of Land Cover Type Change on Soil Erosion
Figure 7 shows the mean soil erosion in each land cover class.
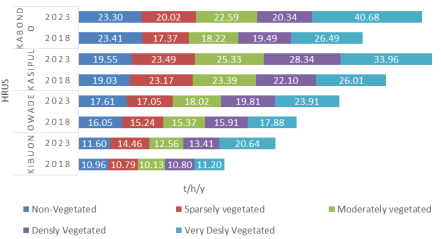
Figure 7. Mean soil erosion rate per land cover class.
Table 5. Percentage in Mean soil erosion from 2018 to 2023.

% change in mean soil erosion

Land cover class

Kibuon

Owade

Kasipul

Kabondo

Non-Vegetated

5.85

4.03

2.71

3.79

Sparsely vegetated

34.01

11.88

1.38

15.26

Moderately vegetated

23.99

17.24

8.29

23.98

Densely Vegetated

24.17

24.51

28.24

4.36

Very Densely Vegetated

84.29

33.72

30.57

53.57

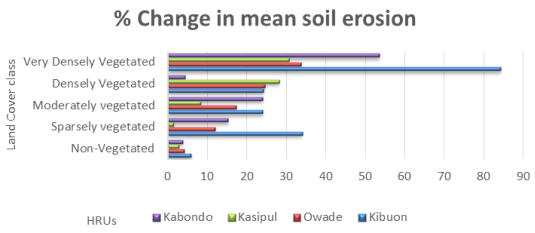
Figure 8. Graphical presentation of change in mean soil erosion from 2018 to 2023.
The study indicates that there was an increase in soil erosion rate from 2018 to 2023 in all the land cover classes across the four HRUs. Pearson correlation coefficient (r) and Correlation of determination (R2) analysis were done between change in mean soil erosion rate per land cover class and change in percentage land cover area for each land cover class. The results indicated that Non-vegetation exhibits the strongest correlation (r = 0.98, R² = 0.96), with nearly 96% of the variation in soil erosion explained by the lack of vegetation. This confirms existing knowledge that bare soil is highly susceptible to erosion because it lacks the protective cover and binding action of vegetation. Sparse vegetation (r = 0.83, R² = 0.69) and moderate vegetation (r = 0.97, R² = 0.94) also display a strong positive correlation. While there was an increased sparse and moderate vegetation in Awach Kibuon, these vegetation levels appear insufficient to control soil erosion. This is likely due to the dominance of agricultural lands and degraded grasslands that represented these land cover classes. The constant soil disturbance from tilling and grazing weakens the soil structure, increasing its susceptibility to erosion by runoff. Dense vegetation in Awach Kibuon exhibited a strong negative correlation (r = -0.68, R2 = 0.45) between vegetation density and soil erosion rate. This means denser vegetation cover significantly reduces soil erosion. These areas were dominated by tea plantations and shrublands, which effectively intercept rainfall and bind soil particles, minimizing erosion by runoff. This highlights the crucial role of dense vegetation in preventing soil loss. However, there was no significant correlation between the very densely vegetated areas and soil erosion (r = -0.02, R2 = 0). The study also noted that high soil erosion rates persisted in high-density areas. Even areas that experienced an increase in very dense vegetation such as Awach Kibuon and Awach Kasipul, still experience an increase in soil erosion. Very densely vegetated areas were in higher slopes; therefore, effect of steep slopes outweigh the protective effect of dense vegetation in these locations.
3.5. Sediment Yield Trends
The SDR value was determined to be 0.09, 0.1, 0.09, and 0.08 in Awach Kibuon, Owade, Kasipul and Kabondo. This implies that 8% to 10% of the total soil eroded is translated to the river in the sub-basin. A similar study conducted by Moses (21) in River Nzoia basin using the same method indicated an SDR value of 0.121.
In 2018, the sediment yield in Awach Kibuon, Owade, Kasipul, and Kabondo were 0.5, 0.91, 1.21, and 1.02 t/ha/yr. In 2023 the sediment yield increased to 0.63, 1.26, 1.43, and 1.52 t/ha/yr in Awach Kibuon, Owade, Kasipul, and Kabondo respectively. These findings were in range with the observed sediment load by Water Resource Authority (WRA) in 2014 in Awach Kibuon basin where the sediment load was estimated to 0.79 t/ha/yr. Similarly, Misigo & Suzuki (24) estimated the sediment load of the same basin to be 1.06 t/ha/yr. These findings validates the study’s RUSLE model output. The findings of the study were also in range with finding of a study conducted in Kenya conducted by Moses (21), who estimated the sediment yield of Nzoia basin to be 1.0696Mton/yr.
Sediment yield increased from 2018 to 2023 by 0.19%, 0.28%, 0.15%, and 0.33% in Awach Kibuon, Owade, Kasipul, and Kabondo. The data suggest an upward trend in sediment export, which is consistent with the upward trend in soil loss. The decline in general land cover has resulted into increase in soil erosion and sediment yield in the basin. The study indicated a moderate correlation (r > -0.6, R2 > 0.4) between land cover change and sediment yield. This implies that change in land cover and sediment yield has an inverse relationship. However, only 40% of the change in sediment yield from 2018 to 2023 is attributed by change in land cover. Other factors such as slope and rainfall could have played a significant role in the change in sediment yield.
4. Discussion
Awach Kibuon sub-basin is a rural agricultural area. The livelihoods of the Awach Kibuon community are anchored on mixed farming where the community practices crop production and livestock keeping. The entire catchment area, except for the floodplains near Lake Victoria, is used for cultivation. The natural forest has been almost completely cleared, and even steeper slopes are under agriculture. Fast-growing eucalyptus trees have been planted to replace the indigenous species. The analysis of land cover trends in the sub-basin reveals a shift towards less vegetated landscapes. This is evidenced by an increase in non-vegetated areas, likely due to the development of roads, settlements, and bare land. Sparsely vegetated areas are also increasing, suggesting an expansion of farmlands with minimal plant cover and unmanaged grasslands and shrublands. The increase in moderately vegetated areas indicates the conversion of land into agricultural fields, indicating the growth of arable land within the sub-basin.
Conversely, densely vegetated areas declined. These areas represent shrubland, bushlands, tea vegetation and dense grasslands. Awach Kibuon exhibited the highest decline in this land cover class (densely vegetated areas). This is due to deforestation and encroachment of natural shrubland to provide more land for agriculture. Similarly, very densely vegetated areas decreased in Awach Owade This land cover class represented areas under forest plantation and natural forested areas. The decline might have been attributed to timber harvesting from forest farms and deforestation from natural forests. However, in Awach Kibuon and Awach Kasipul, very densely vegetated areas increased. This increase is due to a rise in farm forestry within the sub-basins, driven by its potential as an alternative income source through timber and firewood sales. The land cover trend findings in the Awach Kibuon sub-basin are aligned with the findings of Watene et al. , Kogo et al. , and Moses in Kenya, which documented similar declines in forested and shrubland areas alongside agricultural land expansion.
Soil erosion rate increased from 2018 to 2023 in all the HRUs (Table 3). Awach Kabondo and Awach Kasipul stand out as priority areas for soil erosion conservation due to their alarmingly high soil erosion rates, exceeding 20t/ha/yr. More specifically conservation priority should be given to areas that lose soil at a rate greater than 35 t/ha/yr as shown in Figure 5. They include areas around Rakwaro, Oyugis, Isecha, Nyabiota, Tinga, Nyamaiya, Kioge, Gekendo, Nyabite, Nyamira, and Kebiring.
The mean soil erosion rate estimated for the study area is different from those of similar studies undertaken in Kenya. For example, the mean soil erosion of Sio, yala and Upper Nzoia were 12.3, 7.5, and 12.2 t/ha/yr respectively . According to Kanda et al. , the mean soil erosion in Elgeyo escarpment was 18t/ha/yr. Watene et al. estimated the mean soil erosion rate of the Kenya Great Rift Valley to be 7.14 t/ha/yr. This difference in means among the watersheds is due to variability in factors such as topography, rainfall, and land cover.
The increase in soil erosion rate is likely to be attributed to land cover changes. The main manipulation factor in this study was the C factor, and potential soil erosion prediction was conducted using both the C-factor values for 2018 and 2023. A strong negative correlation (Pearson correlation coefficient r = -0.9) exists between mean soil erosion and the C-factor. The coefficient of determination (R²) was also high, > 0.8. This indicates a strong relationship between land cover changes (reflected by C-factor) and increased soil erosion. The increase in soil erosion could be influenced by the increase in non-vegetated areas, sparsely vegetation areas and moderately vegetated areas. Also, decline in areas under densely vegetated and very densely vegetated areas. The consistent disturbance of land tillage combined with unsustainable agricultural practices might be the reason for increasing soil erosion levels in these areas. Studies have shown that the soil erosion rate is exacerbated by land cover. Dense vegetation such as forests and shrub land act as shields against soil erosion . Plant roots bind soil particles together, while above-ground vegetation intercepts rainfall, reducing its impact on the soil surface . When these natural covers are removed to pave the way for agriculture and development, the soil becomes exposed and vulnerable to surface runoff, accelerating erosion .
Further analysis on the influence of each land cover class on soil erosion rate showed a positive correlation between non-vegetated areas, sparsely vegetated areas and moderately vegetated areas and soil erosion rate. This revealed that such vegetation cover was not effective at controlling soil erosion rate. Conversely, there was a negative correlation between densely vegetated areas and soil erosion rate. This indicated the importance of vegetation type on soil erosion control. The study also showed that high soil erosion rates persisted in high-density areas. Even areas that experienced an increase in very dense vegetation such as Awach Kibuon and Awach Kasipul, still experience an increase in soil erosion. This is likely due to the effect of slope because these areas were also found in steeper slopes. This indicated the effect of steep slopes in these areas outweighs the protective effect of the dense vegetation in these locations. Although vegetation undeniably plays a key role in soil erosion control, recent studies by Wu et al. emphasize the influence of other environmental factors such as slope that affect the effectiveness of vegetation cover in controlling soil erosion. Their research suggests that the erosion-mitigating power of vegetation weakens on steeper slopes, with the most significant reductions in runoff occurring between 20° and 30° slope, and sediment reduction between 10° and 25° and vegetation has no benefits in controlling soil erosion in slopes exceeding 30°. A study conducted in Kenya by Kogo et al. also found that the soil erosion rate increased with an increase in slope. It was observed that the high mean soil erosion rates experienced in Awack Kabondo and Awach Kasipul were mainly contributed by the slope factor. These areas also experienced high rainfall compared to the rest of the basin. The combination of slope and rainfall increased soil erosion in these areas. Therefore, special priority should be given to soil conservation in these areas to reduce the erosive capacity of water runoff and solve the soil loss problem and its impacts on water resources.
5. Conclusion
This study aimed to assess the influence of land cover change on soil erosion and sediment yield in the Awach Kibuon Sub-basin. The land cover in the Awach Kibuon Sub-basin was classified using high-resolution sentinel-2 NDVI images obtained from www.sepal.io. An empirical RUSLE model that determines soil loss by integrating different factors (R, K, LS, P, and C) was used to estimate the average annual soil loss. The C-factor was given importance to determine the change in soil loss from 2018 to 2023. The vegetation cover trend on the Awach Kibuon Sub-basin was marked by an increase in areas with no vegetation to moderately vegetated areas indicating increase in bare lands, settlement, and agricultural lands. Conversely, higher vegetation density areas such as shrub land and forested lands declined. The land cover change attributed to a decline in vegetation cover led to increased soil erosion rates in the sub-basin.
The study found that different types of land cover have varying effects on soil erosion. Non-vegetated, sparsely vegetated, and moderately vegetated areas have a direct relationship with soil erosion. In contrast, densely vegetated areas had an inverse relationship, indicating the role of vegetation cover in soil erosion control. In addition to land cover, slope also played an important role in accelerating soil erosion in sub-basins, especially in Awach Kasipul and Awach Kabondo. The study observed that high-sloped areas were experiencing higher soil loss despite higher vegetation cover.
There is a need for a holistic approach in managing soil loss. Land management strategies that increase vegetation cover, especially in vulnerable areas, are crucial for combating soil erosion and preventing water resource sedimentation. The study has demonstrated that densely vegetated land cover can significantly reduce soil erosion rate. Therefore, there is a need to promote vegetation cover through agroforestry, forest restoration efforts, and limiting the clearing of natural forests and shrub lands. Additionally, terraces should be constructed in highly sloped areas to help reduce water flow velocity and encourage infiltration. Gathangu et al. showed that implementing terraces, especially in agricultural lands, can decrease sediment yield by 80.7% at the catchment outlet. This, in turn, reduces the amount of sediment in reservoirs and water infrastructure. These findings emphasize the need for prioritizing land management practices that promote and maintain vegetation cover. Understanding the intricate relationship between land cover changes, erosion rates, and sediment yield is crucial for formulating targeted policies that support integrated watershed management. By implementing such strategies, conservation practitioners can work towards mitigating soil erosion and protecting the health of the Awach Kibuon Sub-basin. The output of this study will provide valuable information for the preparation and implementation of future SCMP of the Awach Kibuon Sub-basin.
The RUSLE model effectively simulates rill and inter-rill erosion processes but is limited in estimating gully erosion, highlighting the need for further research incorporating alternative modelling approaches to accurately predict soil loss and sediment yield within the watershed. This information is crucial for informed planning and management strategies. Additionally, due to the model's simplicity and limited input parameters, its outputs are likely highly sensitive to these inputs. A sensitivity analysis is therefore recommended to determine the most influential parameters, assess the impact of input uncertainty on model results, and guide targeted interventions.
Abbreviations

CIDP

County Integrated Development Plan

DEM

Digital Elevation Model

FAO

Food and Agricultural Organization

GIS

Geographical Information System

IDWM

Inverse Distance Weighing Method

KENSOTER

Soil and Terrain Database for Kenya

LVSBA

Lake Victoria South Basin Area

NDVI

Normalized Difference Vegetation Index

RUSLE

Revised Universal Soil Loss Equation

SCMP

Sub Catchment Management Plan

SEPAL

System for Earth Observation, Data Access, Processing and Analysis for Land Monitoring

WRA

Water Resources Authority

WRUA

Water Resource Users Association

Acknowledgments
I would like to acknowledge the support from my supervisors Dr. Dennis Masika and Dr. Albert Long’ora and the entire department of Environmental Sciences at Maseno University. Their moral support and contribution were extremely valuable.
Author Contributions
Olgah Hellens: Conceptualization, Formal Analysis, Investigation, Methodology, Funding acquisition, Writing – original draft, Writing – review & editing
Dennis Masika: Supervision
Albert Long’ora: Supervision
Funding
This work is supported by the Regional Centre for Mapping of Resources for Development- Global Monitoring for Environment and Africa (RCMRD-GMES & Africa)
Data Availability Statement
The data is available from the corresponding author upon reasonable request.
Conflicts of Interest
The authors declare no conflicts of interest.
References
[1] Leh M, Bajwa S, Chaubey I. Impact of land use change on erosion risk: an integrated remote sensing, geographic information system and modeling methodology. Land Degrad Dev 2013; 24: 409–21.
[2] Lambin EF, Meyfroidt P. Global land use change, economic globalization, and the looming land scarcity. Proceedings of the National Academy of Sciences 2011; 108: 3465–72.
[3] Newbold T, Boakes EH, Hill SLL, Harfoot MBJ, Collen B. The present and future effects of land use on ecological assemblages in tropical grasslands and savannas in Africa. Oikos 2017; 126: 1760–9.
[4] Foley JA, Ramankutty N, Brauman KA, Cassidy ES, Gerber JS, Johnston M, et al. Solutions for a cultivated planet. Nature 2011; 478: 337–42.
[5] FAO. Global Forest Resources Assessment 2015. How are the World’s Forests Changing?. vol. 1. 2nd ed. Rome: FAO; 2016.
[6] Winkler K, Fuchs R, Rounsevell M, Herold M. Global land use changes are four times greater than previously estimated. Nat Commun 2021; 12: 2501.
[7] Potapov P, Hansen MC, Kommareddy I, Kommareddy A, Turubanova S, Pickens A, et al. Landsat Analysis Ready Data for Global Land Cover and Land Cover Change Mapping. Remote Sens (Basel) 2020; 12: 426.
[8] Borrelli P, Robinson DA, Fleischer LR, Lugato E, Ballabio C, Alewell C, et al. An assessment of the global impact of 21st century land use change on soil erosion. Nat Commun 2017; 8: 2013.
[9] Wu L, Liu X, Ma X. Research progress on the watershed sediment delivery ratio. International Journal of Environmental Studies 2018; 75: 565–79.
[10] Zare M, Nazari Samani AA, Mohammady M, Salmani H, Bazrafshan J. Investigating effects of land use change scenarios on soil erosion using CLUE-s and RUSLE models. International Journal of Environmental Science and Technology 2017; 14: 1905–18.
[11] Degife A, Worku H, Gizaw S, Legesse A. Land use land cover dynamics, its drivers and environmental implications in Lake Hawassa Watershed of Ethiopia. Remote Sens Appl 2019; 14: 178–90.
[12] Ganasri BP, Ramesh H. Assessment of soil erosion by RUSLE model using remote sensing and GIS - A case study of Nethravathi Basin. Geoscience Frontiers 2016; 7: 953–61.
[13] Blake WH, Rabinovich A, Wynants M, Kelly C, Nasseri M, Ngondya I, et al. Soil erosion in East Africa: an interdisciplinary approach to realising pastoral land management change. Environmental Research Letters 2018; 13: 124014.
[14] Chuenchum P, Xu M, Tang W. Predicted trends of soil erosion and sediment yield from future land use and climate change scenarios in the Lancang–Mekong River by using the modified RUSLE model. International Soil and Water Conservation Research 2020; 8: 213–27.
[15] Ouyang W, Wu Y, Hao Z, Zhang Q, Bu Q, Gao X. Combined impacts of land use and soil property changes on soil erosion in a mollisol area under long-term agricultural development. Science of The Total Environment 2018; 613–614: 798–809.
[16] Zhang S, Li Y, Fan W, Yi Y. Impacts of Rainfall, Soil Type, and Land-Use Change on Soil Erosion in the Liusha River Watershed. J Hydrol Eng 2017; 22.
[17] Haregeweyn N, Tsunekawa A, Poesen J, Tsubo M, Meshesha DT, Fenta AA, et al. Comprehensive assessment of soil erosion risk for better land use planning in river basins: Case study of the Upper Blue Nile River. Science of The Total Environment 2017; 574: 95–108.
[18] Rhodes CJ. Soil Erosion, Climate Change and Global Food Security: Challenges and Strategies. Sci Prog 2014; 97: 97–153.
[19] Fenta AA, Tsunekawa A, Haregeweyn N, Poesen J, Tsubo M, Borrelli P, et al. Land susceptibility to water and wind erosion risks in the East Africa region. Science of The Total Environment 2020; 703: 135016.
[20] Humphrey OS, Osano O, Aura CM, Marriott AL, Dowell SM, Blake WH, et al. Evaluating spatio-temporal soil erosion dynamics in the Winam Gulf catchment, Kenya for enhanced decision making in the land-lake interface. Science of The Total Environment 2022; 815: 151975.
[21] Moses AN. GIS-RUSLE Interphase Modelling of Soil Erosion Hazard and Estimation of Sediment Yield for River Nzoia Basin in Kenya. Journal of Remote Sensing & GIS 2017; 06.
[22] Boitt MK, Albright OM, Kipkulei HK. Assessment of Soil Erosion and Climate Variability on Kerio Valley Basin, Kenya. Journal of Geoscience and Environment Protection 2020; 08: 97–114.
[23] Watene G, Yu L, Nie Y, Zhu J, Ngigi T, Nambajimana J de D, et al. Water Erosion Risk Assessment in the Kenya Great Rift Valley Region. Sustainability 2021; 13: 844.
[24] Misigo AWS, Suzuki S. Spatial-Temporal Sediment Hydrodynamics and Nutrient Loads in Nyanza Gulf, Characterizing Variation in Water Quality. World Journal of Engineering and Technology 2018; 06: 98–115.
[25] Jiang C, Zhang H, Zhang Z, Wang D. Model-based assessment soil loss by wind and water erosion in China’s Loess Plateau: Dynamic change, conservation effectiveness, and strategies for sustainable restoration. Glob Planet Change 2019; 172: 396–413.
[26] GoK. Sub-Catchment Management Plan (SCMP) 2012-2016. 2012.
[27] A.O. O, Njogu AK. Using Extreme Value Theory to Estimate Available Water in the Upper Awach-Kibuon Catchment in Nyamira County, Kenya. American Journal of Water Resources 2020; 8: 200–10.
[28] Huang S, Tang L, Hupy JP, Wang Y, Shao G. A commentary review on the use of normalized difference vegetation index (NDVI) in the era of popular remote sensing. J For Res (Harbin) 2021; 32: 1–6.
[29] Robinson N, Allred B, Jones M, Moreno A, Kimball J, Naugle D, et al. A Dynamic Landsat Derived Normalized Difference Vegetation Index (NDVI) Product for the Conterminous United States. Remote Sens (Basel) 2017; 9: 863.
[30] Pandit A, Sawant SA, Agrawal R, Mohite JD, Pappula S. DEVELOPMENT OF AUTOMATED SATELLITE DATA DOWNLOADING AND PROCESSING PIPELINE ON AWS CLOUD FOR NEAR-REAL-TIME AGRICULTURE APPLICATIONS. ISPRS Annals of the Photogrammetry, Remote Sensing and Spatial Information Sciences 2022; V-4–2022: 189–96.
[31] Mngube FM, Kapiyo R, Aboum P, Anyona D, Dida GO. Subtle Impacts of Temperature and Rainfall Patterns on Land Cover Change Overtime and Future Projections in the Mara River Basin, Kenya. Open Journal of Soil Science 2020; 10: 327–58.
[32] Renard KG, Ferreira VA. RUSLE Model Description and Database Sensitivity. J Environ Qual 1993; 22: 458–66.
[33] Boakye E, Anyemedu FOK, Donkor EA, Quaye-Ballard JA. Spatial distribution of soil erosion and sediment yield in the Pra River Basin. SN Appl Sci 2020; 2: 320.
[34] Degife A, Worku H, Gizaw S. Environmental implications of soil erosion and sediment yield in Lake Hawassa watershed, south-central Ethiopia. Environmental Systems Research 2021; 10: 28.
[35] Tsegaye L, Bharti R. Soil erosion and sediment yield assessment using RUSLE and GIS-based approach in Anjeb watershed, Northwest Ethiopia. SN Appl Sci 2021; 3: 582.
[36] Nearing MA, Yin S, Borrelli P, Polyakov VO. Rainfall erosivity: An historical review. Catena (Amst) 2017; 157: 357–62.
[37] Hurni H. An ecosystem approach to soil conservation. Soil erosion and conservation, vol. 2, 1985.
[38] Hategekimana Y, Allam M, Meng Q, Nie Y, Mohamed E. Quantification of Soil Losses along the Coastal Protected Areas in Kenya. Land (Basel) 2020; 9: 137.
[39] Kogo BK, Kumar L, Koech R. Impact of Land Use/Cover Changes on Soil Erosion in Western Kenya. Sustainability 2020; 12: 9740.
[40] Morgan RPC. A simple approach to soil loss prediction: a revised Morgan–Morgan–Finney model. Catena (Amst) 2001; 44: 305–22.
[41] Michalopoulou M, Depountis N, Nikolakopoulos K, Boumpoulis V. The Significance of Digital Elevation Models in the Calculation of LS Factor and Soil Erosion. Land (Basel) 2022; 11: 1592.
[42] Stone RP, Hilborn D. Universal Soil Loss Equation (USLE). Factsheet. 2012.
[43] Abdallah S, Njoroge T, Jaoko J. Assessment of land degradation by rusle model using remote sensing and gis: a case study of kenya’s lake victoria basin. International Journal of Agriculture, Environment and Bioresearch 2018; 3: 27–49.
[44] Aneseyee AB, Elias E, Soromessa T, Feyisa GL. Land use/land cover change effect on soil erosion and sediment delivery in the Winike watershed, Omo Gibe Basin, Ethiopia. Science of The Total Environment 2020; 728: 138776.
[45] Benavidez R, Jackson B, Maxwell D, Norton K. A review of the (Revised) Universal Soil Loss Equation ((R)USLE): with a view to increasing its global applicability and improving soil loss estimates. Hydrol Earth Syst Sci 2018; 22: 6059–86.
[46] Muchena FN, Gachene CKK. Soils of the Highland and Mountainous Areas of Kenya with Special Emphasis on Agricultural Soils. Mt Res Dev 1988; 8: 183.
[47] Kanda K, Sang C, Letema S. Influence of Land Use Land Cover Changes on Soil Erosion in Elgeyo Escarpment, Kenya. East Afri Agric For J 2022; 88: 75–87.
[48] Wu G, Liu Y, Cui Z, Liu Y, Shi Z, Yin R, et al. Trade-off between vegetation type, soil erosion control and surface water in global semi-arid regions: A meta-analysis. Journal of Applied Ecology 2020; 57: 875–85.
[49] Gathagu JN, Sang JK, Maina CW. Modelling the impacts of structural conservation measures on sediment and water yield in Thika-Chania catchment, Kenya. International Soil and Water Conservation Research 2018; 6: 165–74.
Cite This Article
  • APA Style

    Hellens, O., Masika, D., Long’ora, A. (2024). The Effect of Land Cover Change on Soil Erosion in Awach Kibuon Sub-basin, Kenya. International Journal of Natural Resource Ecology and Management, 9(3), 82-96. https://doi.org/10.11648/j.ijnrem.20240903.12

    Copy | Download

    ACS Style

    Hellens, O.; Masika, D.; Long’ora, A. The Effect of Land Cover Change on Soil Erosion in Awach Kibuon Sub-basin, Kenya. Int. J. Nat. Resour. Ecol. Manag. 2024, 9(3), 82-96. doi: 10.11648/j.ijnrem.20240903.12

    Copy | Download

    AMA Style

    Hellens O, Masika D, Long’ora A. The Effect of Land Cover Change on Soil Erosion in Awach Kibuon Sub-basin, Kenya. Int J Nat Resour Ecol Manag. 2024;9(3):82-96. doi: 10.11648/j.ijnrem.20240903.12

    Copy | Download

  • @article{10.11648/j.ijnrem.20240903.12,
      author = {Olgah Hellens and Dennis Masika and Albert Long’ora},
      title = {The Effect of Land Cover Change on Soil Erosion in Awach Kibuon Sub-basin, Kenya
    },
      journal = {International Journal of Natural Resource Ecology and Management},
      volume = {9},
      number = {3},
      pages = {82-96},
      doi = {10.11648/j.ijnrem.20240903.12},
      url = {https://doi.org/10.11648/j.ijnrem.20240903.12},
      eprint = {https://article.sciencepublishinggroup.com/pdf/10.11648.j.ijnrem.20240903.12},
      abstract = {Land cover change is a significant driver of soil erosion. While soil erosion is a natural process, human activities can significantly alter the landscape, making soil more vulnerable to erosion. This erosion reduces a watershed's capacity to sustain vital natural resources and ecosystem services. This study investigated the impact of these changes on soil erosion within four hydrological units (Awach Kibuon, Awach Owade, Awach Kasipul, and Awach Kabondo) of the Awach Kibuon sub-basin between 2018 and 2023. The specific objective of the study was to quantify the effect of land cover change on soil erosion rate and determine how specific land cover types affect soil erosion in the study area. This study employed a quasi-longitudinal design to assess the influence of land cover changes on soil erosion. Sentinel-2 NDVI satellite imagery provided land cover data. The land cover maps, soil data, rainfall data and the Digital Elevation Model were used in the Revised Universal Soil Loss Equation Model within a GIS environment to estimate soil erosion rates. The study revealed a consistent decline in vegetation cover across all hydrological units, as indicated by a decrease in NDVI. The mean NDVI decreased by 12.88%, 10.92%, 4.78%, and 11.92% in Awach Kibuon, Awach Owade, Awach Kasipul and Awach Kabondo respectively. Conversely, the mean soil erosion rate increased by 23.9% in Awach Kibuon, 17.85% in Awach Owade, 24.43% in Awach Kasipul, and 20.54% in Awach Kabondo. Sediment yield increased by 33% in Awach Kibuon, 18% in Awach Owade, 17% in Awach Kasipul, and 23% in Awach Kabondo. These findings suggest a direct relationship between reduced vegetation and elevated soil erosion. The relationship between land cover and erosion varies depending on the density of vegetation. Areas with dense vegetation cover have an inverse relationship, highlighting the protective role of vegetation cover. However, the study also observed that very dense vegetation areas which were also found in high-sloped areas experienced high soil erosion rates. The erosion rate increases even in areas that have experienced an increase in vegetation cover. This is because these areas are also found in high-sloped areas. The slope factor superseded the ability of vegetation cover to protect against soil loss. In conclusion, the change in land cover has significantly increased soil erosion in the Awach Kibuon Sub-basin, however, the slope factor also accelerated soil loss in the basin. Therefore, a holistic approach that combines promoting vegetation cover with land management techniques like terracing and drainage channels is crucial for mitigating soil degradation and water sedimentation in sub-basin.
    },
     year = {2024}
    }
    

    Copy | Download

  • TY  - JOUR
    T1  - The Effect of Land Cover Change on Soil Erosion in Awach Kibuon Sub-basin, Kenya
    
    AU  - Olgah Hellens
    AU  - Dennis Masika
    AU  - Albert Long’ora
    Y1  - 2024/08/15
    PY  - 2024
    N1  - https://doi.org/10.11648/j.ijnrem.20240903.12
    DO  - 10.11648/j.ijnrem.20240903.12
    T2  - International Journal of Natural Resource Ecology and Management
    JF  - International Journal of Natural Resource Ecology and Management
    JO  - International Journal of Natural Resource Ecology and Management
    SP  - 82
    EP  - 96
    PB  - Science Publishing Group
    SN  - 2575-3061
    UR  - https://doi.org/10.11648/j.ijnrem.20240903.12
    AB  - Land cover change is a significant driver of soil erosion. While soil erosion is a natural process, human activities can significantly alter the landscape, making soil more vulnerable to erosion. This erosion reduces a watershed's capacity to sustain vital natural resources and ecosystem services. This study investigated the impact of these changes on soil erosion within four hydrological units (Awach Kibuon, Awach Owade, Awach Kasipul, and Awach Kabondo) of the Awach Kibuon sub-basin between 2018 and 2023. The specific objective of the study was to quantify the effect of land cover change on soil erosion rate and determine how specific land cover types affect soil erosion in the study area. This study employed a quasi-longitudinal design to assess the influence of land cover changes on soil erosion. Sentinel-2 NDVI satellite imagery provided land cover data. The land cover maps, soil data, rainfall data and the Digital Elevation Model were used in the Revised Universal Soil Loss Equation Model within a GIS environment to estimate soil erosion rates. The study revealed a consistent decline in vegetation cover across all hydrological units, as indicated by a decrease in NDVI. The mean NDVI decreased by 12.88%, 10.92%, 4.78%, and 11.92% in Awach Kibuon, Awach Owade, Awach Kasipul and Awach Kabondo respectively. Conversely, the mean soil erosion rate increased by 23.9% in Awach Kibuon, 17.85% in Awach Owade, 24.43% in Awach Kasipul, and 20.54% in Awach Kabondo. Sediment yield increased by 33% in Awach Kibuon, 18% in Awach Owade, 17% in Awach Kasipul, and 23% in Awach Kabondo. These findings suggest a direct relationship between reduced vegetation and elevated soil erosion. The relationship between land cover and erosion varies depending on the density of vegetation. Areas with dense vegetation cover have an inverse relationship, highlighting the protective role of vegetation cover. However, the study also observed that very dense vegetation areas which were also found in high-sloped areas experienced high soil erosion rates. The erosion rate increases even in areas that have experienced an increase in vegetation cover. This is because these areas are also found in high-sloped areas. The slope factor superseded the ability of vegetation cover to protect against soil loss. In conclusion, the change in land cover has significantly increased soil erosion in the Awach Kibuon Sub-basin, however, the slope factor also accelerated soil loss in the basin. Therefore, a holistic approach that combines promoting vegetation cover with land management techniques like terracing and drainage channels is crucial for mitigating soil degradation and water sedimentation in sub-basin.
    
    VL  - 9
    IS  - 3
    ER  - 

    Copy | Download

Author Information
  • Department of Environmental Sciences, Maseno University, Kisumu, Kenya

    Biography: Olgah Hellens is a researcher and a graduate student at Maseno University (Kenya) and The Open University (UK). She completed her Bachelors education in Environmental Sciences at Maasai Mara University. In addition, she is also trained as a Forest Carbon Champion by the Food and Agriculture Organization of the United Nations (FAO) under the Improving Measure for Payment to Reduce Emissions and Strengthen Sinks (IMPRESS) and AIM4Forests project. She successfully completed training on the mapping of forest disturbances and forest restoration using a high-density time series analysis (SEPAL) platform. She has skills in what it takes to prepare Kenya for engaging with the international carbon finance mechanisms.

    Research Fields: Geographical Information Systems, Forest Monitoring, Environmental management

  • Department of Environmental Sciences, Maseno University, Kisumu, Kenya

    Biography: Dennis Masika is a lecturer at Maseno University in the Geography and Natural Resources Management Department. He earned his PhD in Environmental Science from Maseno University in 2019. He studied for his Master of Science in Hydrology at the University of Nairobi in 2005. He has more than 10 years’ experience in the research, assessment, and monitoring of water resources and Management. Dr. Masika is a member of the Hydrological Society of Kenya. He has participated in several international research collaboration projects in recent years.

    Research Fields: Hydrological and Hydraulic Modeling, Water Resources Management, Climate Change, Community Engagement, Business Analytics, and Machine learning

  • Department of Environmental Sciences, Maseno University, Kisumu, Kenya

    Biography: Albert Long’ora is a Lecturer in the Department of Environment Sciences in the School of Agriculture, Food security and Environmental Sciences in the Service of Maseno University where he teaches Environment, Biodiversity Conservation and Climate Change and Research course units. Dr. Long’ora is currently researching and guiding postgraduate students in the areas of climate change, Ecology and Biodiversity conservation. Dr. Long’ora Participated in Research Dissemination Workshop in Kenya organized by German Academic Exchange Programme (DAAD). He holds a Doctorate Degree in Environmental Science, Master of Science degree in Urban Environmental Planning and Management, and Bachelor of Science degree in Environmental Science (First Class Honours) from Maseno University and is a Registered and Licensed EIA/EA expert by NEMA

    Research Fields: Biodiversity Conservation, Climate Change, Environmental Science and Research