The flora growth stock plays an important role in stabilizing the urban socio-ecological system. This study aims to assess the importance of urban flora structure and traits on carbon stock potential in Abomey-Calavi city. Stratified random sampling approach was adopted to spatially distributing the sample plots. A mixed inventory schema was used to collect floristic and dendrometric data (stem height, DBH, crown diameter) in 173 one-hectare sample plots. These data were graphically and statistically analyzed. A total of 4,390 trees belonging to 105 plant species and 31 identity groups were identified and measured. The city’s total plant primary production was evaluated at 5111.651 t of biomass, 2489.374 t of carbon, 9136.004 t of CO2 sequestered for an ecological value of US$5,816.022. The average carbon stock was estimated at (CT: 14.389 t/ha; CO2T: 52.809 t/ha; EV: 316.850 $/ha). The stock of carbon estimated in institutional zone was significantly 2.11 – 3.03 times higher than those of two other strata (p<0.0001). Stem of DBH < 65 cm concentrated 67.35% of total carbon stock versus 32.65% for those of DBH ≥ 65 cm. The significant interaction between urban strata, diameter category and species origin revealed that native species accumulated 2 times more dry matter than exotic species for the stems of DBH ≥ 65 cm. The average carbon stock of identity groups was evaluated at (CT: 1.918 ± 3.348 t/ha; CO2T: 7.038 ± 12.288 t/ha; EV: 11.123 ± 19.420 $/ha). The index of contribution was ranged from 0.052 to 1.900 for exotic species groups, compared with 0.056 to 14.441 for native species groups. Native species with single leaves, semi-caducous foliage and disseminated by zoochory stored the most carbon in the city. Strategic forest reserves should be created to conserve species with high carbon stock potential. In this way, the growing effects of heat islands could be effectively mitigated and environmental education reinforced.
| Published in | International Journal of Natural Resource Ecology and Management (Volume 10, Issue 1) |
| DOI | 10.11648/j.ijnrem.20251001.12 |
| Page(s) | 12-26 |
| Creative Commons |
This is an Open Access article, distributed under the terms of the Creative Commons Attribution 4.0 International License (http://creativecommons.org/licenses/by/4.0/), which permits unrestricted use, distribution and reproduction in any medium or format, provided the original work is properly cited. |
| Copyright |
Copyright © The Author(s), 2025. Published by Science Publishing Group |
Stock of Biomass, Life-History Traits, Identity Group, Contribution Index, Urban Strata
 (1)
(1)  (2)
(2)  (3)
(3)  (4)
(4)  (5)
(5)  (6)
(6)  (7)
(7)  (8)
(8)  (9)
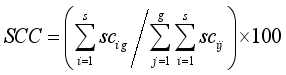
(9)  : Carbon stock of species i in group g;
  : Carbon stock of species i in any group j;
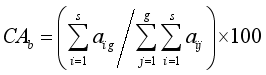
  : Abundance of species i in group g;
  : Abundance of species i in any group j ; g : Number of identity groups ; s : Number of species.
 N° | Identity group | CT(t/ha) | CO2T(t/ha) | EV ($/ha) | SCC (%) | ICo | β(se) | t-value | p-value | Signification |
|---|---|---|---|---|---|---|---|---|---|---|
1 | Exot + CoL + DF + AnChor | 3.192 ± 4.10 | 11.716 ± 15.05 | 18.516 ± 23.78 | 2,821 | 1,032 | 1.008 (0.33) | 3.044 | 0.0024 | ** |
2 | Exot + CoL + DF + NeChor | 0.663 ± 2.43 | 2.432 ± 8.92 | 3.844 ± 14.10 | 1,331 | 0,352 | -1.601 (0.26) | -6.177 | 0.0000 | *** |
3 | Exot + CoL + DF + ZoChor | 0.693 ± 1.28 | 2.543 ± 4.68 | 4.019 ± 7.40 | 0,612 | 0,472 | -0.867 (0.33) | -2.618 | 0.0090 | ** |
4 | Exot + CoL + EF + AnChor | 1.753 ± 3.76 | 6.434 ± 13.81 | 10.168 ± 21.82 | 5,070 | 0,863 | 0.306 (0.24) | 1.283 | 0.1998 | ns |
5 | Exot + CoL + EF + AuChor | 0.240 ± 0.30 | 0.880 ± 1.09 | 1.390 ± 1.72 | 0,019 | 0,423 | -1.709 (0.93) | -1.837 | 0.0665 | ns |
6 | Exot + CoL + EF + ZoChor | 2.928 ± 3.62 | 10.747 ± 13.29 | 16.984 ± 21.01 | 10,822 | 1,900 | 0.744 (0.23) | 3.262 | 0.0011 | ** |
7 | Exot + CoL + SDF + AuChor | 0.825 ± 1.31 | 3.027 ± 4.81 | 4.783 ± 7.60 | 0,828 | 0,343 | -0.512 (0.32) | -1.617 | 0.1063 | ns |
8 | Exot + SL + DF + AnChor | 2.047 ± 2.86 | 7.512 ± 10.49 | 11.872 ± 16.58 | 5,016 | 1,034 | 0.113 (0.25) | 0.455 | 0.6492 | ns |
9 | Exot + SL + DF + AuChor | 2.983 ± 4.35 | 10.946 ± 15.96 | 17.299 ± 25.22 | 2,157 | 0,853 | 0.796 (0.36) | 2.239 | 0.0254 | * |
10 | Exot + SL + DF + ZoChor | 0.274 ± 0.32 | 1.006 ± 1.17 | 1.589 ± 1.85 | 0,055 | 0,242 | -1.522 (0.61) | -2.514 | 0.0121 | * |
11 | Exot + SL + EF + AnChor | 4.152 ± 5.92 | 15.237 ± 21.73 | 24.08 ± 34.34 | 36,525 | 0,793 | 1.325 (0.20) | 6.501 | 0.0000 | *** |
12 | Exot + SL + EF + AuChor | 0.138 ± 0.11 | 0.505 ± 0.41 | 0.798 ± 0.65 | 0,039 | 0,212 | -1.833 (0.52) | -3.517 | 0.0005 | *** |
13 | Exot + SL + EF + ZoChor | 0.167 ± 0.16 | 0.613 ± 0.57 | 0.968 ± 0.91 | 0,114 | 0,156 | -1.760 (0.36) | -4.848 | 0.0000 | *** |
14 | Exot + SL + SDF + AnChor(R) | 1.872 ± 2.22 | 6.872 ± 8.14 | 10.86 ± 12.86 | 3,686 | 1,458 | -0.440 (0.18) | -2.390 | 0.0170 | * |
15 | Exot + SL + SDF + AuChor | 0.106 ± 0.09 | 0.389 ± 0.32 | 0.615 ± 0.51 | 0,013 | 0,140 | -2.028 (0.77) | -2.643 | 0.0083 | ** |
16 | Exot + SL + SDF + NeChor | 0.060 ± 0.09 | 0.222 ± 0.34 | 0.350 ± 0.55 | 0,036 | 0,052 | -2.832 (0.38) | -7.441 | 0.0000 | *** |
17 | Nati + CoL + DF + AuChor | 0.946 ± 0.65 | 3.471 ± 2.39 | 5.485 ± 3.78 | 0,266 | 0,778 | 0.005 (0.52) | 0.010 | 0.9919 | ns |
18 | Nati + CoL + DF + NeChor | 0.565 ± 0.73 | 2.075 ± 2.66 | 3.279 ± 4.21 | 0,091 | 0,665 | -1.348 (0.67) | -2.010 | 0.0447 | * |
19 | Nati + CoL + DF + ZoChor | 0.310 ± 0.30 | 1.138 ± 1.12 | 1.799 ± 1.76 | 0,112 | 0,547 | -1.138 (0.47) | -2.434 | 0.0151 | * |
20 | Nati + CoL + EF + AnChor | 3.642 ± 6.02 | 13.367 ± 22.09 | 21.125 ± 34.91 | 14,046 | 1,835 | 0.927 (0.23) | 4.093 | 0.0000 | *** |
21 | Nati + CoL + EF + NeChor | 0.574 ± 1.10 | 2.107 ± 4.04 | 3.330 ± 6.38 | 0,692 | 0,249 | -0.831 (0.30) | -2.781 | 0.0055 | ** |
22 | Nati + CoL + EF + ZoChor | 1.803 ± 0.71 | 6.616 ± 2.59 | 10.456 ± 4.09 | 0,145 | 3,179 | 0.990 (0.93) | 1.064 | 0.2877 | ns |
23 | Nati + CoL + SDF + AuChor | 0.483 ± 0.64 | 1.772 ± 2.34 | 2.801 ± 3.70 | 0,194 | 0,532 | -0.867 (0.45) | -1.937 | 0.0531 | ns |
24 | Nati + SL + DF + AnChor | 1.962 ± 2.41 | 7.199 ± 8.85 | 11.377 ± 13.99 | 3,073 | 0,843 | 0.317 (0.28) | 1.145 | 0.2524 | ns |
25 | Nati + SL + DF + AuChor | 0.111 ± 0.11 | 0.406 ± 0.39 | 0.641 ± 0.62 | 0,013 | 0,195 | -2.071 (0.77) | -2.700 | 0.0071 | ** |
26 | Nati + SL + DF + ZoChor | 2.688 ± 4.20 | 9.867 ± 15.41 | 15.593 ± 24.36 | 1,404 | 3,625 | -0.118 (0.40) | -0.293 | 0.7693 | ns |
27 | Nati + SL + EF + AnChor | 4.814 ± 8.56 | 17.668 ± 31.4 | 27.923 ± 49.62 | 6,189 | 3,671 | 1.254 (0.29) | 4.279 | 0.0000 | *** |
28 | Nati + SL + EF + ZoChor | 0.839 ± 0.77 | 3.080 ± 2.81 | 4.867 ± 4.45 | 1,584 | 0,695 | -0.163 (0.26) | -0.621 | 0.5351 | ns |
29 | Nati + SL + SDF + AuChor | 0.131 ± 0.08 | 0.480 ± 0.28 | 0.759 ± 0.44 | 0,084 | 0,205 | -1.784 (0.37) | -4.803 | 0.0000 | *** |
30 | Nati + SL + SDF + NeChor | 0.063 ± 0.00 | 0.232 ± 0.00 | 0.366 ± 0.00 | 0,003 | 0,056 | -2.321 (1.30) | -1.782 | 0.0751 | ns |
31 | Nati + SL + SDF + ZoChor | 18.425 ± 23.76 | 67.619 ± 87.19 | 106.865 ± 137.79 | 2,961 | 14,441 | 1.397 (0.67) | 2.082 | 0.0376 | * |
RZ | Residential Zone |
IZ | Institutional Zone |
RBZ | Road Buffer Zone |
h | Stem Height |
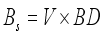
V | Stem Volume |
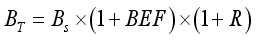
Bs | Stem Biomass |
BEF | Biomass Expansion Factor |
R | Roof Factor |
BD | Basic Density |
RMSE | Root-Mean-Square Error |
IF | Goodness-of-fit Index |
AIC | Akaike Information Criterion |
BEF | Biomass Expansion Factor |
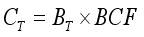
BCF | Biomass Conversion Factor |
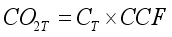
CCF | Carbon Conversion Factor |
BT | Total Biomass |
CT | Total Carbon |
CO2T | Total Carbon Dioxide |
EV | Ecological Value |
t | Tons |
GLM | Generalized Linear Model |
SCC | Contribution of species or species identity group to carbon stock |
ICo | Index of Contribution |
CAb | Relative Abundance of Species |
| Carbon Stock of Species i in Group g |
| Carbon Stock of Species i in any Group j |
| Abundance of Species i in Group g |
| Abundance of Species i in any Group j |
g | Number of Groups |
s | Number of Species |
se | Standard Error |
Exot | Exotic |
Nati | Native |
SL | Single Leaf |
CoL | Composite Leaf |
EF | Evergreen |
SDF | Semi-caducous |
DF | Deciduous |
AnChor | Anthropochory |
ZoChor | Zoochory |
AuChor | Autochory |
NeChor | Anemochory |
p | p-value |
| [1] | Alvey, A. A. Promoting and preserving biodiversity in the urban forest. Urban Forestry & Urban Greening. 2006, 5(4), 195 – 201. |
| [2] | Ikin, K., Knight, E., Lindenmayer, D. B., Fischer, J., Manning, A. D. The influence of native versus exotic streetscape vegetation on the spatial distribution of birds in the suburbs and reserves. Diversity and Distributions. 2013, 19(3), 294 – 306. |
| [3] | Barth, B. J., Fitzgibbon, S. I., Wilson, R. S. New urban developments that retain more remnant trees have greater bird diversity. Landscape and Urban Planning. 2015, 136, 122 – 129. |
| [4] | McDonnell, M. J., Pickett, S. T. A., Pouyat, R. V. The application of the ecological gradient paradigm to the study of urban effects. In Humans as components of ecosystems: subtle human effects and the ecology of populated areas. McDonnell M. J., Pickett S. T. A. (eds). Springer: New York, USA, 1993, pp. 175 – 189. |
| [5] | Walker, J. S., Grimm, N. B., Briggs, J. M., Gries, C., Dugan, L. Effects of urbanization on plant species diversity in central Arizona. Frontiers in Ecology and the Environment. 2009, 7(9), 465 – 470. |
| [6] | Williams, N. S. G., Schwartz, M. W., Vesk, P. A., McCarthy, M. A., Hahs, A. K., Clemants, S. E., Corlett, R. T., Duncan, R. P., Norton, B. A., Thompson, K., McDonnell, M. J. A conceptual framework for predicting the effects of urban environments on floras. Journal of Ecology. 2009, 97(1), 4 – 9. |
| [7] | Nero, B. F., Nana Afranaa, K., Jatta, R., Fatunbi, O. Tree Species Diversity and Socioeconomic Perspectives of the Urban (Food) Forest of Accra, Ghana. Sustainability. 2018b, 10(3417), 1 – 19. |
| [8] | McKinney, M. L. Urbanization, Biodiversity, and Conservation: The impacts of urbanization on native species are poorly studied, but educating a highly urbanized human population about these impacts can greatly improve species conservation in all ecosystems. BioScience. 2002, 52(10), 883 – 890. |
| [9] | McKinney, M. L. Urbanization as a major cause of biotic homogenization. Biological Conservation. 2006, 127, 247 – 260. |
| [10] | Kühn, I., Klotz, S. Urbanization and homogenization: comparing the floras of urban and rural areas in Germany. Biological Conservation. 2006, 127(3), 292 – 300. |
| [11] | Hutyra, L. R, Yoon, B., Alberti, M. Terrestrial carbon stocks across a gradient of urbanization: a study of the Seattle, WA region. Global Change Biology. 2011, 17, 783 – 797. |
| [12] | Kennedy, C., Steinberger, J., Gasson, B., Hansen, Y., Hillman, T., Havranek, M., Pataki, D., Phdungsilp, A., Ramaswami, A., Mendez, G. V. Methodology for inventorying greenhouse gas emissions from global cities. Energy Policy. 2010, 38(9), 4828 – 4837. |
| [13] | Davies, Z. G., Dallimer, M., Edmondson, J. L., Leake, J. R., Gaston, K. J. Identifying potential sources of variability between vegetation carbon storage estimates for urban areas. Environmental Pollution. 2013, 183, 133 – 142. |
| [14] | Sallustio, L., Quatrini, V., Geneletti, D., Corona, P., Marchetti, M. Assessing land take by urban development and its impact on carbon storage: Findings from two case studies in Italy. Environmental Impact Assessment Review. 2015, 54, 80 – 90. |
| [15] | Nowak, D. J., Crane, D. E. C storage and sequestration by urban trees in the USA. Environmental Pollution. 2002, 116(3), 381 – 389. |
| [16] | Russo, A., Escobedo, F. J., Timilsina, N., Schmitt, A. O., Varela, S., Zerbe, S. Assessing urban tree carbon storage and sequestration in Bolzano, Italy. International Journal of Biodiversity Science, Ecosystem Services & Management. 2014, 10(1), 54 – 70. |
| [17] | Lin, J. C., Chiu, C. M., Lin, Y. J., Liu, W. Y. Thinning effects on biomass and carbon stock for young Taiwania plantations. Nature Scientific Reports. 2018, 8, 3070. |
| [18] | Velasco, E., Roth, M., Norford, L., Molina, L. T. Does urban vegetation enhance carbon sequestration? Landscape and Urban Planning. 2016, 148, 99 – 107. |
| [19] | Shen, G., Wang, Z., Liu, C., Han, Y. Mapping aboveground biomass and carbon in Shanghai's urban forest using Landsat ETM+ and inventory data. Urban Forestry & Urban Greening. 2020, 51, 126655. |
| [20] | Nowak, D. J., Hirabayashi, S., Doyle, M., McGovern, M., Pasher, J. Air pollution removal by urban forests in Canada and its effect on air quality and Human Health. Urban Forestry & Urban Greening. 2018, 29, 40 – 48. |
| [21] | McDonald, R. I., Kroeger, T., Zhang, P., Hamel, P. The Value of US Urban Tree Cover for Reducing Heat-Related Health Impacts and Electricity Consumption. Ecosystems. 2019, 1 – 14. |
| [22] | Long, L. C., D’Amico, V., Frank, S. D. Urban Forest fragments buffer trees from warming and pests. Sci. Total Environ. 2019, 658, 1523 – 1530. |
| [23] | Pataki, D. E., Alberti, M., Cadenasso, M. L., Felson, A. J., McDonnell, M. J., Pincetl, S., Pouyat, R. V., Setälä, H., Whitlow, T. H. The Benefits and Limits of Urban Tree Planting for Environmental and Human Health. Frontiers in Ecology and Evolution. 2021, 9, 603757. |
| [24] | Grimm, N. B., Faeth, S. H., Golubiewski, N. E., Redman, C. L., Wu, J., Bai, X., Briggs, J. M. Global Change and the Ecology of Cities. Science. 2008, 319, 756 – 760. |
| [25] | Dangulla, M., Manaf, L. A., Ramli, M. F., Yacob, M. R. Urban tree composition, diversity and structural characteristics in North-western Nigeria. Urban Forest & Urban Green. 2020, 48, 126512. |
| [26] | Jiao, M., Xue, H., Yan, J., Zheng, Z., Wang, J., Zhao, C., Zhang, L., Zhou, W. Tree abundance, diversity and their driving and indicative factors in Beijing’s residential areas. Ecological Indicators. 2021, 125, 107462. |
| [27] | Elmqvist, T., Setala, H., Handel, S. N., van der Ploeg, S., Aronson, J., Blignaut, J. N., Gomez-Baggethun, E., Nowak, D. J., Kronenberg, J., de Groot, R. Benefits of restoring ecosystem services in urban areas. Curr. Opin. Environ. Sustain. 2015, 14, 101 – 108. |
| [28] | Nowak, D. J., Greenfield, E. J., Hoehn, R. E., Elizabeth, L. E. Carbon storage and sequestration by trees in urban and community areas of the United States. Environmental Pollution. 2013b, 178, 229 – 236. |
| [29] | Nowak, D. J., Hoehn, R. E., Bodine, A. R., Greenfield, E. J., O’Neil-Dunne, J. Urban Forest structure, ecosystem services and change in Syracuse, NY. Urban Ecosystems. 2013a, 1 – 23. |
| [30] | Lv, H., Wang, W., He, X., Xiao, L., Zhou, W., Zhang, B. Quantifying Tree and Soil Carbon Stocks in a Temperate Urban Forest in Northeast China. Forests. 2016, 7, 200. |
| [31] | Kramer, P. J., Kozlowski, T. T. Physiology of Woody Plants. 1st ed., Academic Press, New York, 1979, 811 p. |
| [32] | Stephenson, N. L., Das, A. J., Condit, R., Russo, S. E., Baker, P. J., Beckman, N. G., Coomes, D. A., Lines, E. R., Morris, W. K., Rüger, N., Lvarez, E., Blundo, C. Rate of tree carbon accumulation increases continuously with tree size. Nature. 2014, 507, 90. |
| [33] | Fuwape, J. A., Onyekwelu, J. C. Urban Forest Development in West Africa: Benefits and Challenges. Journal of Biodiversity and Ecological Sciences. 2011, 1(1), 77 – 94. |
| [34] | Nero, B. F., Callo-Concha, D., Denich, M. Structure, Diversity, and Carbon Stocks of the Tree Community of Kumasi, Ghana. Forests. 2018a, 9(519), 1 – 17. |
| [35] | Petersson, H., Holm, S., Ståhl, G., Alger, D., Fridman, J., Lehtonen, A., Lundström, A., Mäkipää, R. Individual tree biomass equations or biomass expansion factors for assessment of carbon stock changes in living biomass – A comparative study. Forest Ecology and Management. 2012, 270, 78 – 84. |
| [36] | Guendehou, G. H. S., Lehtonen, A., Moudachirou, M., Mäkipää, R., Sinsin, B. Stem biomass and volume models of selected tropical tree species in West Africa. Southern Forests. 2012, 74(2), 77 – 88. |
| [37] | Park, J. H., Baek, S. G., Kwon, M. Y., Je, S. M., Woo, S. Y. Volumetric equation development and carbon storage estimation of urban forest in Daejeon, Korea. Forest Science and Technology. 2018, 14(2), 97 – 104. |
| [38] | Ngo, K. M., Lum, S. Aboveground biomass estimation of tropical street trees. Journal of Urban Ecology. 2018, 4(1), 1 – 6. |
| [39] | Myeong, S., Nowak, D. J., Duggin, M. J. A temporal analysis of urban forest carbon storage using remote sensing. Remote Sens. Environ. 2006, 101, 277 – 282. |
| [40] | Shrestha, R., Wynne, R. H. Estimating Biophysical Parameters of Individual Trees in an Urban Environment using Small Footprint Discrete-Return Imaging Lidar. Remote Sensing. 2012, 4, 484 – 508. |
| [41] | Sogbossi, S. E. Importance de la phytodiversité dans l’évaluation du stock de carbone en milieu urbain au Bénin. Thèse de Doctorat unique, Université d’Abomey-Calavi, République du Bénin, 2023, p. 525. |
| [42] | Atchadé, A. J., Kanda, M., Folega, F., Diouf, A. A., Agbahoungba, S., Dourma, M., Wala, K., Akpagana, K. Urban flora structure and carbon storage potential of woody trees in different land use units of Cotonou (West Africa). Urban Science. 2023, 7, 106. |
| [43] | Shater, Z., de-Miguel, S., Kraid, B., Pukkala, T., Palahí, M. A growth and yield model for even-aged Pinus brutia Ten. stands in Syria. Annals of Forest Science. 2011, 68, 149 – 157. |
| [44] | INSAE (Institut National de la Statistique et de l’Economie [National Institute of Statistics and Economics]). RGPH4 : Que retenir de la population en 2013 [What to remember about the population in 2013]? Service des etudes demographiques, Cotonou, Benin, 2015, p. 27. |
| [45] | Nowak, D. J., Crane, E. D., Stevens, J. C., Hoehn, R. E., Walton, J. T., Bond, J. A Ground-Based Method of Assessing Urban Forest Structure and Ecosystem Services. Arboriculture & Urban Forestry. 2008, 34(6), 347 – 358. |
| [46] | Sogbossi, S. E., Zakari, S., Djego, G. J. Phytodiversity and Spatial Development of Urban Flora in Lokossa, Benin. International Journal of Natural Resource Ecology and Management. 2020, 5(4), 145 – 159. |
| [47] | Moussa, S., Kuyah, S., Kyereh, B., Tougiani, A., Mahamane, S. Diversity and structure of urban forests of Sahel cities in Niger. Urban Ecosystems. 2020, 23, 851 – 864. |
| [48] | Angiosperm Phylogeny Group, Chase, M. W., Christenhusz, M. J., Fay, M. F., Byng, J., Judd, W., Soltis, D., Mabberley, D., Sennikov, A., Soltis, P. An update of the Angiosperm Phylogeny Group classification for the orders and families of flowering plants: APG IV. Botanical Journal of the Linnean Society. 2016, 181(1), 1 – 20. |
| [49] | Guillaumet, J.-L. Recherches sur la végétation et la flore de la région du Bas-Cavally (Côte d’Ivoire) [Research on the vegetation and flora of the Bas-Cavally region (Ivory Coast)]. Memoires de l’ORSTOM. 1967, 20, 1 – 247. |
| [50] | Sokpon, N. Recherches écologiques sur la forêt dense semi-décidue de Pobè au Sud – Est du Benin : Groupements végétaux, structure, régénération naturelle et chute de litière [Ecological research on the dense semi-deciduous forest of Pobe in south-east Benin: Plant groups, structure, natural regeneration and litterfall]. These de doctorat en sciences agronomiques, Universite Libre de Bruxelles, Belgique, 1995, p. 350. |
| [51] | Kattge, J., Diaz, S., Lavorel, S., et al. TRY – a global database of plant traits. Global Change Biology. 2011, 17(9), 2905 – 2935. |
| [52] | Nero, B. F., Campion, B. B., Agbo, N., Callo-Concha, D., Denich, M. Tree and trait diversity, species coexistence, and diversity-functional relations of green spaces in Kumasi, Ghana. Procedia Engineering. 2017, 198, 99 – 115. |
| [53] | La Sorte, F. A., McKinney, M. L., Pysek, P., Klotz, S., Rapson, G. L., Celesti-Grapow, L., Thompson, K. Distance decay of similarity among European urban floras: the impact of anthropogenic activities on β-diversity. Global Ecology and Biogeography. 2008, 17, 363 – 371. |
| [54] | White, F. The vegetation of Africa. A descriptive memory to accompany the UNESCO-AETFAT/UNSO vegetation map of Africa, Natural Resources Research XX, UNESCO, Paris, 1983, p.356. |
| [55] | Arbonnier, M. Arbres, Arbustes et Lianes des zones sèches d’Afrique de l’Ouest. CIRAD, 2000, p. 576. |
| [56] | Louppe, D., Oteng-Amoako, A. A., Brink, M. (Eds). Plant Resources of Tropical Africa (PROTA): Timbers 1. PROTA Foundation, Backhuys, 2008, 7(1), p. 704. |
| [57] | Orwa, S., Mutua, C., Kindt, A., Jamnadass, R., Anthony, R. Agroforestree Database: a tree reference and selection guide. Version 4.0, vol. 0. Nairobi, Kenya: World Agroforestry Center, 2009. |
| [58] | Dansereau, P., Lems, K. The grading of dispersal types in plant communities. Contributions de l’Institut de Botanique de Montréal. 1957, 71, 1 – 52. |
| [59] | Link, A., Stevenson, P. R. Fruit dispersal syndromes in animal disseminated plants at Tinigua National Park, Colombia. Revista Chilena de Historia Natural. 2004, 77(2), 319 – 334. |
| [60] | Katinas, L., Crisci, J. V. Reconstructing the biogeographical history of two plant genera with different dispersion capabilities. Journal of Biogeography. 2008, 35(8): 1374 – 1384. |
| [61] | Cheptou, P. O., Carrue, O., Rouifed, S., Cantarel, A. Rapid evolution of seed dispersal in an urban environment in the weed Crepis sancta. Proceedings of the National Academy of Sciences. 2008, 105(10), 3796 – 3799. |
| [62] | Chassany, V., Potage, M., Ricou, M. Mini manuel de biologie végétale [Mini manual on plant biology]. Eds dunod, 2014, p. 240. |
| [63] | Lebrun, J., Gilbert, G. Une classification écologique des forêts du Congo [An ecological classification of Congo’s forests]. Institut National pour l’Etude Agronomique du Congo Belge (I. N. E. A. C.). 1954, 63, 9 – 89. |
| [64] | Sogbossi, S. E., Djego, G. J. Development of Stem Volume Equation for Urban Trees of Abomey-Calavi in Southern Benin (West Africa). American Journal of Biological and Environmental Statistics. 2021, 7(4), 111 – 120. |
| [65] | Donofrio, S., Maguire, P., Daley, C., Calderon, C., Lin, K. Forest Trends’ Ecosystem Marketplace. The Art of Integrity: State of Voluntary Carbon Markets, Q3 Insights Briefing. Washington DC: Forest Trends Association, 2022, p. 21. |
| [66] | IPCC. Good practice guidance for land use, land-use change and forestry. Hayama: IPCC/IGES, 2003. |
| [67] | Mokany, K., Raison, R. J., Prokushkin, A. S. Critical analysis of root: shoot ratios in terrestrial biomes. Global Change Biology. 2006, 12, 84 – 96. |
| [68] | Hernandez, M., Charland, P., Nolet, J., Arès, M. Potentiel de séquestration du carbone par des pratiques agroforestières dans le bassin versant de la rivière L’Ormière au Québec [Carbon sequestration potential of agroforestry practices in the L’Ormiere River watershed, Quebec]. Sa Majeste la Reine du chef du Canada, n° de catalogue A98-4/3-2007F-PDF, ISBN 978-0-662-07577-6, n° AAC 10398F, 2008, p. 51. |
| [69] | Bolza, E., Keating, W. G. African timbers: the properties, uses and characteristics of 700 species. Division of Building Research, CSIRO, Melbourne, Australia, 1972, pp.710. |
| [70] | Reyes, G., Brown, S., Chapman, J., Lugo, A. E. Wood densities of tropical tree species. General Technical Report SO-88, New Orleans, Louisiana, USA: U.S. Department of Agriculture, Forest Service, Southern Forest Experiment Station, 1992, p. 15. |
| [71] | Carsan, S., Orwa, C., Harwood, C., Kindt, R., Stroebel, A., Neufeldt, H., Jamnadass, R. African Wood Density Database. World Agroforestry Centre, Nairobi, 2012. |
| [72] | Eclou, B. S. I. Quantification du Stock de Carbone de la Biomasse Ligneuse de la Forêt Naturelle de Niaouli au Benin (Afrique de l’Ouest) [Quantification of above-ground carbon stock of woody plant in Niaouli Natural Forest in Benin (West Africa)]. Memoire de Master, FSA/UAC, 2014, p. 49. |
| [73] | Goussanou, C. A., Guendehou, S., Assogbadjo, A. E., Kaire, M., Sinsin, B., Cuni-Sanchez, A. Specific and generic stem biomass and volume models of tree species in a West African tropical semi-deciduous forest. Silva Fennica. 2016, 50, 2, article id 1474, 1 – 22. |
| [74] | Kora, H. S. A, Guendehou, S. G. H., Goussanou, C. A., Assogbadjo, A. E., Sinsin, B. Allometric equations from a non-destructive approach for biomass prediction in natural forest and plantation in West Africa. Southern Forests: a Journal of Forest Science. 2019, 81(2), 111 – 122. |
| [75] | Vieilledent, G., Fischer, F. J., Chave, J., Guibal, D., Langbour, P., Gérard, J. New formula and conversion factor to compute basic wood density of tree species using a global wood technology database. American Journal of Botany. 2018, 105(10), 1 – 9. |
| [76] | Chave, J., Coomes, D., Jansen, S., Lewis, S. L., Swenson, N. G., Zanne, A. E. Towards a worldwide wood economics spectrum. Ecology Letters. 2009, 12, 351 – 366. |
| [77] | Chave, J., Mechain, M. R., Burquez, A., et al. Improved allometric models to estimate the aboveground biomass of tropical trees. Global Change Biology. 2014, 20, 3177 – 3190. |
| [78] | Dobson, A. J., Barnett, A. G. An Introduction to Generalized Linear Models. 4th ed., Chapman & Hall/CRC, New York, USA, 2018, p. 392. |
| [79] | Wang, V., Gao, J. Estimation of carbon stock in urban parks: Biophysical parameters, thresholds, reliability, and sampling load by plant type. Urban Forestry & Urban Greening. 2020, 55, 126852, 1 – 9. |
| [80] | Lin, J., Ma, Q., Ju, Y., Zhang, H., Wang, Q., Huang, B. Relationships between urbanization, tree morphology, and carbon density: An integration of remote sensing, allometric models, and field survey. Urban For. & Urban Green. 2022, 76, 127725. |
| [81] | Ago, E. E. Sacralisation et niveau de maturation des forêts denses semi-décidues du plateau Adja au Sud-Ouest du Benin [Sacralization and level of maturation in the semi-deciduous dense forests of the Adja plateau in southwest Benin]. Memoire d’Ingenieur. Agronome. UAC, FSA, Benin, 2000, p. 141. |
| [82] | Zhao, T., Brown, D. G., Bergen, K. M. Increasing gross primary production (GPP) in the urbanizing landscapes of southeastern Michigan. Photogrammetric Engineering and Remote Sensing. 2007, 73, 1159 – 1168. |
| [83] | Davies, Z. G., Edmondson, J. L., Heinemeyer, A., Leake, J. R., Gaston, K. J. Mapping an urban ecosystem service: quantifying above-ground carbon storage at a city-wide scale. Journal of Applied Ecology. 2011, 48, 1125 – 1134. |
| [84] | Jaman, S., Zhang, X, Islam, F. Carbon storage and tree diversity in the urban vegetation of Dhaka city, Bangladesh: a study based on intensive field investigation. Arboricultural Journal. 2020, 1 – 17. |
| [85] | Poorter, L., van der Sande, M. T., Thompson J., et al. Diversity enhances carbon storage in tropical forests. Global Ecology and Biogeography. 2015, 1 – 15. |
| [86] | Bouriaud, O., Teodosiu, M., Kirdyanov, A. V., Wirth, C. Influence of wood density in tree-ring-based annual productivity assessments and its errors in Norway spruce. Biogeosciences. 2015, 12, 6205 – 6217. |
APA Style
Zakari, S., Sogbossi, E. S., Gobi, A. M., Djego, J. G., Toko, I. I. (2025). Assessing the Importance of Urban Flora Structure and Traits on Carbon Stock Potential in Abomey-Calavi City in Benin (West Africa). International Journal of Natural Resource Ecology and Management, 10(1), 12-26. https://doi.org/10.11648/j.ijnrem.20251001.12
ACS Style
Zakari, S.; Sogbossi, E. S.; Gobi, A. M.; Djego, J. G.; Toko, I. I. Assessing the Importance of Urban Flora Structure and Traits on Carbon Stock Potential in Abomey-Calavi City in Benin (West Africa). Int. J. Nat. Resour. Ecol. Manag. 2025, 10(1), 12-26. doi: 10.11648/j.ijnrem.20251001.12
@article{10.11648/j.ijnrem.20251001.12,
  author = {Soufouyane Zakari and Erick Senademi Sogbossi and Aissetou Mohamed Gobi and Julien Gaudence Djego and Ismaïla Imorou Toko},
  title = {Assessing the Importance of Urban Flora Structure and Traits on Carbon Stock Potential in Abomey-Calavi City in Benin (West Africa)
},
  journal = {International Journal of Natural Resource Ecology and Management},
  volume = {10},
  number = {1},
  pages = {12-26},
  doi = {10.11648/j.ijnrem.20251001.12},
  url = {https://doi.org/10.11648/j.ijnrem.20251001.12},
  eprint = {https://article.sciencepublishinggroup.com/pdf/10.11648.j.ijnrem.20251001.12},
  abstract = {The flora growth stock plays an important role in stabilizing the urban socio-ecological system. This study aims to assess the importance of urban flora structure and traits on carbon stock potential in Abomey-Calavi city. Stratified random sampling approach was adopted to spatially distributing the sample plots. A mixed inventory schema was used to collect floristic and dendrometric data (stem height, DBH, crown diameter) in 173 one-hectare sample plots. These data were graphically and statistically analyzed. A total of 4,390 trees belonging to 105 plant species and 31 identity groups were identified and measured. The city’s total plant primary production was evaluated at 5111.651 t of biomass, 2489.374 t of carbon, 9136.004 t of CO2 sequestered for an ecological value of US$5,816.022. The average carbon stock was estimated at (CT: 14.389 t/ha; CO2T: 52.809 t/ha; EV: 316.850 $/ha). The stock of carbon estimated in institutional zone was significantly 2.11 – 3.03 times higher than those of two other strata (pT: 1.918 ± 3.348 t/ha; CO2T: 7.038 ± 12.288 t/ha; EV: 11.123 ± 19.420 $/ha). The index of contribution was ranged from 0.052 to 1.900 for exotic species groups, compared with 0.056 to 14.441 for native species groups. Native species with single leaves, semi-caducous foliage and disseminated by zoochory stored the most carbon in the city. Strategic forest reserves should be created to conserve species with high carbon stock potential. In this way, the growing effects of heat islands could be effectively mitigated and environmental education reinforced.
},
 year = {2025}
}
TY  - JOUR
T1  - Assessing the Importance of Urban Flora Structure and Traits on Carbon Stock Potential in Abomey-Calavi City in Benin (West Africa)

AU  - Soufouyane Zakari
AU  - Erick Senademi Sogbossi
AU  - Aissetou Mohamed Gobi
AU  - Julien Gaudence Djego
AU  - Ismaïla Imorou Toko
Y1  - 2025/03/18
PY  - 2025
N1  - https://doi.org/10.11648/j.ijnrem.20251001.12
DO  - 10.11648/j.ijnrem.20251001.12
T2  - International Journal of Natural Resource Ecology and Management
JF  - International Journal of Natural Resource Ecology and Management
JO  - International Journal of Natural Resource Ecology and Management
SP  - 12
EP  - 26
PB  - Science Publishing Group
SN  - 2575-3061
UR  - https://doi.org/10.11648/j.ijnrem.20251001.12
AB  - The flora growth stock plays an important role in stabilizing the urban socio-ecological system. This study aims to assess the importance of urban flora structure and traits on carbon stock potential in Abomey-Calavi city. Stratified random sampling approach was adopted to spatially distributing the sample plots. A mixed inventory schema was used to collect floristic and dendrometric data (stem height, DBH, crown diameter) in 173 one-hectare sample plots. These data were graphically and statistically analyzed. A total of 4,390 trees belonging to 105 plant species and 31 identity groups were identified and measured. The city’s total plant primary production was evaluated at 5111.651 t of biomass, 2489.374 t of carbon, 9136.004 t of CO2 sequestered for an ecological value of US$5,816.022. The average carbon stock was estimated at (CT: 14.389 t/ha; CO2T: 52.809 t/ha; EV: 316.850 $/ha). The stock of carbon estimated in institutional zone was significantly 2.11 – 3.03 times higher than those of two other strata (pT: 1.918 ± 3.348 t/ha; CO2T: 7.038 ± 12.288 t/ha; EV: 11.123 ± 19.420 $/ha). The index of contribution was ranged from 0.052 to 1.900 for exotic species groups, compared with 0.056 to 14.441 for native species groups. Native species with single leaves, semi-caducous foliage and disseminated by zoochory stored the most carbon in the city. Strategic forest reserves should be created to conserve species with high carbon stock potential. In this way, the growing effects of heat islands could be effectively mitigated and environmental education reinforced.

VL  - 10
IS  - 1
ER  -
Institute of Living Environment, University of Abomey-Calavi, Abomey-Calavi, Benin
Institute of Living Environment, University of Abomey-Calavi, Abomey-Calavi, Benin; Faculty of Agronomic Sciences, University of Abomey-Calavi, Abomey-Calavi, Benin
Institute of Living Environment, University of Abomey-Calavi, Abomey-Calavi, Benin
Faculty of Agronomic Sciences, University of Abomey-Calavi, Abomey-Calavi, Benin
Institute of Living Environment, University of Abomey-Calavi, Abomey-Calavi, Benin
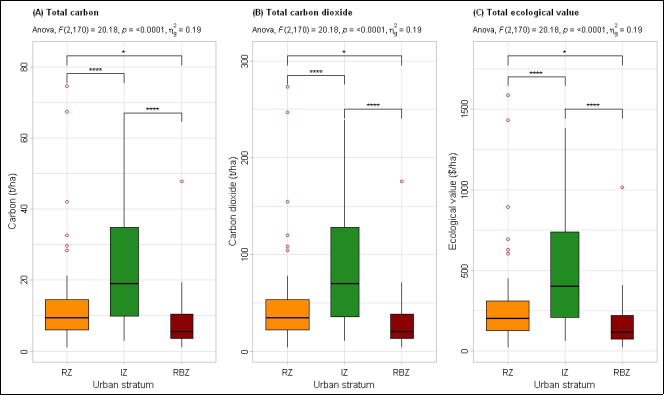
Figure 1.
Total carbon stock in urban strata. RZ – Residential zone; IZ – Institutional zone; RBZ – Road buffer zone; level of significance (“****”: p<0.0001, “*”: p<0.05, ns: Non-significant at 0.05).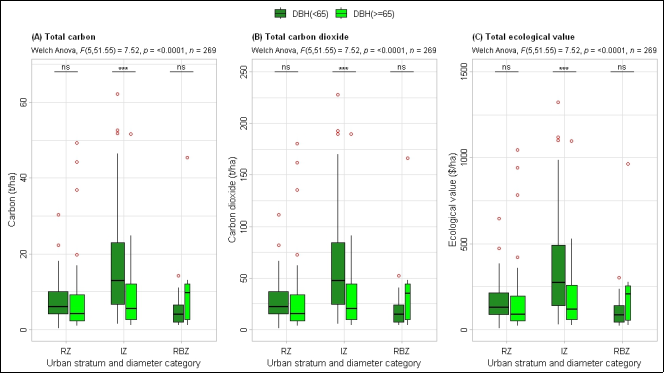
Figure 2.
Total carbon stock by diameter category in urban strata. RZ – Residential zone; IZ – Institutional zone; RBZ – Road buffer zone; level of significance (“***”: p<0.001, ns: Non-significant at 0.05).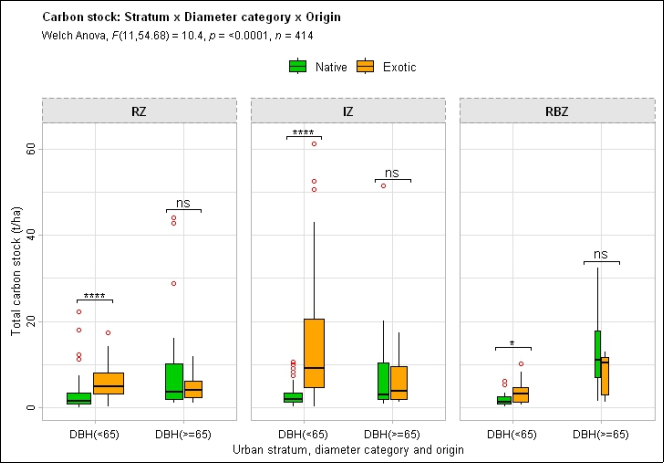
Figure 3.
Total carbon stock by origin and diameter category in urban strata. RZ – Residential zone; IZ – Institutional zone; RBZ – Road buffer zone; level of significance (“****”: p<0.0001, “*”: p<0.05, ns: Non-significant at 0.05).Information


