Research Article | | Peer-Reviewed

Dynamic Trends and Patterns of Urban Development in Bamenda City of Cameroon

Received: 30 January 2025     Accepted: 17 February 2025     Published: 27 February 2025
Views:       Downloads:
Abstract

The urban developmental process depicts transformation of the landscape through spatial changes in zones closer to towns and cities across the world. This is evident in the spatio-temporal and sectorial changes in demographic, social, economic, technological and environmental aspects. Bamenda City is experiencing rapid growth in population and continues expansion of built-up land use, resulting in the reduction of agricultural and forest lands. There is continuous haphazard densification of buildings and uncontrolled urban sprawl. The aim of this article is to examine the dynamic trends and drivers of urban development anchored on the premise that urban development trends are directly related to population growth in Bamenda City. The methodology uses historical survey and correlational designs of field investigations to administer 300 questionnaires to the target population with a spatial picture reflected on the three municipalities (Bamenda I. Bamenda II and Bamenda III) for comparative analysis. Landsat Images were processed to show the spatio-temporal changes in land uses from 2000-2024. This was complemented by field observations and secondary data sources from institutions. Findings revealed that urban development is manifested in significant increase in infrastructures (22.7%) and peri-urban growth (18.2%). The trend is increasing in spatial rates seen in Bamenda I (47%), Bamenda II (42%) and Bamenda III (45%). Farmland use has reduced from 124.36 km2 (44.6%) in 2000 to 119.17 km2 (42.7%) in 2024 while built-up land has increased from 28.16 km2 (10.1%) 62.99 km2 (22.6%) in 2024. Population increase has been most dominant driver of urban development (Bamenda II (31%), Bamenda I (30%) and Bamenda III (28.8%). This replicates an inseparable nexus between population growth and urban. The study recommends the need for controlled land use planning to mitigate the increasing duplication of land uses and planned urban development.

Published in International Journal of Sustainable Development Research (Volume 11, Issue 1)
DOI 10.11648/j.ijsdr.20251101.12
Page(s) 12-24
Creative Commons

This is an Open Access article, distributed under the terms of the Creative Commons Attribution 4.0 International License (http://creativecommons.org/licenses/by/4.0/), which permits unrestricted use, distribution and reproduction in any medium or format, provided the original work is properly cited.

Copyright

Copyright © The Author(s), 2025. Published by Science Publishing Group

Keywords

Drivers, Land Use, Population, Trends, Urban Development

1. Introduction
The urban developmental process depicts the transformation of the landscape through spatial changes in zones closer to towns and cities across the world . This is manifested in sprawling which has consequences, predisposing space mutations through land uses dynamics at spatio-temporal scales . Reflected in the social, economic, cultural and environmental mutations, it denotes spatial transformations in increased space occupation as population increases. More than half of the world’s population live in urban areas. Landmark statistics in 2014 estimated that for the first time in human history over 50% of the world’s population was living in urban areas leading to a growth in the size of urban spaces . Due to the ongoing urbanisation and growth of the world’s population, estimates indicate that about 2.5 billion more people will be added to the urban population by 2050, mainly in Africa and Asia . From 2010–2050, the percentage of the global urban population is projected to increase from 51.6%–67.2% , while the global built-up area will increase three times. As indicated by , the urban population grew from 746 million in 1950 (29.6% of the world population) to 2.85 billion in 2000 (46.6%), and it reached 3.96 billion in 2015 (54%). It is expected to total 5.06 billion by 2030 constituting 60% of the world population.
In the developed world, urban development is revealed through temporal, spatial and sectorial changes in the demographic, social, economic, technological and environmental aspects . These changes manifest themselves in the increasing concentration of population in human settlements, increasing involvement of people in the secondary and tertiary production functions. Urban development process depicts trends of dramatic changes in landscape patterns driven by diverse physical and human factors . Faced with this upsurge, there is a need for harmony among the spatial, social and environmental aspects of the urban centers and their inhabitants. In Western Europe and North America, the peri-urban is a zone of social and economic change and spatial restructuring and increased sprawling . The pattern of rural transformation is oriented toward villages adjacent to towns which are spatially and socio-economically transformed over time to urban landscapes. This degree of rural transformation from rural to urban however decreases as one move away from the periphery of the city towards the hinterlands of the urbanized areas. This implied that the trend and pattern of urbanisation has an inverse relationship between the degree of transformation in a village and its distance from the nearest urban area .
Urban development trends and patterns in most primate cities in developing countries have witnessed an expansion towards wetlands and riparian zones. The most notable pattern is the expansion of built-up areas towards biodiversity hubs as the number of habitats and biological communities are reduced and replaced by settlements as well as the conversion of land from rural to urban uses . The areas are characterized by changing local economic and employment structures from agriculture to manufacturing, as a result of rapid population growth and migration, rising land values, mixed land uses and significant infrastructural development . In the case of Africa, remarked that the trends in the decline of agricultural land as a result of space transformation is most resulting from the ever growing population of towns and cities . This is seen especially in Africa and South East Asia with suburbs transformation becoming a major feature aimed at the transformation of the agricultural land use to urban build-up .
The urban population in Cameroon doubled within a period of 30 years after independence moving from 28.3% in 1976 to 44.3% in 2005 . Urban development trends have resulted in rapid urban expansion of Cameroonian cities such as Yaounde, Douala, Bafoussam and Bamenda . It was projected to be 50.6% in 2010, 53.5% for 2015 (projections from National Census 2005). The impact of the expansion of these cities is felt at the peripheries like Bikoko in Douala, Mile 16 in Buea, Barombi Kang in Kumba and Nkwen in Bamenda among others. These buffer zones within cities, have been transformed to dense neighbourhoods of spontaneous settlements, and suburbs. Bamenda city has been witnessing rapid changes in land use over the years as a result urban development at varied degrees . The Bamenda I, II and III Municipalities are growing faster in population and infrastructures, witnessing continues expansion of built-up and commercial land among others, resulting in the reduction of agricultural and forest lands. Bamenda city suffers from continuous haphazard densification and gentrification of the town’s fabric from the city centre outwards with spatio-temporal land use dynamics and urban sprawl in the municipalities of the City .
A number of studies have been carried out in Bamenda City with more focus on developmental processes through urban and peri-urban transformation resulting from land use dynamics and implications on livelihoods . This study did not consider changes in patterns and trends of urban development compared in three municipalities over different periodical trends. This seen in with more emphasis or the sprawling process in peri-urban areas of Bamenda City. The study failed to consider the major trends and patterns of city transformation in its evolutionary phases with multiple triggering mechanisms. All these constitute a research gap as this study focuses on the evolution and change in the transformational process from 2000-2024 with more emphasis on the drivers of these changes across Bamenda I, II and III Municipalities of the City. The rationale of this study is therefore to consider the trends and drivers of urban development. As such, the aim of this study is to examine the dynamic trends and patterns of urban development anchored on the premise that development dynamic trends are directly related to population growth in Bamenda City.
2. Study Area and Methods
The study area is limited to the city of Bamenda made up of three Municipalities (Bamenda I, II and III) (Figure 1). This covers urban landscape of Bamenda in Mezam Division of the North West Region of Cameroon located between Latitude 5°56 and 5°58 North of the Equator and Longitude 10°09 and 10°11 East of the Greenwich Meridian and situated at elevation 1258 m above sea level .
Source:

Download: Download full-size image

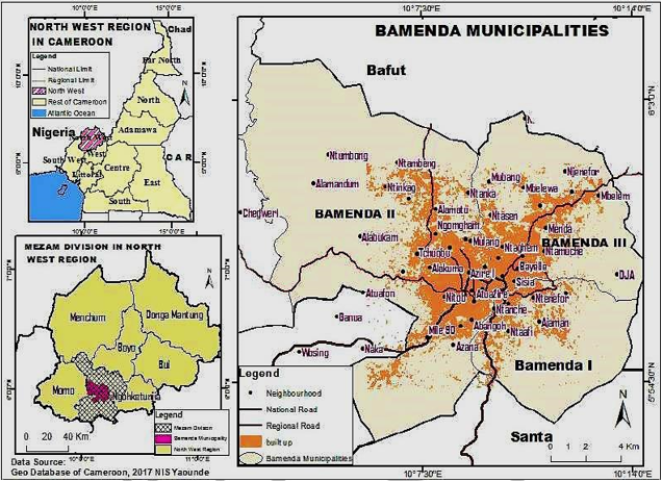
Figure 1. Location of Bamenda City in Mezam Division of the North West Region of Cameroon.
It is segmented into two major areas: the upland area constructed above the Bamenda escarpment along the Mendankwe-Nkwen axis and the lowland area below the Bamenda escarpment called ‘Down town’ found along the Mankon-Nkwen axis and the Nkwen-Mankon-Nsongwa-Alabukam Axis. It has a tropical climate marked by a strong seasonality with a mean annual rainfall of about 2000 mm and temperature ranging from 21°C -25°C . It has a population growth rate of 2.5%, the urban population of Bamenda City has been projected in 2024 to be 1279904 people. Using a historical survey and correlational research designs, a sample of 300 questionnaires were administered to the target population made up of individuals that are resident in the urban and peri-urban areas, landlords, tenants, traditional authorities, businessmen, religious authorities, shop owners, drivers and bike riders, and hawkers that were randomly selected from the different quarters across the city. These areas selected from the three different municipalities were selected judged on the fact that they have witnessed significant transformational dynamics since 2000 and purposively chosen. Structured interviews with six (6) participants were also conducted to the Mayors of Bamenda I, II and III and the Fons of Bamendankwe, Mankon and Nkwen who narrated the history of urban growth and transformation before and after 2007 when the municipalities were created. This data was complement by field observations and secondary data sources (population growth, built-up areas, and dynamics in infrastructural development) from institutions. The data was analyzed using descriptive and inferential statistical tool with a spatio-temporal picture reflected on the three municipalities and in three periodical trends for comparative analysis. To assess these trends and quantitative changes in land use and land cover change(LU/LCC), the total LU/LCC between the two periods was calculated as follows: Total LU/LCC Gain/loss = Area of the final year Minus Area of the initial year. The Percentage of LU/LCC Gain/loss was then calculated as:
% gain or loss in LU/LC=Area of the final year-Area of the innitial yearTotal surface area×100
From these calculations, the terrain slope and LU/LC relationship was developed by overlaying the slope generated from the Digital Elevation Model (DEM) of the study area and the classified maps. Then, the distribution of LU/LCC with slope was quantified. From the surface areas, the percentage changes were further calculated by looking at the differences between the base and the current year and dividing it by the current year multiplied by 100.
3. Results and Discussions
3.1. Dynamics of Urban Development in Bamenda City
Urban development in Bamenda City have been changing in the different distributional patterns and trends. Major manifestations are depicted in physical landscape changes and the multiplication of urban functions. Urban development portrays inequalities in the distribution of the process across the municipalities (Table 1).
Table 1. Major urban development indicators in the Bamenda City.

Major urban development indicators

Bamenda I

Bamenda II

Bamenda III

Freq

%

Freq

%

Freq

%

Significant increase in infrastructures

5

22.7

26

16.7

20

9.01

Increasing population

2

9.1

34

21.8

15

12.3

Overcrowding

1

4.5

16

10.3

8

6.6

Connection to services

2

9.1

12

7.7

10

8.2

Access to improved water sanitation

1

4.5

10

6.4

6

4.9

Durable structure

0

00

6

3.8

12

9.8

Land use changes

3

13.6

19

12.2

19

15.6

Peri-urban growth

4

18.2

12

7.7

11

9.01

Increased urban-rural linkages

2

9.1

10

7.8

6

4.9

Increased service provision

2

9.1

11

7.1

5

4.1

Total

22

100

156

100

122

100

Source: Field work (2024)
In Bamenda I Municipality, it is manifested in significant increase in infrastructures (22.7%). There have been planned and unplanned housing construction and road extension in this area. The pattern of this extension has been towards the peri-urban areas. This explains why peri-urban growth (18.2%) constitute a major aspect of urban development in this municipality. In Bamenda II municipality, increasing population is a major indicator of urban development. The 21.8% rate is accounted for by the population growth which is the main triggering mechanism for land use changes. The increasing demand for settlement space and other land uses practices/ have significantly transformed most of the rural and peri-urban landscapes and land uses into urban land uses (12.2%) as seen in . The changes in these land use in the municipality is evidenced from the significant surge in implantation urban infrastructures (16.7%). In Bamenda III Municipality, the most manifested indicator of urban development is the changes in land uses (15.6%). This is seen from the fact there have the rapid transformation of rural and peri-urban land uses in the area to urban land uses . Housing construction towards the agricultural areas in the peripheral areas have been depicting and increasing trend. This is linked to the increase in population growth in this area (12.3%). All these findings deviate from the analysis of who posited the main indicator of urban development in is sprawling. This was explained by the fact that the study was focused in the sprawling process in peri-urban areas of the Metropolis.
3.2. Trends in the Urban Development Process in Bamenda City
Urban development in Bamenda City is evident through qualitative and quantitative indicators.
3.2.1. Spatial Rates of Urban Development in Bamenda City
The trends in the dynamics of urban development in Bamenda City is a function of the evolution and change in the development process. There are great spatial variations in the manifestations of urban development trends as seen on (Figure 2).
Source: Field Survey (2024)

Download: Download full-size image

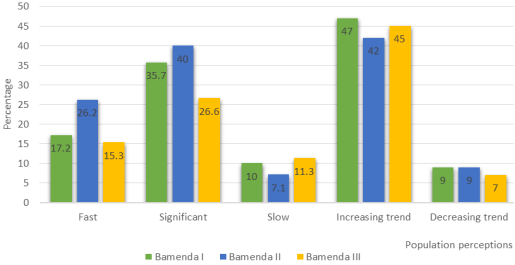
Figure 2. Qualitative variations in the rates of urban expansion across Bamenda City.
The general trend of urban development has been increasing. This is seen mostly in Bamenda I (47%), Bamenda II (42%) and Bamenda III (45%). This is explained by the increasing rates of constructions as well as the peri-urban and rural transformation of land uses in this area from agricultural to built-up land uses as echoed by ). There has been the emergence of new quarters and new layouts that are rapidly developing in all the urban areas of the different Municipalities. The development of the city has been explained by the increasing population from within the city and out of the city as it remains a major destination of migrants from other divisions and sub-divisions of the North West Region. Urban development is marked by the physical transformation of the peri-urban and rural areas into urban areas as a major aspect in the evolution and development of the urban areas in Bamenda City . Housing and related infrastructural constructions resulting from population increase have evolved and changed in historical times from 2000-2024. This is consistent with the findings of who explained that trends in urban development is related to surging infrastructural development in land use conversion.
3.2.2. Land Use Land Cover Changes and Urban Development Trends
The spatial dynamic trends in urban development are based in the changes that have occurred in the different land uses over the years. The basis for the justification of this proposition is that the urban development process and trends have continually been shaped by the dynamic nature of the population growth over time and the alterations of land use practices in the urban and peri-urban landscape as reflected in the study of . This has gone a long way to usher changes in the rate of urban expansion in Bamenda city. There have been changes in land uses from predominantly agrarian land use to more of residential and commercial land uses (Table 2) as shown in the results of .
Table 2. Land use/land cover change detection from 2000-2024 in Bamenda City.

Land cover

2000

2005

2010

2015

2020

2024

Area (km2)

Area (km2)

Area (km2)

Area (km2)

Area (km2

Area (km2)

Built up

28.16

33.40

36.51

47.09

55.31

62.99

Farmland

124.36

123.70

119.93

119.40

119.31

119.17

Montane forest

13.18

12.36

11.56

9.99

6.41

6.39

Gallery forest

54.18

54.28

53.86

53.87

51.71

48.3

Rangeland

32.04

31.10

30.91

29.62

27.98

26.48

Wetlands

26.93

24.01

23.08

19.88

18.10

15.52

Water

0.17

0.17

0.17

0.17

0.17

0.17

Total

279.02

279.02

279.02

279.02

279.02

279.02

Source: Calculations from Landsat Images (2000, 2005, 2010, 2015, 2020 and 2024)
The total stock of land use/land cover change is 279.02 Km2. These land cover changes have variations quantitatively in spatial proportions. The combined changes in the evolution of land uses are quantified based on the statistics derived from the processing. The urban land use situation between 2000 and 2005 indicate that in this period, Bamenda had the status of an Urban Council limited to growth around the Central Business District in present day “Commercial Avenue”. This is consistent with the findings of who explained the role of commercial centres as major growth poles from where the urban development process originates. Urban land uses were dominated by farmlands, wetlands/gallery forest and other vegetal cover land uses as seen in (Figure 3; Table 3).
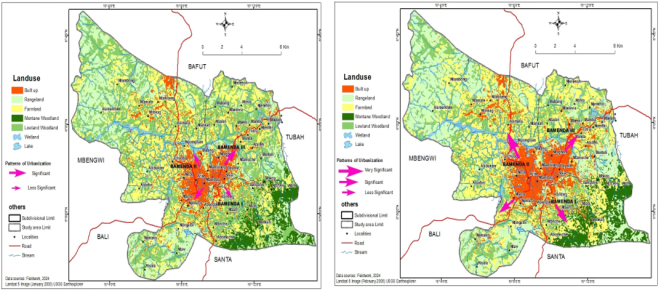
Figure 3. Land use/Land cover changes for 2000 and 2005.
Table 3. Land use/land cover change variations from 2000-2005 in Bamenda City.

Land cover

2000

2005

% changes

Area (km2)

%

Area (km2)

%

Built up

28.16

10.1

33.40

12

+1.9

Farmland

124.36

44.6

123.70

44.3

-0.3

Montane forest

13.18

4.7

12.36

4.4

-0.3

Gallery forest

54.18

19.4

54.28

19.5

+0.1

Rangeland

32.04

11.5

31.10

11.1

-0.4

Wetlands

26.93

9.7

24.01

8.6

-1.1

Water

0.17

0.06

0.17

0.06

00

Total

279.02

100

279.02

100

//

Source: Calculations from Landsat Images (2000 and 2005)
Farmland use was the highest with land use 124.36 km2 (44.6%) and 123.70 km2 (44.3%) in 2000 and 2005 respectively as compared to the built up area which was made up only of 28.16 km2 (10.1%) and 33.40 km2 (12%) in the same periods. This positive changes on built-up land use (+9) and a slight decrease in farmland use (-0.3) were due to the low population densities and enough land for bush fallowing and shifting cultivation. Extensive agriculture was the dominant farming practice since land was available and relatively cheaper. The population had no diverse economic activities but for agriculture which was dominantly practiced there by soliciting most of the land for farming. This subsistence agriculture and evident farmlands were more in the peri-urban areas of Bamenda urban zone concentrated only in the north west of the city. This means that urban growth had started before this period and grew faster after this period due to the creation of the different municipalities in 2007 that was accompanied by the provision of the different urban facilities, services and infrastructures to the peri-urban areas . This is the reason why gallery forests were having a positive percentage change as wetlands were still under exploited for farming and construction land uses. These are the justifications for the 54.18 km2 (19.4%) 54.28 km2 (19.5%) and a percentage increase of +0.1%. the increasing population and land use dynamics contributed to a rapid and negative change in farmland use from 2010 to 2015 (Figure 4; Table 4).
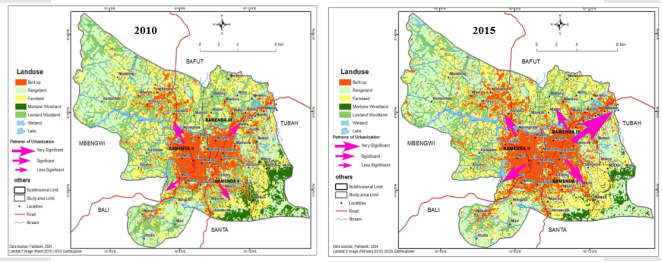
Figure 4. Land use/Land cover changes for 2010 and 2015.
Table 4. Land use/land cover change variations from 2010-2015 in Bamenda City.

Land cove

2010

2015

% changes

Area (km2)

%

Area (km2)

%

Built up

36.51

13.1

47.09

16.9

+3.8

Farmland

119.93

43

119.40

42.8

-0.2

Montane forest

11.56

4.1

9.99

3.6

-0.5

Gallery forest

53.86

19.3

53.87

19.3

00

Rangeland

30.91

11.1

29.62

10.6

-0.5

Wetlands

23.08

8.3

19.88

7.1

-1.2

Water

0.17

0.06

0.17

0.06

00

Total

279.02

100

279.02

100

//

Source: Calculations from Landsat Images (2010 and 2015)
In 2007 Bamenda I, II and III Municipalities were created and were considered as growth poles and focal points of the origin of urban and peri-urban growth and development as they acted as growth poles . The second trend of evolution in the land cover changes from 2010-2015 indicates an increase in build-up areas from 36.51 km2 (13.1%) in 2010 (a +1.1% increase from 2005) to 47.09 km2 (16.9%) in 2015 to (a +3.8% increase from 2010) at the detriment of farmlands and wetlands dropping significantly from 119.93 km2 (43%) in 2010 to 119.40 km2 (42.8%) in 2015 for farmland use. This was accompanied by a drop in wetlands from 23.08 km2 (8.3%) in 2010 to 19.88 km2 (7.1%). These are resonated in the report of the pointing to the fact that urban development has severe effect on wetland ecosystems. Montane forest woodland and rangelands also decreased at the same comparative rates of -0.5% between 2010 and 2015. Urban land use dynamics between 2020 and 2024 indicate the dominance of built-up areas (Figure 5; Table 5).
Figure 5. Land use/Land cover changes for 2020 and 2024.
Table 5. Land use/land cover change variations from 2020-2024 in Bamenda City.

Land cover

2020

2024

% changes

Area (km2)

%

Area (km2)

%

Built up

55.31

19.8

62.99

22.6

+2.8

Farmland

119.31

42.8

119.17

42.7

-0.1

Montane forest

6.41

2.3

6.39

2.3

00

Gallery forest

51.71

18.5

48.3

17.3

-1.2

Rangeland

27.98

10

26.48

9.5

-0.5

Wetlands

18.10

6.5

15.52

5.6

-0.9

Water

0.17

0.06

0.17

0.06

00

Total

279.02

100

279.02

100

//

Source: Calculations from Landsat Images (2020 and 2024)
The period 2020 to 2024 witnessed significant land use/land cover changes as well as sprawl in the three municipalities. Table 5 reveals that built-up area changed significantly from 55.31 km2 (19.8%) in 2020 to 62.99 km2 (22.6%) in 2024. This constitutes approximately +2.8% change (increase in build-up land use). Vegetation cover and related land uses have decrease substantially leading to negative anomalies, resulting from anthropogenic activities. Farmland decreased from 119.31 km2 (42.8%) in 2020 to 119.17 km2 (42.7%) in 2024 constituting a loss in surface area of -0.1%. Wetland recorded the highest decrease from 18.10 km2 (6.5%) in 2020 to 15.5 km2 (5.6%) in 2024 constituting approximately -0.9% decrease attributed to human encroachment. All these analysis reveal significant disparities in the surface area covered by different land uses in the municipalities of the Bamenda City. Built-up areas aside, all the other land use/land cover in the three municipalities of the Bamenda City have recorded a decline in terms of change in surface area as pointed out by . Significant rates of urban development from 2016 to 2024 indicated that the patterns of were more from the urban areas of Bamenda city towards the north east, south east and south west. This pattern of growth was more in the Bamenda I and Bamenda III Sub-Division. This led to the emergence of multiple urban neighbourhoods Nkom and Alahting in Bamenda I more urban expansion from Menda to Mbesi, Futru and Alahlie in Bamenda III sub-division. In Bamenda II Sub-Division areas like Alabukam, Ntankah, Alachu and Ntembeng experience the expansion of the town. There has been a decrease in the pattern of urban development in the western part of the city during this period due to the increasing insecurity that have been encouraging the outward migration of the population and reducing the rate of housing development. Significant rates of urban development dynamics in this area have therefore been linked to the socio-political crisis that has since 2018 been affecting the area. This has led to a decrease in the number of peri-urban investments, construction activities that has generally slowed down the developmental process in this area. The pattern of comparative rates of urban development resulting from urbanisation and urban sprawl indicates that by 2024 many previously of peri-urban villages of Ngongham, Ntarikon and Alakuma, Ntaghem and lower Futru, Mulang and Chobuh are presently urban centers .
4. Drivers of Spatio-temporal Dynamics in the Urban Development Process in Bamenda City
The patterns and trends of urban development in Bamenda City are significantly driven by a number of variables (factors). These drivers brought to focus are based on the intensity of influence and role played in determining the land use changes that results from the urban development process (Figure 6).
Demographic and socio-economic determinants are the most influential drivers od the urban development process in Bamenda City. Among these drivers, population increase has been most dominant. Highest rates are in Bamenda II (31%) and more in Bamenda I (30%) and Bamenda III (28.8%). This rate of influence from population increase is accounted for by many numerous pull factors into this area that have attracted the people from within the rural and peri-urban areas and out of the city area across the NWR into the area. This is also mostly linked to increasing insecurity situations in the peri-urban areas and rural areas of Mezam Division. This is not consistent with the findings of who emphasized on the role of land changes as a major driver of urban development but reflect the analysis of who hinged on socio-economic drivers influencing urban and peri-urban growth. The increasing population in these areas began in 2010 with the process of overcrowding in the city and sub-urbanisation caused by inner city decay in neighborhoods like Old Town, Mulang, Ndamukong and Ntamulung and Meta Quarters. The population in the quest for better housing conditions migrated out of these areas for better housing conditions leading to an increase in peri-urbanisation and urban development process. This is closely related to increasing infrastructural development. This has been very significant across the different sub divisions at almost the same rates of development. There was also an increase in land value as competition for land uses increased. This increase in land value inside the city has contributed to many people moving towards the suburbs to acquire land at relative cheaper prices. This is a major factor of peri-urban growth and increasing rural-urban linkages more dominant in Bamenda III (15.6%) and Bamenda II (12.5%).
Source: Field Survey (2024)

Download: Download full-size image

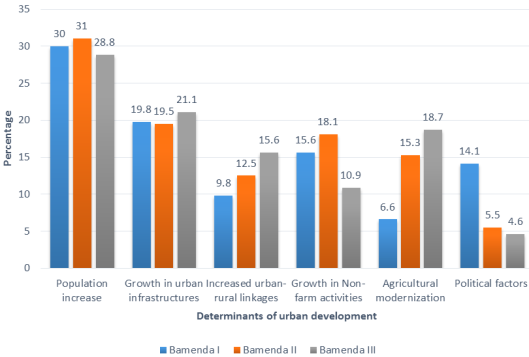
Figure 6. Drivers of urban development trends in Bamenda City.
The increase in population in Bamenda I especially since 2018 has been due to the socio-political crisis that has displaced many people to seek refuge in this area that is relatively calm. This positive net migration with origins from Bamenda Sub-Divisions within the Bamenda City, Mezam Division and out of the Division has contributed to the rapid conversion of peri-urban areas into urban areas leading to increasing urban development in Bamenda I Sub-Division. All these explains the 14.1% rate of the influence of political factors in the urban development process in Bamenda I Sub-Division. The influx of people for varied reasons have been accompanied by the provision of socio-economic infrastructure that is need d by the population especially in Bamenda I Sub-Division that has greatly increased the rate of urban development in the area. All these have greatly contributed to increasing rural-urban linkages and growth in non-farm activities as major indicator of urban development as seen more in Bamenda II (18.1%) and Bamenda I (15.6%) Municipalities.
4.1. Incidence of Spatio-temporal Population Increase in Bamenda City
The population of Bamenda city has been evolving for the past years since the creation of the Bamenda Urban area. The evolution and change of this population (positive change) have been seen in increased numbers from natural increase and net migration. The population in all the Municipalities that make up the Bamenda City have been evolving with a growth rate of 2.8% (Table 6).
Table 6. Population evolution in Bamenda city from 2005-2024.

Sub-Division

2005

2015

2024

% change between 2005 and 2024

Bamenda I

19180

59348

67778

71.7

Bamenda II

89654

312000

771704

88.3

Bamenda III

37187

241173

440422

91.6

Total

146021

612521

1279904

88.6

Source: ; Population projections (2024)
The populations of Bamenda I, II and III Municipalities have been increasing steadily over the years. The urban areas of these sub divisions in Bamenda City have since 2018 been the destination of the thousands of people displaced from many divisions in the region. This general increase in the population therefore accounts for the increasing need to increase the provision of social infrastructures to the population of the areas. This accounts for the positive percentage changes in population densities between 2005 and 2024 (Table 7).
Table 7. Spatial population densities in Bamenda city between 2005 and 2024.

Spatial unit

Surface area (km2)

Population density in persons/km2 (2005)

Population density in persons/km2 (2024)

Net pop. change (2005 & 2024)

% change

Bamenda I

110

538

616

+78

12.7

Bamenda II

165.6

541

4660

+4119

88.4

Bamenda III

22.9

1623

19232

+17609

91.6

Total

298.5

489

4287

+3798

88.6

Source: ; ; Field Projection (2024)
The evolution in population densities in Bamenda City between 2005 and 2024 across the different municipalities that make up the study area. In 2005, the total population density was 489 persons per kilometer square by 2024, the population density increased to 4287 person/ Km2. Significant changes in densities are seen Bamenda III with a net change of +17609 person/ Km2. This gives a 91.6% increase. All these as reflection of the other spatial units have been responsible for the urban development process in Bamenda City.
4.2. Evolution and Growth of Urban Social Facilities Bamenda City
The process of urban development in Bamenda City like in any other area is linked to the expansion of infrastructures. These social infrastructures are needed for the wellbeing of the city dwellers and for the rapid conversion of peri-urban areas and rural areas into urban areas. Urban infrastructural; development as a driver of urban development in Bamenda City is a structural aspect of urban expansion based on the transformation of natural land with construction land uses to reflect urban areas. The rate of expansion of the urban area into the peri-urban and sub-urban area has a direct relationship with the implantation of the different urban aspects into this area. The manifestations of the implantation of the urban features in this the peripheral areas indicates that rurbanisation begins from the core areas (Urban Bamenda) to the peripheral areas that are being transformed into these urban areas or semi-urban areas. In this area the core areas of Bamenda are educational and commercial centres from where the pattern is traced towards the peripheries. The peripheral areas affected by this process are the hinterlands far away for major commercial or areas of high population concentrations and economics hubs of the city . These social infrastructures are beneficial to the population if the provision is considered in the different sectors of development. These social infrastructures are also provided based on the population growth and the demand by the population. This study considers social infrastructures are those linked to the development of urbanisation and water quantity and quality for the urban population These sectors include: water extension facilities and sanitation, electricity, waste disposal facilities and transportation infrastructures. These infrastructures are characterized is seen in the different municipalities in the city (Table 8).
Table 8. Categories of social facilities available in the city of Bamenda.

Municipality

Transport (major streets, vehicle and bike parks)

Electricity (transformers)

Water (tanks and public taps)

Waste (disposal sites and public toilets)

Total

No

%

No

%

No

%

No

%

Bamenda I

12

16.2

13

26.5

705

12.4

22

22.4

752

Bamenda II

43

58.1

21

49

2909

51.3

56

57.1

3029

Bamenda III

19

25.7

15

30.6

2057

36.3

20

20.4

2111

Total

74

100

49

100

5671

100

98

100

5892

Source: Field work (2021); National Institute of Statistics (2023); Bamenda City Council (2023)
There are multiple urban infrastructures that have been developing and ensuring the process of urban expansion into the peripheral areas. these infrastructures are the basis of urban development in the city. The patterns of these infrastructures depict inequalities in the distribution of the different municipalities of Bamenda City. These infrastructures are considered in terms of the quantity and the influence they have in urban development and water management. Generally, the infrastructures are more in the development of water supply and extension facilities. The types of social infrastructures provided in the city of Bamenda also vary in scope and typology as the population dependence on these infrastructures also vary. This is seen in many water connection infrastructures in terms of tanks, private and public water stands and underground water development structures. On a spatial basis, Bamenda II and III Municipalities have most of these per-urban facilities infrastructures as compared to Bamenda I. the spatial dominance of Bamenda II with comparative rates of 58.1% for transportation, 49% for electricity, 51% for water and 57.1% for waste and linked to the multiple numbers of stakeholders from diverse sectors involved in the provision of these infrastructures . The rate of population expansion is also high and responsible for increasing demand on these infrastructures. This is compared to other sector infrastructures that are mostly in the hands of the state such as the road and electricity extension infrastructures. All these infrastructures are intended to accompany the increasing demands of the growing population and the need to ensure urbanization and urban sprawl which are the basis of urban development .
5. Conclusion and Recommendations
The trends of urban development have been significant in the dimensions of changes in land use/land cover and infrastructural development from the major growth poles to the peripheries over time. These changes have seen all agrarian land uses reducing as built-up land uses expand. Multiple drivers of urban development are linked to increasing population, urbanisation and urban sprawl and growth in infrastructural development that upgrades peri-urban and adjacent rural areas to urban areas. This indicative of a positive correlation between urban development and population growth. This is reflected through increasing planned developmental changes, intensification land use changes, urban gentrification and diversification of the rural economy of peri-urban Bamenda City. The general outcome has been the increase in urban development pressures with a negative implication on livelihoods and sustainability. The growth in social and economic capital in terms of socio-economic development have ushered an upward spiral in peri-urban development through agricultural intensification, promotion of economic activities and increasing non-farm activities. While urban development has led to a reduction in agrarian land sizes resulting from competition land use changes, it has also promoted the increase in land management for socio-economic prospects for planned development. This is based on increasing population growth placing pressure on urban land and facilities. All these constitute the inseparable nexus between population and urban development. The study recommends the need for controlled land use planning to mitigate the increasing over duplication of land uses and planned urban development in Bamenda City and Cameroon.
Abbreviations

NIS

National Institute of Statistics

LU/LC

Land Use/ Land Cover

DEM

Digital Elevation Model

Conflicts of Interest
The authors declare no conflicts of interest.
References
[1] Yoingco, J. (2024). Emerging sub-urban trends in 2024. Walzel Properties, LLC. 25P.
[2] Kimengsi J. N., Balgah S. N. and Achia S. N. (2017). Peri-urban land use dynamics and development implications in the Bamenda III Municipality of Cameroon. Sustainability in Environement, 2(3), 273-288.
[3] Margaritis E and Kang J (2017) Relationship between green space-related morphology and noise pollution. Ecological Indicators 72: 921–933.
[4] Akkoyunlu S. (2015). The Potential of Rural-Urban Linkages for Sustainable Development and Trade. Int. J. Sustain. Dev. World Policy. 4(8), 20–40.
[5] Rutstein, S., K. Johnson, and D. Gwatkin. 2022. Poverty, health inequality, and its health and demographic effects. Paper presented at the 2022 Annual Meeting of the Population Association of America, Los Angeles, California.
[6] Dutta, V. (2012). Land Use Dynamics and Peri-urban Growth Characteristics: Reflections on Master Plan and Urban Suitability from a Sprawling North Indian City. Environment and Urbanization Asia September 2012, 3(2), 277-301.
[7] Zorrilla-Miras, P., Palomo, I., Gómez-Baggethun, E., Martín-López, B., Lomas, P. L., & Montes, C. (2014). Effects of land-use change on wetland ecosystem services: A case study in the Doñana marshes (SW Spain). Landscape and Urban Planning, 122, 160-174.
[8] Zhao P, Lu¨ B and de Roo G (2020) Urban expansion and transportation: the impact of urban form on commuting patterns on the city fringe of Beijing. Environment and Planning A 42(10): 2467–2486.
[9] Kombe, W. J. (2003). Land use dynamics in peri-urban areas and their implications on the urban growth and form: The case of Dar es Salaam, Tanzania. Habitat International, 29(1), 113-135.
[10] Schlimmer S. (2021). Land governance in the Outskirts of Africa Cities: Socio-Economic Challenges of Growing Peri-Urban Land Markets”, Briefings de l`Ifri, July 19, 2021.
[11] Trefon T. (2009). Hinges and Fringes: Conceptualising the peri-urban in Central Africa. In F. Locatelli and P. Nugent (Eds., 2009): African Cities. Competing Claims on Urban Spaces (Leiden), 15–36.
[12] OECD (2020). Africa’s urbanisation dynamics 2020. OECD Studies on Water, OECD Publishing, Paris, 93p.
[13] Fombe L. F. And Balgah S. N. (2012) The urbanisation process in Cameroon: patterns, implications and prospects. Nova Science Inc. New York; USA.
[14] Gwan A. S. and Kimengsi J. N. (2020). Urban Expansion and the Dynamics of Farmers’ Livelihoods: Evidence from Bamenda, Cameroon Sustainability. Available at
[15] Fombe F. L. and Acha M. E (2020). Land use dynamics and variations in sprawl across the municipalities in the Bamenda Urban space from 1996-2018. Journal of sustainable development. 13(4), 224-234.
[16] Acha M. E. and Fombe L. F. (2023). Gentrification patterns, trends and development implications of the Bamenda Metropolis from 1972-2022. International Journal of Social Sciences and Management Review, 06(03), 139-153.
[17] Chirisa I. (2010). Peri urban dynamics and regional planning in Africa: Implications for healthy cities. Journal of African studies and development, 2(6), 15-26.
[18] National Institute of Statistics (2023). Regional agency for the north west 2018 Edition. 313p.
[19] National Institute of Statistics (2017). Geodata Base of Cameroon. 402p.
[20] Nyambod E. M. (2010). Environmental Consequences of Rapid Urbanization: Bamenda City. of Cameroon. Journal of environmental protection, 1, 15-23.
[21] Sietchiping, R. (2003). Geographic information systems and cellular automata based model of informal settlement growth. 257 pp. PhD Dissertation, University of Melbourne.
[22] Rukiye G. O. K. and Hatice S. C. (2023). Dynamics and land transformations on the emerging of rurban areas in Bartin, Turkey. Baltimore, MD, Johns Hopkins University Press. 210p.
[23] Ravetz, J., Fertner, C., & Nielsen, T. S. (2013). Peri-Urban Futures: Scenarios and Models For Land Use Change In Europe. In K. Nilsson, S. Pauliet, S. Bell, C. Aalbers, & T. S. Nielsen (Eds.), Remaking Cities Contradictions of the Recent Urban Environment. New York, USA and Canada: Routledge Publications.
[24] Etxebarria, A., & Astorkiza, I. (2012). Are Land Use Policies Preserving Farmland from Urban Sprawl? Review of European Studies. Response Assessment. United Nations Environmental Programme, GRID-Arendal.
[25] Ndi, H. N., Ebai, E. and Enow, O. (2017). Urbanisation and market growth trends in the Yaounde Metropolis. Journal of Geography and Geology. 6(3), 27-42.
[26] World Bank. (2022). World development report 2020: Infrastructure for Development. New York: Oxford University Press.
[27] UN-HABITAT. (2019). United Nations Human Settlements Programme (UN-Habitat) ‘A better quality of life for all in an urbanizing world’ The Strategic Plan 2020-2030.
[28] Mbanga, L. A (2018). Human settlement dynamics in the Bamenda III Municipality, North West Region, Cameroon. Center for research and urbanism, Journal of settlements and Spatial planning. 9(1), 47-58.
[29] Bureau Centrale de Recensement et d’Etude de la Population-BUCREP. (2005). Rapport de présentation des resultants définitifs. 66p.
[30] Siti A., Rio Y. M, (2023). Sociological perspectives on urban gentrification and its social implications. Journal of Current SDocial and Political Issues 1(2), 72-77.
Cite This Article
  • APA Style

    Kinyui, N. C., Niba, M. L. F., Fon, F. L. (2025). Dynamic Trends and Patterns of Urban Development in Bamenda City of Cameroon. International Journal of Sustainable Development Research, 11(1), 12-24. https://doi.org/10.11648/j.ijsdr.20251101.12

    Copy | Download

    ACS Style

    Kinyui, N. C.; Niba, M. L. F.; Fon, F. L. Dynamic Trends and Patterns of Urban Development in Bamenda City of Cameroon. Int. J. Sustain. Dev. Res. 2025, 11(1), 12-24. doi: 10.11648/j.ijsdr.20251101.12

    Copy | Download

    AMA Style

    Kinyui NC, Niba MLF, Fon FL. Dynamic Trends and Patterns of Urban Development in Bamenda City of Cameroon. Int J Sustain Dev Res. 2025;11(1):12-24. doi: 10.11648/j.ijsdr.20251101.12

    Copy | Download

  • @article{10.11648/j.ijsdr.20251101.12,
      author = {Nfor Constance Kinyui and Mary Lum Fonteh Niba and Fombe Lawrence Fon},
      title = {Dynamic Trends and Patterns of Urban Development in Bamenda City of Cameroon
    },
      journal = {International Journal of Sustainable Development Research},
      volume = {11},
      number = {1},
      pages = {12-24},
      doi = {10.11648/j.ijsdr.20251101.12},
      url = {https://doi.org/10.11648/j.ijsdr.20251101.12},
      eprint = {https://article.sciencepublishinggroup.com/pdf/10.11648.j.ijsdr.20251101.12},
      abstract = {The urban developmental process depicts transformation of the landscape through spatial changes in zones closer to towns and cities across the world. This is evident in the spatio-temporal and sectorial changes in demographic, social, economic, technological and environmental aspects. Bamenda City is experiencing rapid growth in population and continues expansion of built-up land use, resulting in the reduction of agricultural and forest lands. There is continuous haphazard densification of buildings and uncontrolled urban sprawl. The aim of this article is to examine the dynamic trends and drivers of urban development anchored on the premise that urban development trends are directly related to population growth in Bamenda City. The methodology uses historical survey and correlational designs of field investigations to administer 300 questionnaires to the target population with a spatial picture reflected on the three municipalities (Bamenda I. Bamenda II and Bamenda III) for comparative analysis. Landsat Images were processed to show the spatio-temporal changes in land uses from 2000-2024. This was complemented by field observations and secondary data sources from institutions. Findings revealed that urban development is manifested in significant increase in infrastructures (22.7%) and peri-urban growth (18.2%). The trend is increasing in spatial rates seen in Bamenda I (47%), Bamenda II (42%) and Bamenda III (45%). Farmland use has reduced from 124.36 km2 (44.6%) in 2000 to 119.17 km2 (42.7%) in 2024 while built-up land has increased from 28.16 km2 (10.1%) 62.99 km2 (22.6%) in 2024. Population increase has been most dominant driver of urban development (Bamenda II (31%), Bamenda I (30%) and Bamenda III (28.8%). This replicates an inseparable nexus between population growth and urban. The study recommends the need for controlled land use planning to mitigate the increasing duplication of land uses and planned urban development.
    },
     year = {2025}
    }
    

    Copy | Download

  • TY  - JOUR
    T1  - Dynamic Trends and Patterns of Urban Development in Bamenda City of Cameroon
    
    AU  - Nfor Constance Kinyui
    AU  - Mary Lum Fonteh Niba
    AU  - Fombe Lawrence Fon
    Y1  - 2025/02/27
    PY  - 2025
    N1  - https://doi.org/10.11648/j.ijsdr.20251101.12
    DO  - 10.11648/j.ijsdr.20251101.12
    T2  - International Journal of Sustainable Development Research
    JF  - International Journal of Sustainable Development Research
    JO  - International Journal of Sustainable Development Research
    SP  - 12
    EP  - 24
    PB  - Science Publishing Group
    SN  - 2575-1832
    UR  - https://doi.org/10.11648/j.ijsdr.20251101.12
    AB  - The urban developmental process depicts transformation of the landscape through spatial changes in zones closer to towns and cities across the world. This is evident in the spatio-temporal and sectorial changes in demographic, social, economic, technological and environmental aspects. Bamenda City is experiencing rapid growth in population and continues expansion of built-up land use, resulting in the reduction of agricultural and forest lands. There is continuous haphazard densification of buildings and uncontrolled urban sprawl. The aim of this article is to examine the dynamic trends and drivers of urban development anchored on the premise that urban development trends are directly related to population growth in Bamenda City. The methodology uses historical survey and correlational designs of field investigations to administer 300 questionnaires to the target population with a spatial picture reflected on the three municipalities (Bamenda I. Bamenda II and Bamenda III) for comparative analysis. Landsat Images were processed to show the spatio-temporal changes in land uses from 2000-2024. This was complemented by field observations and secondary data sources from institutions. Findings revealed that urban development is manifested in significant increase in infrastructures (22.7%) and peri-urban growth (18.2%). The trend is increasing in spatial rates seen in Bamenda I (47%), Bamenda II (42%) and Bamenda III (45%). Farmland use has reduced from 124.36 km2 (44.6%) in 2000 to 119.17 km2 (42.7%) in 2024 while built-up land has increased from 28.16 km2 (10.1%) 62.99 km2 (22.6%) in 2024. Population increase has been most dominant driver of urban development (Bamenda II (31%), Bamenda I (30%) and Bamenda III (28.8%). This replicates an inseparable nexus between population growth and urban. The study recommends the need for controlled land use planning to mitigate the increasing duplication of land uses and planned urban development.
    
    VL  - 11
    IS  - 1
    ER  - 

    Copy | Download

Author Information
  • Department of Geography and Planning, The University of Bamenda, Bambili, Cameroon

  • Department of Geography, Higher Teachers Training College, Bambili, Cameroon

  • Higher Institute of Transport and Logistics, The University of Bamenda, Bambili, Cameroon