Research Article | | Peer-Reviewed

Predicting the Volumetric Mix Design Properties of Pulverized Palm Fibre Reinforced Asphalt Concrete Using Response Surface Methodology

Received: 9 March 2025     Accepted: 20 March 2025     Published: 31 March 2025
Views:       Downloads:
Abstract

This study focuses on developing models to predict and optimize the volumetric mix design properties of Pulverized Palm Fiber Reinforced Asphalt Concrete (PPFRAC) using Response Surface Methodology (RSM). The primary parameters under consideration are the voids in mineral aggregate (VMA), voids in the total mixture (VTM), and voids filled with bitumen (VFB). A central composite design was used to formulate the experimental setup, and RSM coefficients were estimated using the least squares algorithm. The models were validated using T-tests and R² statistics, and optimization was performed through MATLAB. The results show that VMA values range from 16.428% to 18.785%, VTM varies from 3.058% to 5.268%, and VFB ranges from 71.956% to 84.129%. These variations align with the Marshall mix design standards for medium-traffic pavements, which recommend VMA values between 14% and 20%, VTM between 3% and 5%, and VFB between 65% and 80%, demonstrating a balanced binder and aggregate mix. The developed RSMs for VMA, VTM, and VFB demonstrated high predictive accuracy with R² values of 80.18%, 78.82%, and 77.72%, respectively. Optimization using MATLAB’s fmincon solver yielded the optimal proportions of sand (33.347%), stone dust (3.479%), bitumen (5.779%), and PPF (0.125%), resulting in a VMA of 17.12%, VTM of 3.47%, and VFB of 81.12%, all of which meet or exceed the Marshall mix design standards. These findings emphasize the effectiveness of RSM in optimizing the volumetric properties of fiber-reinforced asphalt, ensuring a well-balanced mixture that offers durability, strength, and flexibility, making it suitable for medium-traffic conditions.

Published in International Journal of Transportation Engineering and Technology (Volume 11, Issue 1)
DOI 10.11648/j.ijtet.20251101.14
Page(s) 22-35
Creative Commons

This is an Open Access article, distributed under the terms of the Creative Commons Attribution 4.0 International License (http://creativecommons.org/licenses/by/4.0/), which permits unrestricted use, distribution and reproduction in any medium or format, provided the original work is properly cited.

Copyright

Copyright © The Author(s), 2025. Published by Science Publishing Group

Keywords

Asphalt Concrete, Response Surface Methodology, Pulverized Palm Fibre, Voids in Mineral Aggregates, Voids in Total Mixture, Voids Filled With Bitumen

1. Introduction
The development of sustainable construction materials has gained significant attention due to growing concerns over environmental impact and the need for resource conservation. Asphalt concrete, one of the most commonly used materials in road construction, faces increasing pressure to incorporate alternative, environmentally friendly materials that contribute to both performance enhancement and sustainability . One such alternative is the incorporation of natural fibers, such as pulverized palm fiber (PPF), which offers promising potential to improve the mechanical properties of asphalt concrete while reducing reliance on conventional synthetic additives .
Palm oil production, a key industry in many tropical countries, generates large amounts of waste, including palm fibers. These fibers are often discarded or underutilized, leading to environmental concerns . However, research has shown that incorporating palm fibers into asphalt mixtures can significantly improve properties such as strength, durability, and resistance to cracking, which are critical for the performance of road surfaces . The benefits of incorporating such natural fibers into asphalt concrete include reduced environmental waste and the enhancement of material properties that contribute to longer-lasting road infrastructure .
Despite these promising outcomes, the process of designing asphalt concrete mixes that incorporate natural fibers like PPF is complex. It requires the careful selection and optimization of mix proportions to balance the desired mechanical performance with the fiber content. Traditionally, mix designs for asphalt concrete are derived through trial-and-error methods, which can be time-consuming and resource-intensive . In recent years, statistical and computational techniques, particularly Response Surface Methodology (RSM), have emerged as powerful tools to model and predict the relationships between mix design variables and performance outcomes . RSM is a statistical method that utilizes experimental data to develop an empirical model, which can predict the effects of various factors on the desired responses . The methodology has been applied widely to develop predictive models for a range of engineering problems, including those related to construction materials such as asphalt concrete.
In the context of asphalt mixture design, RSM has been employed to predict and optimize the performance characteristics of asphalt concrete, including its volumetric properties, stiffness, and durability. For instance, a study by Ghabban and Khalid applied RSM to optimize the mix design of asphalt concrete by considering several mix components such as binder content, aggregate type, and filler material. The results demonstrated that RSM could efficiently model the effects of these variables on the performance of the mixture, providing an optimal mix design that achieved superior mechanical properties.
Similarly, in the study by Zhao et al. , RSM was used to predict the effects of incorporating recycled materials, such as reclaimed asphalt pavement (RAP), on the performance of asphalt mixtures. The authors used RSM to analyze the interaction effects between RAP content, binder grade, and aggregate properties. The model developed provided a detailed understanding of how the variables affected the stiffness and workability of the asphalt mixture, which ultimately facilitated more sustainable asphalt mix designs. The ability of RSM to handle multi-variable interactions in a computationally efficient manner was highlighted as a key advantage.
In addition to asphalt concrete design, RSM has been utilized in other areas of civil and mechanical engineering for optimizing material properties. For example, Sabzevari et al. applied RSM to optimize the properties of concrete containing industrial by-products like fly ash and silica fume. They found that RSM was a valuable tool in predicting the compressive strength and durability of the concrete, as it allowed the consideration of multiple factors simultaneously, providing a more holistic approach to mix optimization. This study reinforced the utility of RSM in developing models that predict the performance of materials under various conditions.
Moreover, RSM has been applied in the field of asphalt modification, particularly in the optimization of asphalt binder properties with the addition of various modifiers, such as natural fibers, polymers, and nanoparticles. In their study, Ali et al. employed RSM to model the influence of polymer content on the properties of modified asphalt binders. The researchers successfully developed a model that predicted the optimal polymer content to achieve the desired rheological properties, including viscosity and elastic recovery. This study underscores RSM's ability to identify and quantify the effects of material modifiers on asphalt binder properties. In more recent studies, Sunarjono et al. studied the optimization of nano-asphalt rubber using response surface methodology. The study aimed to determine the optimal content of nanoparticles and additives in nano-asphalt rubber mixtures to enhance mechanical properties. Using a central composite design within the RSM framework, the research analyzed the impact of different variables on mixture performance. The findings showed that RSM could efficiently optimize the design of nano-asphalt rubber, leading to improved durability and performance of asphalt pavements. Zhou et al. applied the Design-Expert RSM software to predict the fatigue life of recycled asphalt mixtures. The study identified key factors affecting the fatigue performance of asphalt mixtures and used RSM to develop predictive models. The results highlighted the influence of RAP content, binder properties, and temperature on fatigue resistance. By optimizing these factors, the study contributed to the development of more durable recycled asphalt mixtures. Obaid et al. conducted a study on the prediction and optimization of asphalt mixture performance containing reclaimed asphalt pavement (RAP) materials and warm mix agents using response surface methodology (RSM). The study focused on analyzing rutting resistance and moisture susceptibility in asphalt mixtures with varying amounts of reclaimed asphalt pavement (RAP) and warm mix asphalt (WMA) additives. By employing RSM, the researchers established statistical models that could predict the optimal (RAP) content and WMA type and dosage for enhanced asphalt mixture performance. Aliyu et al. conducted a comprehensive review on the optimization of asphalt mixtures using Response Surface Methodology (RSM). The study highlighted RSM's effectiveness in modeling and optimizing both virgin and alternative materials in asphalt binders and mixtures, aiming to enhance sustainability. The authors concluded that RSM provides a broader understanding of the factors controlling pavement performance throughout its service life.
In addition to these studies, several researchers have highlighted the advantages of RSM over traditional trial-and-error methods. For instance, Zhang et al. applied RSM to predict the performance of high-performance asphalt mixtures, and their results showed that RSM-based models were more efficient and cost-effective compared to conventional methods. The statistical nature of RSM also allows for better understanding of the relationships between the factors affecting the performance of materials, thus reducing the experimental effort needed to identify optimal mix designs .
The goal of this study is to predict the volumetric mix design properties of PPF-reinforced asphalt concrete using Response Surface Methodology. By applying RSM, this research seeks to identify the optimal proportions of PPF and other mix components that yield the best performance in terms of volumetric properties such as air voids, voids in mineral aggregates (VMA), and voids filled with binder (VFB), all of which are critical indicators of asphalt concrete quality . This predictive approach not only streamlines the mix design process but also minimizes the need for extensive experimental trials, thus contributing to more efficient and cost-effective road construction practices.
The following sections discussed the principles of RSM, and the methodology employed for calibrating RSM models. The findings from this study provided valuable insights into the potential for using waste materials like PPF in sustainable asphalt pavement design.
2. Materials and Methods
2.1. Materials
The key materials used in this study include pulverized palm fibre (PPF), granite as the coarse aggregate, sand as the fine aggregate, bitumen (as the asphalt concrete binder), and stone dust as the mineral filler. The palm fibres (PF) were obtained from waste palm fronds. To extract the PPF, the palm fronds were immersed in a sodium hydroxide (NaOH) solution. The NaOH solution was prepared by dissolving 4 kg of NaOH pellets in 20 kg of water, resulting in a 20% NaOH solution. The fronds were then combined with the solution in a 1:10 ratio (1-part fronds to 10 parts NaOH solution) and left to soak for 72 hours. After soaking, the PF was easily separated from the fronds and allowed to dry for an additional 72 hours. Once dried, the PF was pulverized into lengths ranging from 6 mm to 15 mm to obtain the PPF. The granite used was well-graded, with a maximum particle size of 12.5 mm, a specific gravity of 2.77, and a fineness modulus of 3.83. The sand was also well-graded, with a specific gravity of 2.42 and a fineness modulus of 3.44. The bitumen used as the binder for coating the aggregates had a specific gravity of 1.09, a softening point of 53°C, a penetration value of 68, and a flash point of 250°C. The stone dust, serving as the mineral filler, had a specific gravity of 2.53.
2.2. Methods
2.2.1. Response Surface Design of Experiment
In designing the experiment for PPFRAC using the face-centered central composite design, the optimum bitumen content (OBC) of 6.42%, determined from the preliminary analysis, was adjusted to incorporate the reinforcing agent, PPF. The granite content was maintained at a constant 57.27% (from the preliminary analysis) throughout the experiment. The PPF content was restricted to a range of 0-6% by weight of the bitumen, limiting the actual bitumen content to between 6.03% and 6.42%. Stone dust was kept within the range of 0-10% by weight of the fine sand, which consequently limited the sand content to between 32.68% and 36.31% of the PPFRAC. This resulted in the PPF content ranging from 0 to 0.39% by weight of PPFRAC, and the stone dust content ranging from 0 to 3.63% by weight of PPFRAC. Based on the selected mixture proportions, the lower and upper bounds for the different materials are outlined in Table 1. The Minitab software generated 31 different combinations of bitumen, PPF, sand, and stone dust, as shown in Table 2.
Table 1. Upper and Lower Bounds for CCD of PPFRAC.

Constraints

Factors/components

Bitumen (%)

PPF (%)

Sand (%)

Stone dust (%)

Lower bound

6.03

0

32.68

0

Upper bound

6.42

0.39

36.31

3.63

Table 2. Central Composite Design for PPFRAC.

Run Order

Sand

Stone dust

Bitumen

PPF

1

34.50

1.82

6.22

0.20

2

36.31

0.00

6.42

0.00

3

34.50

1.82

6.23

0.19

4

36.31

0.00

6.42

0.00

5

36.31

0.00

6.05

0.37

6

33.01

3.30

6.05

0.37

7

34.50

1.82

6.22

0.20

8

33.01

3.30

6.42

0.00

9

36.31

0.00

6.22

0.20

10

34.50

1.82

6.04

0.38

11

36.31

0.00

6.42

0.00

12

32.85

3.46

6.22

0.20

13

36.31

0.00

6.03

0.39

14

34.58

1.73

6.22

0.20

15

32.68

3.63

6.03

0.39

16

32.68

3.63

6.42

0.00

17

34.50

1.82

6.22

0.20

18

34.50

1.82

6.22

0.20

19

33.01

3.30

6.42

0.00

20

36.31

0.00

6.03

0.39

21

34.50

1.82

6.22

0.20

22

34.40

1.91

6.22

0.20

23

34.50

1.82

6.22

0.20

24

34.50

1.82

6.22

0.20

25

32.68

3.63

6.42

0.00

26

32.68

3.63

6.05

0.37

27

36.31

0.00

6.42

0.00

28

36.31

0.00

6.05

0.37

29

33.01

3.30

6.03

0.39

30

34.50

1.82

6.42

0.00

31

34.50

1.82

6.22

0.20

2.2.2. Experimental Analysis of Volumetric Properties of PPFRAC
(i). Production of PPFRAC Samples
During the preparation of the PPFRAC samples, the aggregates were heated to 160°C according to the proportions in Table 2, while the PPF-modified bitumen was heated to 120°C. The heated aggregates and bitumen were then mixed thoroughly at 160°C until a uniform mixture was formed. This mixture was placed into a preheated mold and compacted with a rammer, applying 50 blows (appropriate for medium traffic conditions) on each side, at a compaction temperature of 140°C.
(ii). Volumetric Properties Determination of PPFRAC
The void parameters of the compacted PPFRAC specimen, including the percent of voids in compacted mineral aggregate (VMA), voids in the total mixture (VTM), and the percentage of air voids filled with bitumen (VFB), were determined from the density void analysis. VMA was determined using Equation (1), VTM was calculated using Equation (2) and VFB was determined using Equation (3).
VMA=100- Gbcm* PtaGbam(1)
Pav=Gmm- GbcmGmm X 100 (2)
VFB= VMA- PavVMA X 100(3)
Where, Pta represent the aggregate percent by weight of PPFRAC,
Gbcm represents the bulk specific gravity of the PPFRAC,
Gbam represents the bulk specific gravity of the aggregate in PPFRAC, and
Gmm represents the maximum specific gravity of PPFRAC
The specific gravities, Gbcm, Gbam and Gmm were calculated using Equations (4), (5) and (6) respectively;
Gbcm= WaWa- Ww(4)
Gbam= Pca+ Pfa+PsdPcaGbca+ PfaGbfa+PsdGbsd(5)
Gmm= Pca+ Pfa+Psd Pb+PppfPcaGbca+ PfaGbfa+PsdGbsd +PbGb+PppfGbppf(6)
Where Wa and Ww represent the weight of the compacted specimen in air and water, respectively, Pca, Pfa, Pb, Psd, and Pppf denote the percentage by weight of granite, river sand, bitumen, stone dust, and PPF in the PPFRAC mixture, respectively. Gbca, Gbfa, Gbsd, Gb, and Gbppf represent the bulk specific gravities of granite, river sand, stone dust, bitumen, and PPF, respectively.
2.2.3. Response Surface Model Concept
The CCD processes the experiment results and yields a response model in the form of Equation (7).
Y=f z1,  z2,  z3, ..zn ±e(7)
Where; Y = response of the experiment, zi = the independent variables, e = the experimental error
The function, f, is unknown and could be complex, depending on the relationship between the variables and the response. As a result, RSM seeks to determine an appropriate polynomial relationship between the variables and the response surface (i.e., the best-fit surface). In certain situations, a higher-order polynomial, like a quadratic model, may be used, and Equation (8) becomes;
Y= β0 + i=1n(βizi)+ i=1n(βiizi2)+ i=1nj=1n(βijzizj)+e(8)
Where,
β₀ represents a constant, βᵢ is the linear coefficient, βᵢᵢ is the quadratic coefficient, and βij is the interaction coefficient. From the resulting mathematical model, the variable combinations (i.e., ingredient proportions) that yield optimal performance can be identified. For a four-factor design, Equation (8) according to the RSM, becomes;
Y= β0+β1z1+β2z2+ β3z3+ β4z4+β11 z12+β22z22+β33z32+β44z42
+β12z1z2+β13z1z3+β14z1z4+β23z2z3+β24z2z4+β34z3z4  (9)
Where,
Y = response, or volumetric mix design property of PPFRAC
z1 = proportion of sand in the PPFRAC
z2 = proportion of stone dust in the PPFRAC
z3 = proportion of bitumen in the PPFRAC
z4 = proportion of PPF in the PPFRAC
The design matrix or shape function, Z for a second-order polynomial model as that of Equation (9) for p number independent variables, is defined as;
Z= 1z11z12.z1pz112z122.z1p2z11z12.z1p-1z1p1z21z22.z2pz212z222.z2p2z21z22.z2p-1z2p........................1zn1zn2.znpzn12zn22.znp2zn1zn2.znp-1znp(10)
In matrix form, Equation (10), becomes;
Y=+e(11)
Where β is the vector of unknown coefficients (including linear, quadratic and interaction terms. The least square method minimizes the sum of squared residuals;
Sβ= ǁY-ǁ2= (Y-)T(Y-)(12)
By expansion,
Sβ= YTY-2YT+βTZT(13)
To minimize Sβ, differentiate Equation (13) and set the derivative to zero.
δSβδβ= -2ZTY+2ZT=0(14)
Thus, by simplification and solving for 𝛽, Equation (14), becomes,
β= (ZTZ)-1ZTY(15)
Equation (15) presents the formula for estimating the model coefficients of Equation (9).
2.2.4. Validation and Verification of RSMs
RSMs were evaluated for adequacy using a T-test analysis at 5% significance level. For model validation, the following hypotheses were tested:
1) Null Hypothesis (H₀): There is no significant difference between the experimental (observed) responses and the predicted (expected) responses.
2) Alternative Hypothesis (H₁): There is a significant difference between the experimental (observed) responses and the predicted (expected) responses.
Additionally, all RSMs were also assessed using 𝑅2 statistics to verify their performance.
2.2.5. Optimization of PPFRAC Volumetric Mix Design Performance
The fmincon solver in MATLAB was used to optimize the volumetric mix design properties of PPFRAC. The volumetric properties, such as VMA, VTM, and VFB, were initially optimized individually. In the optimization process, VMA and VTM were minimized according to the Marshall Mix design criteria, while VFB was maximized. The average mix proportions derived from the individual response optimizations were then calculated and selected as the final optimal proportions for PPFRAC, based on its volumetric properties.
3. Results and Discussion
3.1. Volumetric Properties of PPFRAC
Table 3 shows the volumetric properties of PPFRAC that were considered in the study. The data reveals that the voids in mineral aggregate (VMA) range from 16.428% to 18.785%. The lowest VMA value, 16.428%, is found at run order 16, while the highest value, 18.785%, is observed at run order 13. Similarly, the voids in the total mixture (VTM) vary between a minimum of 3.058% at run order 2 and a maximum of 5.268% at run order 20. Regarding voids filled with bitumen (VFB), the lowest recorded value is 71.956% at run order 13, and the highest value is 84.129%. These variations illustrate the impact of different experimental conditions on the void properties of PPFRAC.
The void properties of PPFRAC play a crucial role in determining its durability and performance. According to the Marshall mix design criteria, the voids in mineral aggregate (VMA) should typically fall within the range of 14% to 20% for asphalt mixtures used in medium traffic conditions . The observed VMA values in Table 3, ranging from 16.428% to 18.785%, conform to this requirement, indicating an appropriate balance of aggregate gradation and binder content. A higher VMA, as observed in run order 13 (18.785%), can contribute to enhanced asphalt binder absorption, improving durability . The voids in the total mixture (VTM) values, which range from 3.058% to 5.268%, are critical for ensuring adequate air voids to accommodate traffic-induced compaction and prevent premature rutting. The Marshall mix design typically recommends a VTM of 3% to 5% for medium traffic pavements , suggesting that most of the observed values are within the acceptable limits. The voids filled with bitumen (VFB) values, ranging from 71.956% to 84.129%, align well with the recommended 65% to 80% range , ensuring a balance between sufficient binder content and resistance to deformation. These findings highlight the influence of experimental conditions on the void properties, ultimately affecting the performance of PPFRAC in service.
Table 3. Volumetric Properties of PPFRAC Samples.

Run order

Z1 = Sand

Z2 = Stone dust

Z3 = Bitumen

Z4 = Palm Fibre

VMA (%)

VTM (%)

VFB (%)

1

34.495

1.815

6.225

0.195

17.380

3.671

78.878

2

32.68

0

6.42

0

16.793

3.058

81.793

3

34.495

1.815

6.42

0.195

17.159

3.416

80.093

4

36.31

0

6.42

0

16.816

3.084

81.662

5

36.31

0

6.42

0.39

18.551

5.001

73.044

6

36.31

3.63

6.42

0.39

17.519

3.774

78.459

7

34.495

1.815

6.03

0.195

17.377

3.667

78.895

8

36.31

3.63

6.42

0

16.731

2.962

82.296

9

34.495

0

6.225

0.195

17.110

3.369

80.309

10

34.495

1.815

6.225

0.39

18.607

5.051

72.856

11

32.68

0

6.03

0

16.793

3.058

81.793

12

34.495

3.63

6.225

0.195

17.853

4.211

76.411

13

32.68

0

6.03

0.39

18.785

5.268

71.956

14

36.31

1.815

6.225

0.195

17.982

4.374

75.676

15

32.68

3.63

6.03

0.39

17.819

4.116

76.902

16

32.68

3.63

6.03

0

16.428

2.607

84.129

17

34.495

1.815

6.225

0.195

17.380

3.671

78.878

18

34.495

1.815

6.225

0.195

17.377

3.667

78.895

19

36.31

3.63

6.03

0

16.731

2.962

82.296

20

36.31

0

6.03

0.39

18.785

5.268

71.956

21

34.495

1.815

6.225

0.195

17.377

3.667

78.895

22

32.68

1.815

6.225

0.195

18.149

4.567

74.837

23

34.495

1.815

6.225

0.195

17.377

3.667

78.895

24

34.495

1.815

6.225

0.195

17.380

3.671

78.878

25

32.68

3.63

6.42

0

18.418

4.925

73.258

26

32.68

3.63

6.42

0.39

17.667

3.945

77.673

27

36.31

0

6.03

0

16.793

3.058

81.793

28

32.68

0

6.42

0.39

18.551

5.001

73.044

29

36.31

3.63

6.03

0.39

17.675

3.951

77.649

30

34.495

1.815

6.225

0

18.246

4.738

74.033

31

34.495

1.815

6.225

0.195

17.377

3.667

78.895

3.2. Response Surface Models (RSMs) for Predicting and Optimizing the Volumetric Properties of PPFRAC
3.2.1. RSM for Predicting and Optimizing the VMA of PPFRAC
Figure 1 presents table solutions of (ZTZ)-1 and (ZTY) components of Equation (15), where Y, here represents the VMA (%) of PPFRAC. On application of Equation (15), the coefficients of RSM for predicting the VMA of PPFRAC is determined and Equation (16) subsequently derived as the predictive model. Figure 2 presents the T-statistics used to validate the response surface model for predicting the Voids in Mineral Aggregate (VMA) of PPFRAC at a 5% significance level. The analysis yields a T-value of 1.19E-06, which is significantly lower than the T-critical value of 1.671, and a P-value of 0.5, which is much higher than the significance level (α = 0.05). These results indicate that the model coefficients are adequate, reinforcing the reliability of Equation (16) for VMA prediction. Furthermore, Figure 3 presents the verification statistics for the model, showing an R² value of 80.18%. This implies that the model accounts for over 80% of the variability in VMA within the defined design space, demonstrating its effectiveness in predicting VMA for PPFRAC. By application of MATLAB for minimization of VMA, the optimal component proportions expressed in Equation (17) were obtained with a minimized VMA of 16.518%. By adjusting the proportions to ensure the remaining components total 42.73%, while keeping the granite proportion unchanged at 57.27%, the revised proportions are: sand (Z₁) at 33.353%, stone dust (Z₂) at 3.478%, bitumen (Z₃) at 5.777%, and PPF (Z₄) at 0.122%.
VMAPPFRAC= -518.585-3.240z1-0.756z2+ 189.747z3+ 20.219z4+0.078 z12-0.099z22-14.236z32+
16.242z42-0.032z1z2-0.348z1z3+0.189z1z4+0.376z2z3-0.901z2z4-4.583z3z4(16)
Zopt= Sand proportion, Z1=34.812 Stone dust proportion, Z2=3.630Bitumen proportion, Z3=6.030PPF proportion, Z4=0.127(17)
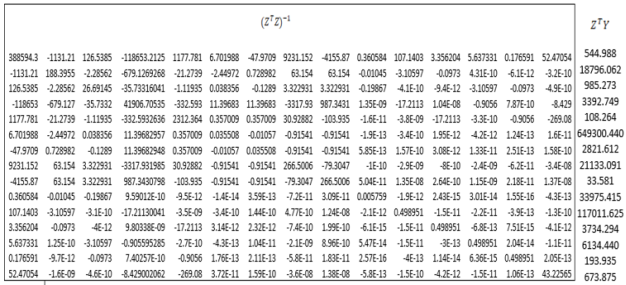
Figure 1. (ZTZ)-1 and (ZTY) Components for Predicting VMA of PPFRAC; Y is VMA (%).
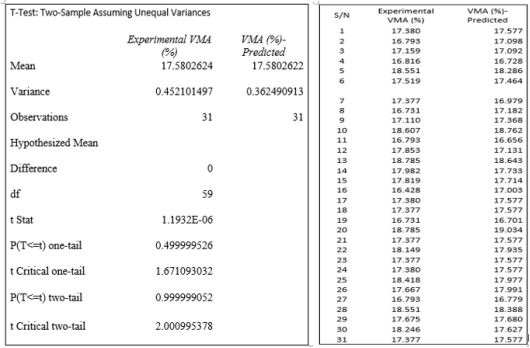
Figure 2. T-Test for PPFRAC VMA Model Validation.
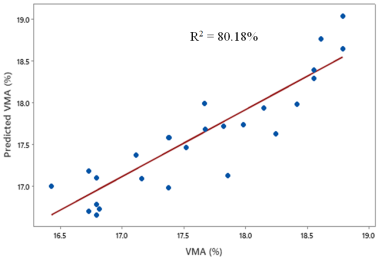
Figure 3. Verification of PPFRAC VMA Model Using R2 Statistics.
3.2.2. RSM for Predicting and Optimizing the VTM of PPFRAC
Figure 4 presents table solutions of (ZTZ)-1 and (ZTY) components of Equation (15), where Y, here represents the VTM (%) of PPFRAC. On application of Equation (15), the coefficients of RSM for predicting the VTM of PPFRAC is determined and Equation (18) subsequently derived as the predictive model. Figure 5 presents the T-statistics used to validate the response surface model for predicting the VTM of PPFRAC at a 5% significance level. The analysis yields a T-value of 1.08E-07, which is significantly lower than the T-critical value of 1.671, and a P-value of 0.5, which is much higher than the significance level (α = 0.05). These results indicate that the model coefficients are adequate, reinforcing the reliability of Equation (18) for VTM prediction. Furthermore, Figure 6 presents the verification statistics for the model, showing an R² value of 78.82%. This implies that the model accounts for over 78% of the variability in VTM within the defined design space, demonstrating its effectiveness in predicting VTM for PPFRAC. By application of MATLAB for minimization of VTM, the optimal component proportions expressed in Equation (19) were obtained with a minimized VTM of 2.802%. By adjusting the proportions to ensure the remaining components total 42.73%, while keeping the granite proportion unchanged at 57.27%, the revised proportions are: sand (Z₁) at 33.333%, stone dust (Z₂) at 3.482%, bitumen (Z₃) at 5.785%, and PPF (Z₄) at 0.130%.
VTMPPFRAC= -620.109-3.771z1-0.893z2+ 220.862z3+ 23.034z4+0.091 z12-0.116z22-16.569z32+
19.006z42-0.037z1z2-0.406z1z3+0.220z1z4+0.438z2z3-1.051z2z4-5.304z3z4(18)
Zopt= Sand proportion, Z1=34.747 Stone dust proportion, Z2=3.630Bitumen proportion, Z3=6.030PPF proportion, Z4=0.135(19)
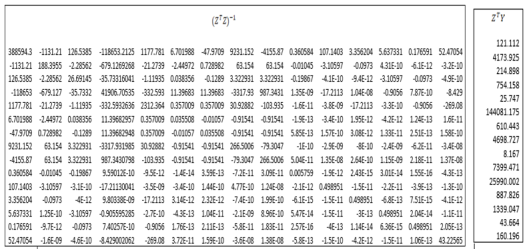
Figure 4. (ZTZ)-1 and (ZTY) Components for Predicting VTM of PPFRAC; Y is VTM (%).
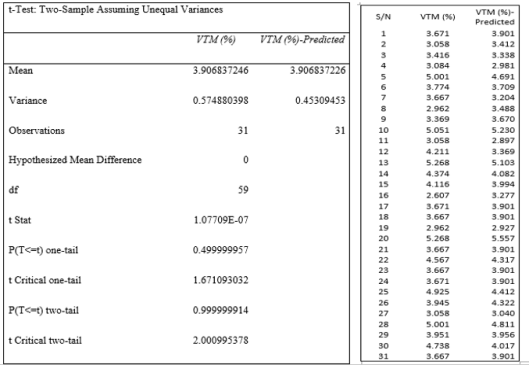
Figure 5. T-Test for PPFRAC VTM Model Validation.
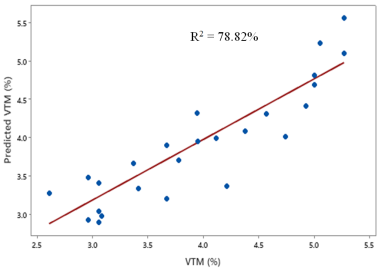
Figure 6. Verification of VTM of PPFRAC Model Using R2 Statistics.
3.2.3. RSM for Predicting and Optimizing the VFB of PPFRAC
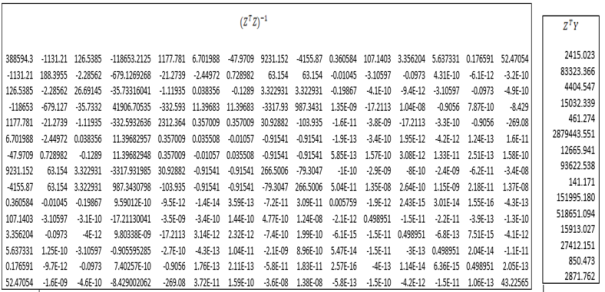
Figure 7. (ZTZ)-1 and (ZTY) Components for Predicting VFB of PPFRAC; Y is VFB (%).
Figure 7 presents table solutions of (ZTZ)-1 and (ZTY) components of Equation (15), where Y, here represents the VFB (%) of PPFRAC. On application of Equation (15), the coefficients of RSM for predicting the VFB of PPFRAC is determined and Equation (20) subsequently derived as the predictive model. Figure 8 presents the T-statistics used to validate the response surface model for predicting the VFB of PPFRAC at a 5% significance level. The analysis yields a T-value of 3.748E-07, which is significantly lower than the T-critical value of 1.671, and a P-value of 0.5, which is much higher than the significance level (α = 0.05). These results indicate that the model coefficients are adequate, reinforcing the reliability of Equation (20) for VFB prediction. Furthermore, Figure 9 presents the verification statistics for the model, showing an R² value of 77.72%. This implies that the model accounts for over 77% of the variability in VFB within the defined design space, demonstrating its effectiveness in predicting VFB for PPFRAC. By application of MATLAB for minimization of VFB, the optimal component proportions expressed in Equation (21) were obtained with a minimized VFB of 84.223%. By adjusting the proportions to ensure the remaining components total 42.73%, while keeping the granite proportion unchanged at 57.27%, the revised proportions are: sand (Z₁) at 33.354%, stone dust (Z₂) at 3.477%, bitumen (Z₃) at 5.776%, and PPF (Z₄) at 0.124%.
VFBPPFRAC= 2951.081+16.660z1+4.203z2-1012.863z3-107.151z4-0.411 z12+0.531z22+75.853z32-
83.233z42+0.168z1z2+1.904z1z3-0.979z1z4-2.002z2z3+4.546z2z4+24.259z3z4(20)
Zopt= Sand proportion, Z1=34.823 Stone dust proportion, Z2=3.630Bitumen proportion, Z3=6.030PPF proportion, Z4=0.129(21)
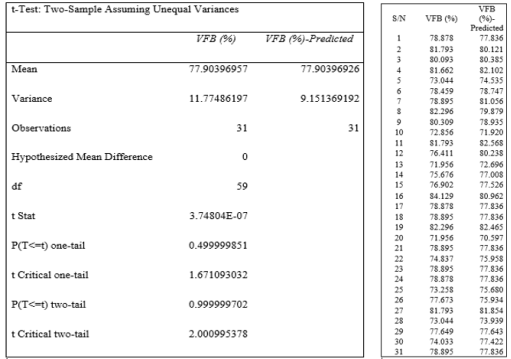
Figure 8. T-Test for PPFRAC VFB Model Validation.
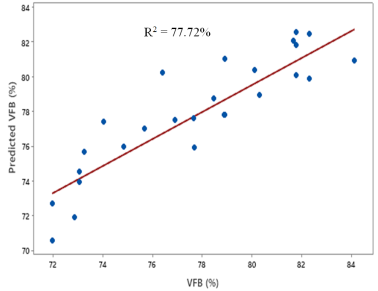
Figure 9. Verification of VFB of PPFRAC Model Using R2 Statistics.
3.2.4. Optimal Proportion of PPFRAC for Maximum Performance in terms of Volumetric Properties
The optimum proportions of the components of PPFRAC, considering all volumetric properties concurrently, were determined as the average of all the proportions derived from the single-objective optimizations. This optimized component proportion is presented by Equation (22). This combination results in the following properties: VMA of 17.12%, VTM of 3.47%, and VFB of 81.12%. By adjusting the proportions to ensure the remaining components total 42.73%, while keeping the granite proportion unchanged at 57.27%, the revised proportions are: sand (Z₁) at 33.347%, stone dust (Z₂) at 3.479%, bitumen (Z₃) at 5.779%, and PPF (Z₄) at 0.125%. The resulting optimized proportions were sand at 33.347%, stone dust at 3.479%, bitumen at 5.779%, and PPF at 0.125%. These proportions yielded a VMA of 17.12%, VTM of 3.47%, and VFB of 81.12%. These values meet or exceed the required Marshall mix design standards, validating the effectiveness of the optimization approach (Roberts et al., 1996). The optimization of PPFRAC using the MATLAB fmincon solver successfully improved critical Marshall mix design properties, ensuring an optimal balance between durability, strength, and flexibility. The results demonstrate that fiber-reinforced asphalt can be effectively engineered to meet medium traffic conditions, contributing to prolonged pavement lifespan and enhanced performance.
Zopt*= Sand proportion, Z1*=34.794 Stone dust proportion, Z2*=3.630Bitumen proportion, Z3*=6.030PPF proportion, Z4*=0.130(22)
4. Conclusion
The study observed that the voids in mineral aggregate (VMA), voids in total mixture (VTM), and voids filled with bitumen (VFB) of PPFRAC varied within acceptable limits, which aligns with the Marshall mix design criteria. VMA values ranged from 16.428% to 18.785%, VTM values varied between 3.058% and 5.268%, and VFB ranged from 71.956% to 84.129%. These variations reflect the influence of different experimental conditions on the void properties.
The observed VMA, VTM, and VFB values met the criteria for medium traffic conditions. Specifically, VMA values conformed to the desired range of 14% to 20%, VTM was within 3% to 5%, and VFB fell within the recommended 65% to 80%. These parameters indicate a suitable balance of binder and aggregate, contributing to the durability and performance of PPFRAC.
The study successfully applied Response Surface Models (RSM) to predict and optimize the volumetric properties of PPFRAC. The models were validated with high R² values, demonstrating their effectiveness in predicting VMA, VTM, and VFB. The optimization results from MATLAB's fmincon solver provided optimal component proportions for achieving the best volumetric properties.
The optimal proportions derived from the RSM optimization yielded a VMA of 17.12%, VTM of 3.47%, and VFB of 81.12%. These values met or exceeded the required Marshall mix design standards, ensuring an ideal balance between durability, strength, and flexibility.
The optimized PPFRAC mixture is well-suited for medium traffic conditions, offering improved durability and performance. The results underscore the potential of fiber-reinforced asphalt mixtures in extending pavement lifespan and enhancing performance under varying traffic conditions.
Abbreviations

PPF

Pulverized Palm Fiber

RSM

Response Surface Methodology

RAP

Reclaimed Asphalt Pavement

WMA

Warm Mix Asphalt

PF

Palm Fibres

PPFRAC

Pulverized Palm Fiber Reinforced Asphalt Concrete

VMA

Voids In Mineral Aggregate

VTM

Voids In The Total Mixture

VFB

Voids Filled With Bitumen

Author Contributions
Kelly Erhiferhi Ohwerhi: Data curation, Software, Validation, Writing – review & editing
Awajigbana Tugwell Owo: Conceptualization, Investigation, Methodology, Visualization, Writing – original draft
Chukwuemeka Nwaobakata: Supervision
Dennis Budu Eme: Supervision
Conflicts of Interest
The authors declare no conflicts of interest.
References
[1] Xu, M., Wang, X., & Zhang, Y. (2021). Sustainable asphalt pavements: Challenges and opportunities. Construction and Building Materials, 307, 124885.
[2] Khalid, A., & Ghabban, R. A. (2020). Enhancement of asphalt concrete properties using natural fibers: A review. Journal of Civil Engineering and Management, 26(8), 765-776.
[3] Azevedo, S. G., Silva, A. M., & Gomes, M. A. (2018). Palm fibers as a sustainable material for reinforcing asphalt mixtures. Journal of Cleaner Production, 180, 773-784.
[4] Ali, M. K., Murali, G., & Dharmaraj, T. (2019). Experimental investigation on the performance of palm fiber modified asphalt concrete. Construction and Building Materials, 213, 594-603.
[5] Abdullah, M. M. A. B., Shafigh, P., & Mahmood, M. (2017). Utilization of palm oil fuel ash and palm fiber in the modification of asphalt binder and mix design. Construction and Building Materials, 152, 766-774.
[6] Zhao, Y., Li, X., & Wang, Z. (2020). Optimization of asphalt mix design incorporating recycled materials using response surface methodology. Construction and Building Materials, 254, 119247.
[7] Montgomery, D. C. (2017). Design and analysis of experiments (9th ed.). Wiley.
[8] Myers, R. H., & Montgomery, D. C. (2016). Response surface methodology: Process and product optimization using designed experiments (4th ed.). Wiley.
[9] Ghabban, R. A., & Khalid, A. (2019). Optimizing asphalt concrete mix design using response surface methodology. International Journal of Pavement Engineering, 20(1), 20-30.
[10] Sabzevari, M., Gholampour, A., & Khoshbakht, M. (2018). Optimization of concrete mixture containing fly ash and silica fume using response surface methodology. Construction and Building Materials, 174, 156-164.
[11] Sunarjono, S., Sutanto, M. H., Napiah, M. B., & Yaro, N. S. A. (2023). Optimization of nano-asphalt rubber using response surface method. AIP Conference Proceedings, 2772(1), 060004.
[12] Zhou, X., Liu, Y., & Zhang, Y. (2023). Application of Design-Expert response surface methodology for the prediction of fatigue life in recycled asphalt. Journal of Cleaner Production, 381, 135116.
[13] Obaid, H. A., Enieb, M., Eltwati, A., & Al-Jumaili, M. A. (2024). Prediction and optimization of asphalt mixtures performance containing reclaimed asphalt pavement materials and warm mix agents using response surface methodology. International Journal of Pavement Research and Technology, 17, 576–591.
[14] Aliyu, U., Sutanto, M. H., Napiah, M. B., & Yaro, N. S. A. (2021). Response surface methodology optimization in asphalt mixtures: A review. IntechOpen.
[15] Zhang, L., Liu, J., & Wang, Y. (2021). Optimization of high-performance asphalt mixture using response surface methodology. Construction and Building Materials, 276, 122319.
[16] Jabbar, M., & Karim, M. R. (2019). Effect of mix design parameters on the volumetric properties of asphalt concrete: A statistical approach. International Journal of Pavement Engineering, 20(1), 1-10.
[17] Roberts, F. L., Kandhal, P. S., Brown, E. R., Lee, D. Y., & Kennedy, T. W. (1996). Hot mix asphalt materials, mixture design, and construction. National Asphalt Pavement Association.
[18] Asi, I. M. (2007). Performance evaluation of SUPERPAVE and Marshall asphalt mix designs to suit Jordan climatic and traffic conditions. Construction and Building Materials, 21(8), 1732-1740.
[19] Asphalt Institute. (2007). MS-2 Asphalt Mix Design Methods. Lexington, KY: The Asphalt Institute.
Cite This Article
  • APA Style

    Ohwerhi, K. E., Owo, A. T., Nwaobakata, C., Eme, D. B. (2025). Predicting the Volumetric Mix Design Properties of Pulverized Palm Fibre Reinforced Asphalt Concrete Using Response Surface Methodology. International Journal of Transportation Engineering and Technology, 11(1), 22-35. https://doi.org/10.11648/j.ijtet.20251101.14

    Copy | Download

    ACS Style

    Ohwerhi, K. E.; Owo, A. T.; Nwaobakata, C.; Eme, D. B. Predicting the Volumetric Mix Design Properties of Pulverized Palm Fibre Reinforced Asphalt Concrete Using Response Surface Methodology. Int. J. Transp. Eng. Technol. 2025, 11(1), 22-35. doi: 10.11648/j.ijtet.20251101.14

    Copy | Download

    AMA Style

    Ohwerhi KE, Owo AT, Nwaobakata C, Eme DB. Predicting the Volumetric Mix Design Properties of Pulverized Palm Fibre Reinforced Asphalt Concrete Using Response Surface Methodology. Int J Transp Eng Technol. 2025;11(1):22-35. doi: 10.11648/j.ijtet.20251101.14

    Copy | Download

  • @article{10.11648/j.ijtet.20251101.14,
      author = {Kelly Erhiferhi Ohwerhi and Awajigbana Tugwell Owo and Chukwuemeka Nwaobakata and Dennis Budu Eme},
      title = {Predicting the Volumetric Mix Design Properties of Pulverized Palm Fibre Reinforced Asphalt Concrete Using Response Surface Methodology
    },
      journal = {International Journal of Transportation Engineering and Technology},
      volume = {11},
      number = {1},
      pages = {22-35},
      doi = {10.11648/j.ijtet.20251101.14},
      url = {https://doi.org/10.11648/j.ijtet.20251101.14},
      eprint = {https://article.sciencepublishinggroup.com/pdf/10.11648.j.ijtet.20251101.14},
      abstract = {This study focuses on developing models to predict and optimize the volumetric mix design properties of Pulverized Palm Fiber Reinforced Asphalt Concrete (PPFRAC) using Response Surface Methodology (RSM). The primary parameters under consideration are the voids in mineral aggregate (VMA), voids in the total mixture (VTM), and voids filled with bitumen (VFB). A central composite design was used to formulate the experimental setup, and RSM coefficients were estimated using the least squares algorithm. The models were validated using T-tests and R² statistics, and optimization was performed through MATLAB. The results show that VMA values range from 16.428% to 18.785%, VTM varies from 3.058% to 5.268%, and VFB ranges from 71.956% to 84.129%. These variations align with the Marshall mix design standards for medium-traffic pavements, which recommend VMA values between 14% and 20%, VTM between 3% and 5%, and VFB between 65% and 80%, demonstrating a balanced binder and aggregate mix. The developed RSMs for VMA, VTM, and VFB demonstrated high predictive accuracy with R² values of 80.18%, 78.82%, and 77.72%, respectively. Optimization using MATLAB’s fmincon solver yielded the optimal proportions of sand (33.347%), stone dust (3.479%), bitumen (5.779%), and PPF (0.125%), resulting in a VMA of 17.12%, VTM of 3.47%, and VFB of 81.12%, all of which meet or exceed the Marshall mix design standards. These findings emphasize the effectiveness of RSM in optimizing the volumetric properties of fiber-reinforced asphalt, ensuring a well-balanced mixture that offers durability, strength, and flexibility, making it suitable for medium-traffic conditions.
    },
     year = {2025}
    }
    

    Copy | Download

  • TY  - JOUR
    T1  - Predicting the Volumetric Mix Design Properties of Pulverized Palm Fibre Reinforced Asphalt Concrete Using Response Surface Methodology
    
    AU  - Kelly Erhiferhi Ohwerhi
    AU  - Awajigbana Tugwell Owo
    AU  - Chukwuemeka Nwaobakata
    AU  - Dennis Budu Eme
    Y1  - 2025/03/31
    PY  - 2025
    N1  - https://doi.org/10.11648/j.ijtet.20251101.14
    DO  - 10.11648/j.ijtet.20251101.14
    T2  - International Journal of Transportation Engineering and Technology
    JF  - International Journal of Transportation Engineering and Technology
    JO  - International Journal of Transportation Engineering and Technology
    SP  - 22
    EP  - 35
    PB  - Science Publishing Group
    SN  - 2575-1751
    UR  - https://doi.org/10.11648/j.ijtet.20251101.14
    AB  - This study focuses on developing models to predict and optimize the volumetric mix design properties of Pulverized Palm Fiber Reinforced Asphalt Concrete (PPFRAC) using Response Surface Methodology (RSM). The primary parameters under consideration are the voids in mineral aggregate (VMA), voids in the total mixture (VTM), and voids filled with bitumen (VFB). A central composite design was used to formulate the experimental setup, and RSM coefficients were estimated using the least squares algorithm. The models were validated using T-tests and R² statistics, and optimization was performed through MATLAB. The results show that VMA values range from 16.428% to 18.785%, VTM varies from 3.058% to 5.268%, and VFB ranges from 71.956% to 84.129%. These variations align with the Marshall mix design standards for medium-traffic pavements, which recommend VMA values between 14% and 20%, VTM between 3% and 5%, and VFB between 65% and 80%, demonstrating a balanced binder and aggregate mix. The developed RSMs for VMA, VTM, and VFB demonstrated high predictive accuracy with R² values of 80.18%, 78.82%, and 77.72%, respectively. Optimization using MATLAB’s fmincon solver yielded the optimal proportions of sand (33.347%), stone dust (3.479%), bitumen (5.779%), and PPF (0.125%), resulting in a VMA of 17.12%, VTM of 3.47%, and VFB of 81.12%, all of which meet or exceed the Marshall mix design standards. These findings emphasize the effectiveness of RSM in optimizing the volumetric properties of fiber-reinforced asphalt, ensuring a well-balanced mixture that offers durability, strength, and flexibility, making it suitable for medium-traffic conditions.
    
    VL  - 11
    IS  - 1
    ER  - 

    Copy | Download

Author Information
  • Department of Civil and Environmental Engineering, University of Port Harcourt, Port Harcourt, Nigeria

  • Department of Civil and Environmental Engineering, University of Port Harcourt, Port Harcourt, Nigeria

  • Department of Civil and Environmental Engineering, University of Port Harcourt, Port Harcourt, Nigeria

  • Department of Civil and Environmental Engineering, University of Port Harcourt, Port Harcourt, Nigeria