Abstract
This study focused on the analysis of hot pepper value chain in West Hararghe zone with specific objectives of identifying and mapping actors and their functions along hot pepper value chain, identifying the marketing channels of hot pepper in the area, estimate the distribution of benefits of actors along the hot pepper value chain, identifying the factors that affect the supply of hot pepper to the market in the study area. Primary data were collected from 172 farmers and 44 hot pepper traders using structured questionnaires. Descriptive statistics and Econometrics models were used to analyze the collected data. Descriptive statistics results showed that the main hot pepper value chain actors in the study area are input suppliers, farmers/producers, collectors, wholesalers, processors, retailers and consumers. The study result showed that the major production constraints of hot pepper were low quality of improved seed, weed, disease pest, drought/ shortage of rainfall, cold rooftop water, lack of chemicals and lack of access to extension services. On marketing side, low price of product, illegal traders, unfair weighing and lack of legal action on illegal traders were the major problems. About 61.05% of the quantity of hot pepper supplied to market goes outside of the zone. The highest gross marketing of producers was 96.13% (channel 2) which was followed by 90.48% (channel 5). The multiple linear regression model result indicated that age, sex and education were the significant variable that affected quantity of hot pepper supplied to market positively, whereas distance to market, disease and drought affected significantly and negatively. Therefore, policies aiming at increasing farmer’s awareness of producing value added hot pepper produce and increasing quantity supplied to market are recommended to strengthen chain development.
|
Published in
|
Innovation (Volume 5, Issue 4)
|
|
DOI
|
10.11648/j.innov.20240504.14
|
|
Page(s)
|
132-140 |
|
Creative Commons
|

This is an Open Access article, distributed under the terms of the Creative Commons Attribution 4.0 International License (http://creativecommons.org/licenses/by/4.0/), which permits unrestricted use, distribution and reproduction in any medium or format, provided the original work is properly cited.
|
|
Copyright
|
Copyright © The Author(s), 2024. Published by Science Publishing Group
|
Keywords
Value Chain, Hot Pepper, Actors, Multiple Linear Regression Model, Market Channel
1. Introduction
Hot peppers are the most widely produced spice that adds taste and color to food while also supplying vital vitamins and minerals, making them the second most important vegetable in the world after tomatoes. The primary producers are in tropical Africa (North Africa, Senegal, Nigeria, Ghana, and Kenya), tropical Asia (India, Malaysia, Thailand, Indonesia, and the Philippines), and South America (Mexico) and the Caribbean. Asia produces more than 48% of the world's pepper, with China being the top producer. China's output alone surpasses that of all European nations combined
| [15] | Rubatzky V, Yamguchi M (1997) World Vegetables. (2nd edn), International Thomson Publishing, USA, pp. 553-562. |
[15]
. The United States and Germany are the top importers of dry chilli peppers, whereas India is the top exporter, followed by China
| [5] | Berke T (2002) The Asian vegetable research and development centerpepper project. p. 1-16. Proceedings of the 16th International PepperConference. Tampico, Mexico, USA. |
[5]
.
In Ethiopia, pepper has arguably had a longer history than any other vegetable product
| [9] | EEPA (Ethiopian Export Promotion Agency). 2008. Export performance of Agricultural products, Addis Ababa, Ethiopia, Africa. |
[9]
. According to
| [6] | Central Statistical Agency. 2018. Agricultural Sample Survey Report On Private Peasant Holdings Meher Season Area and Production of Major Crops 2017 / 2018. |
[6]
, 72% of pepper production is typically for the market, with an estimated 2.8 million quintals produced nationwide during the 2013–2014 major cropping season (Meher). Dark red pepper is highly prized by Ethiopians primarily for its high level of pungency. While the green pod is eaten as a vegetable with other foods, the finely powdered, pungent result is an essential flavoring and coloring element in the popular traditional sauce "Wot." Apart from its significant contribution to Ethiopian cuisine, it also has a significant impact on the country's economy. It is a highly valuable crop for both export and domestic markets. It creates jobs for both urban and rural workers because it is a commercial and industrial crop. The spiced ground is supplied to the local market, but the primary processed product, oleoresin, is exported to various nations. Red pepper is used to extract oleoresin, which is utilized as food coloring, for export. In the nation, there is a significant demand for the deep red cultivars for processing
| [9] | EEPA (Ethiopian Export Promotion Agency). 2008. Export performance of Agricultural products, Addis Ababa, Ethiopia, Africa. |
[9]
.
Hot peppers are grown in the west Harerghe zone for both sale and consumption. An estimated 196,641.68 quintals were produced from 10,161.28 hectares during the 2017/18 main cropping season
| [8] | Cramer, G. and Jensen, W. (1982): Agricultural economics and agribusiness, 2nd Edition. McGraw Hill Book Company, USA. 222p. |
[8]
. The zone produces it and distributes it to various marketplaces. Hot pepper is often used in rural areas for ceremonial purposes as well as in everyday meals. In the zone, fluctuating seasonal circumstances limit pepper output. Consequently, there is a significant difference in its supply between the rural and urban markets. Pepper has not received enough attention, despite its importance in smallholder producers' ability to generate money in comparison to its potential in the zone. There is no work that tries to examine the entire perspective of the value chain of hot pepper in the research area, and a value chain analysis is necessary to completely comprehend and address the issue of hot pepper markets at all levels. The study area has not yet examined how and why the price of hot peppers is high for consumers or if producers profit from rising prices.
Objectives
1) To identify and map actors and their functions along hot pepper value chain
2) To identify the marketing channels of hot pepper in the area
3) To estimate the distribution of benefits of actors along the hot pepper value chain
4) To identify the factors that affect the supply of hot pepper to the market in the study area
2. Methodology
2.1. Description of the Study Areas
Table 1. Description of the study areas.
District | Location | Altitude | Rainfall | Temperature |
Daro Lebu | 434 to South East of Finfine and 115km to South of Chiro | 1350-2450 | 900-1000 | 14-26 |
Boke | 70 km to South West of Chiro | 1100-1980 | 600-800 | 15-28 |
Hawi Gudina | | | | |
Source: Survey result, 2023
2.2. Sampling Technique and Sample Size
In this study a multi-stage sampling technique was used to select hot pepper producers. In the first stage three major hot pepper producing districts were selected purposively based on their potential for hot pepper production and marketing. In the second stage, among the potential hot pepper producing kebeles that exist in each district two kebeles were selected purposively. Finally, a representative sample size of hot pepper producer households was selected using random sampling technique. According to
| [20] | Yamane, T. (1967). Statistics: an introductory analysis. |
[20]
formula was employed to determine the required sample size.
Table 2. Sample size distribution.
Districts | Kebele | Number of sample households |
Daro Lebu | Merdida | 25 |
| Milkaye | 18 |
Hawi Gudina | Ibsa | 28 |
| Tao | 28 |
Boke | Chebi | 35 |
Tokuma | 38 |
Total | | 172 |
Source: Survey results, 2023
Traders (collectors, retailers, wholesalers and processors) survey mainly participated in the hot pepper value chain were also conducted. On the basis of flow of hot pepper, main hot pepper marketing sites were selected in the study area. Hence, a purposive sampling method was used to select the traders from the markets that hot pepper passed through.
Table 3. Sample distribution of hot pepper value chain actors.
Actors | D/Lebu | H/Gudina | Boke | Habro | Odabultum | Chiro | Sub-total |
Collectors | - | 2 | 3 | - | - | - | 5 |
Retailers | 6 | 1 | 2 | 4 | 1 | 4 | 18 |
Wholesalers | 2 | - | 3 | - | 7 | - | 12 |
Processors | - | - | - | 2 | 3 | 4 | 9 |
Total | | | | | | | 44 |
Source: Survey results, 2023
2.3. Methods of Data Collection
In this study, both the primary and secondary data was used. The primary data were collected through a household survey and focused group discussions. To generate relevant secondary data on hot pepper production and marketing, data was collected from different published and unpublished sources such as: the district and zone Agriculture offices and district marketing office reports.
2.4. Method of Data Analysis
2.4.1. Descriptive Statistics Analysis
Descriptive statistics like mean, standard deviation, frequency and percentage was used in order to explain and interpret the data obtained from sampled households. The Multiple linear regression model was used to identify factors affecting quantity of hot pepper supplied to the market. The collected raw data was analyzed by using STATA ver. 13.
Value Chain Analysis
The actors and their roles along the hot pepper value chain were examined using the value chain analysis approach; claim
| [11] | Kaplinsky, R., & Morris, M. (2001). A handbook for value chain research (Vol. 113). Ottawa: IDRC. |
[11]
. The research question determines the approach to value chain analysis. As a result, this study has used two value-chain analysis facets. First, value chain analysis maps out the players involved in a product's manufacturing, distribution, processing, marketing, and consumption in a methodical manner. Second, by analyzing the chain's margins and profits, one can ascertain which actors stand to gain from greater organization support and who gains from chain participation.
Estimation of benefit distribution of actors in market chain
The difference between the farm price and the retail price is known as the marketing margin
| [8] | Cramer, G. and Jensen, W. (1982): Agricultural economics and agribusiness, 2nd Edition. McGraw Hill Book Company, USA. 222p. |
[8]
. The total gross marketing margin (TGMM), which is calculated as a percentage, is always connected to the final price that the customer pays
| [13] | Mendoza, G. (1991): A Premier on Marketing Channels and Margins. Analytical Methods in price analysis. 257-75p. |
[13]
. According to
| [14] | Mendoza, G. (1995): A primer on marketing channels and margins. Institute of American cooperation of Agriculture. La Paz, Bolivia. 275-300 pp. |
[14]
asserts that because a high marketing margin is dependent on marketing expenses as well as purchase and sale prices, it may occasionally indicate little to no profit or loss for the specific actor in the chain.
Where, TGMM is total gross marketing margin. It is useful to introduce the idea of ‘producer’s participation’, ‘farmer’s portion’, or ‘producer’s gross margin (GMMP) which is the portion of the price paid by the consumer that goes to the producer.
The producer’s margin is calculated as a difference:
Where, GMMp is the producer's share of consumer price.
Thus, the marketing margin in this study was understood as gross marketing margin
| [16] | Scott, G. J. (1995): Prices, products, and people: analyzing agricultural markets in developing countries. Lynne Rienner Publishers. |
[16]
.
2.4.2. Econometric Analysis
This method of data analysis refers to the use of different economic and statistical tools or models for testing hypothesis related to the objective of the study.
Model Specification
For studying factors affecting hot pepper market supply in the study area, multiple linear regression model was used since all sample farmers interviewed participated in supplying hot pepper to the market in 2022 production year. This model was also selected for its simplicity and practical applicability
| [10] | Greene, W. H., 2000. Econometric analysis, 4th edition. Englewood Cliffs, NJ: Prentice Hall. |
[10]
. Econometric model specification used in this study was given as below.
Where: Y was quantity of hot pepper supplied to market, X was a vector of explanatory variables, β was a vector of parameters to be estimated and U was disturbance term
Specification tests
Multicollineartity test was undertaken to test the existence of muliticollineratity problem among explanatory variables. The test result showed that the mean value of VIF was 1.61 which indicates no problem of severe multicollinearity among explanatory variables in the model. Breusch-Pagan test for heteroskedasticity was also undertaken and the result indicated that there was a problem of heteroskedasticity in the model (Prob > chi2= 0.000). Therefore, robust regression option was used to analyze and correct the heteroscedasticity problem.
3. Result and Discussions
3.1. Descriptive Analysis Results
The result of the study shows that out of the total sample households 154 (89.5%) were male while 18 (10.5%) were female. From the sampled households, 40 (23.3%) of the respondents were illiterate, 12 (7%) can read and write whereas 120 (69.8%) respondents attended formal education in the study area.
Table 4. Characteristics of respondents (categorical variables).
Variables | Frequency | Percentage |
Sex Male | 154 | 89.5 |
Female | 18 | 10.5 |
Education status | Illiterate | 40 | 23.3 |
Read and write | 12 | 7.0 |
Formal education | 120 | 69.8 |
Source: Survey results, 2023
Table 5. Characteristics of respondents (continuous variables).
Variables | Mean | SD | Min | Max |
Age of household head (years) | 35.61 | 11.14 | 17 | 69 |
Household size (number) | 6.45 | 3.50 | 1 | 15 |
Experience in hot pepper production (years) | 3.56 | 2.68 | 1 | 20 |
Price (birr/kg) | 151.55 | 29.96 | 50 | 250 |
Distance to market (km) | 28.16 | 14.38 | 3 | 70 |
Land holding size (ha) | 2.48 | 2.32 | 0.25 | 20 |
Source: Survey results, 2023
On average, the age of sample respondents was 35.61 years with standard deviation of 11.14, while the mean household size was 6.45. The maximum age for the sample hot pepper producer farmers was 69 years while the minimum was 17 years. On average, the sampled respondents have 3.56 years of experience in hot pepper cultivation with a range of 1 to 20 years. The result of the study also shows that average land holding size of households in the study area was 2.48 hectares with standard deviation of 2.32. The average distance of producer’s to travel to district market place was 28.16 km with a range of 3 km to 70 km. In the study area, the mean selling price of hot pepper by the producers was 151.55 birr per kg. The minimum and maximum selling prices of hot pepper were 50 and 250 birr per kg in the study area (
Table 5).
Major production constraints of hot pepper
In the study area, there were different factors that impede the production of hot pepper. Accordingly, the major constraints related to the production of hot pepper were identified and prioritized. Accordingly, disease and pest, drought, lack of quality improved hot pepper seed, lack of awareness on its management, lack of chemicals and lack of access to extension services were among the major production constraint in the study area.
Major marketing constraints of hot pepper
The major hot pepper marketing constraints raised by producers and traders (collectors, wholesalers, processors and retailers) were recognized and ranked in the study area. Accordingly, low price of the product, unfair weighing of buyers, interference of brokers/illegal traders, reluctance of buyers to repay money for sellers and lack of legal action on illegal bodies were the major hot pepper marketing constraints identified and prioritized in order of their importance.
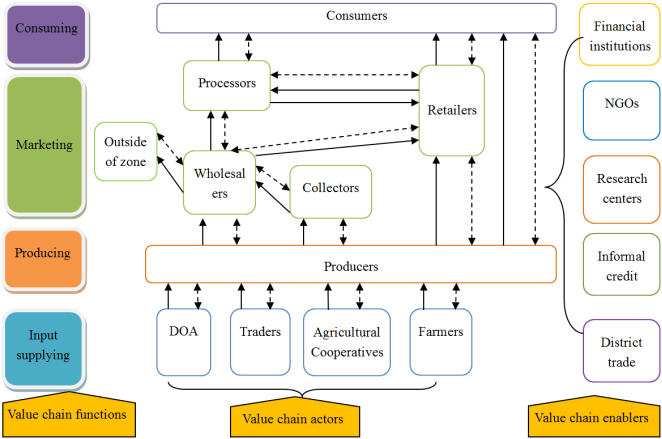
Actors in Hot Pepper Value Chain in the Study Area
The main actors of hot pepper value chain in the area were input suppliers, producers, collectors, wholesalers, retailers and processors; while supporters/ enablers were trade offices of the respective district, research centers, informal credit sources and NGOs were the main supporting actors who play a central role in the provision of supporting services like training on hot pepper production and financial services.
Value chain governance
According to
| [11] | Kaplinsky, R., & Morris, M. (2001). A handbook for value chain research (Vol. 113). Ottawa: IDRC. |
[11]
asserts that the key players in the value chain facilitate the process. They control the level of prices and the movement of commodities. They essentially control the value chain, and the majority of chain participants follow the guidelines established during the marketing process. The study result indicates that the producers and wholesalers were the key value chain governors. The consumer market was heavily dependent on producers supply and therefore the hot pepper value chains were highly influenced by the producers. Wholesaler traders in the study area usually refer to outside district markets for high price and they fix price of hot pepper from collectors and farmers. Overall, the governance of the hot pepper value chain was producers push with minimum consideration of customers need.
Value chain map of hot pepper in the study area
Value chain mapping enables to visualize the flow of the product from conception to end consumer through various actors. It also helps to identify the different actors involved in the value chain, and to understand their roles and linkages. Accordingly, the value chain map of hot pepper in West Hararghe zone was depicted as follows:
Figure 1. Map of hot pepper value chain in the study area.

Shows flow of inputs and products

Shows two way flow of information and payments
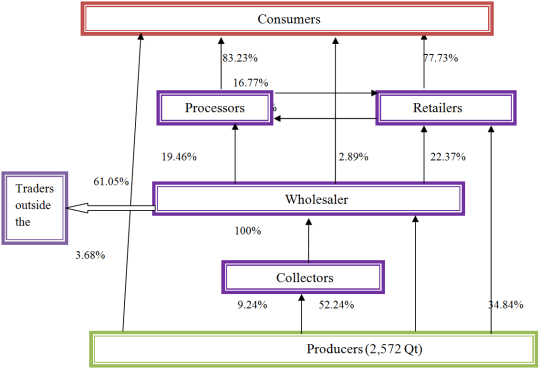
Marketing channels of hot pepper in the study area
For the value chain of hot pepper eight marketing channels were identified in the study area. The survey result indicated that out of the total amount of hot pepper supplied by farmers to the market, 61.05% go out of the zone. The major receivers of hot pepper product from producers were collectors and wholesalers. Farmers sold about 52.24% of hot pepper product to collectors and 38.84% to wholesalers. Following collectors and wholesalers, retailers are the third actors that shares 9.24% of hot pepper sold by farmers in the study area. According to the quantity of hot pepper passed through, the channel 8 was found as the dominant channel.
Figure 2. Hot pepper market channel existing in west Harerghe zone.
The eight marketing channels identified in the study area are listed as follows:
Channel 1: Producers

Consumers (3.68%)
Channel 2: Producers

Retailers

Consumers (4%)
Channel 3: Producers

Collectors

Wholesalers

Retailers

Consumers (6.64%)
Channel 4: Producers

Collectors

Wholesalers

Processors

Consumers (6.79%)
Channel 5: Producers

Wholesalers

Retailers

Consumers (5.71%)
Channel 6: Producers

Wholesalers

Processors

Retailers

Consumers (5.98%)
Channel 7: Producers

Retailers

Processors

Consumers (4.38%)
Channel 8: Producers

Collectors

Wholesalers

Outside zone (61.05%)
Marketing margins
Total gross marketing margin was the highest in channel 4 which is 43.14%. Without considering channel 1, in which farmers sell directly to consumers, producers have got the highest gross margin in channel 2 which was 96.13% and channel 5 which was 90.48%. Therefore, without considering channel 1 (producers directly sell to consumer), channel 2 was the important channel which results in the highest producers share/benefit (
Table 6 below).
Table 6. Actors marketing margins per each channels of hot pepper.
Marketing margin (birr/kg) | Ch-1 | Ch-2 | Ch-3 | Ch-4 | Ch-5 | Ch-6 | Ch-7 | Ch-8 |
TGMM | 0 | 3.87 | 16.3 | 43.14 | 9.52 | 35.34 | 42.69 | 12.41 |
GMMp | 100 | 96.13 | 83.7 | 56.86 | 90.48 | 64.66 | 57.31 | 87.59 |
GMMc | - | - | 4.7 | 2.02 | - | - | - | 6.01 |
GMMw | - | - | 6.04 | 5.28 | 5.27 | 6.8 | - | 6.4 |
GMMr | | 3.87 | 5.56 | - | 4.22 | 4.26 | 6.2 | - |
GMMpr | - | - | - | 35.87 | - | 24.28 | 36.49 | - |
3.2. Econometric Analysis Result
Factors Affecting Quantity of Hot pepper Supplied to the Market
From the 11 explanatory variables hypothesized to influence quantity of hot pepper supplied to the market (dependent variable), six (6) variables were found to significantly influence the dependent variable.
Table 7. Factors affecting quantity of hot pepper supplied to the market.
Variables | Coefficients | Robust SE | t |
Age of household head | 1.41 | 0.76 | 1.86* |
Sex of household head | 37.84 | 18.88 | 2.00** |
Education of household head | 7.34 | 2.77 | 2.64*** |
Distance from nearest market | -0.98 | 0.35 | -2.82*** |
Household size | 1.12 | 3.35 | 0.33 |
Livestock owned (TLU) | -2.93 | 3.08 | -0.95 |
Access to market information | -13.62 | 10.94 | -1.25 |
Extension contact | 4.44 | 11.32 | 0.39 |
Credit | 0.32 | 11.66 | 0.03 |
Disease and pests | -22.98 | 9.92 | -2.32** |
Drought | -19.13 | 10.47 | -1.83* |
Constant | 92.30 | 50.77 | 1.82* |
Source: Model output, 2023
Age: Age affected quantity of hot pepper supplied positively and significantly at 10% significance level. It is believed that age can serve as a proxy for experience. This may be due to aged household heads are believed to be wise in resource use, and it is expected to have a positive effect on market participation and marketable surplus. Additionally, the result indicated that as farmers have high hot pepper production experience the amount of hot pepper supplied to the market increased through its effect on hot pepper production. The study is in line with
| [2] | Abraham T. 2013. Value Chain Analysis of Vegetables: the case of Habro and Kombolcha Woredas in Oromia region, Haramaya University, Ethiopia. MSc Thesis. |
| [19] | Tshiunza, M., Lemchi, J., Tenkouano, A. 2001. Determinants of market production of cooking banana in Nigeria. ACSJ, 9(3): 537-547. |
[2, 19]
.
Sex: This variable affected the quantity of hot pepper supplied to the market significantly at 5% significance level. Male headed households have more probability of supplying hot pepper to the market. This may be due to due to a lot of obstacles such as lack of capital, less bargaining power and less access to extension services, may affect women’s participation in hot pepper production and marketing. The study agrees with the findings of
| [19] | Tshiunza, M., Lemchi, J., Tenkouano, A. 2001. Determinants of market production of cooking banana in Nigeria. ACSJ, 9(3): 537-547. |
| [18] | Toyiba Sh, Lemma Z. and Endrias G. 2014. Market chain analysis of papaya (Carica papaya): The case of Dugda District, Eastern Shewa Zone, Oromia National Regional State of Ethiopia. JAED. 3(8): 120-130. |
[19, 18]
.
Education level: Education has showed positive effect on hot pepper quantity supplied to the market with positive sign and at 1% significance level. Education has supported hot pepper farmers in the production and marketing of hot pepper in the study area. This might be due to education enable them to have better skills in hot pepper production and access to market information to increase the quantity of market supplied. This was also in line with previous studies conducted by
| [3] | Adunea D., Bezahagn A., Azeb L. and Muhammed Sh. 2019. Beef cattle value chain analysis: Evidence from West Hararghe Zone of Ethiopia. IJASFT. 5(1): 077-087. |
[3]
.
Distance to Market: It affects quantity of hot pepper supplied to the market negatively and significantly at 1% significance level. This is may be due to the reason that as the distance to the market center increases transportation cost increases, its weight decreases highly and other marketing costs increased. This is in line with
| [4] | Ayelech Tadesse. 2011. Market chain analysis of fruits for Gomma district, Jimma zone, Oromia National Regional State. M. Sc Thesis, Haramaya University, Haramaya, Ethiopia. |
[4]
.
Disease and pests: As it was expected, disease and pests occurrence affected the quantity of hot pepper to the market negatively and significantly at 5% significance level. According to
| [12] | Mekdes D., and Getachew M. (2017). Value chain Analysis of Red pepper: The case of Abeshge District, Gurage Zone, South Ethiopia. IJESNR. 2(3). |
[12]
also found that disease affected marketable supply of red pepper negatively and significantly.
Drought: The model output result indicated that drought affected the quantity of hot pepper supplied to market negatively and it was significant at 10% significance level. The might be due to agriculture is one of the most heavily impacted sectors during a drought. Drought is making it difficult for farmers to grow their hot pepper crop in the study area. The increasing drought effects on this crop were also causing the decreasing quantity of hot pepper produced and supplied to the market. This result is in line with the finding of
| [17] | Teshale W. and Getachew M. 2017. Value chain Analysis of Red pepper: The case of Abeshge District, Gurage Zone, South Ethiopia. IJESNR. |
[17]
.
4. Conclusion and Recommendations
This study was conducted with the main objective of mapping hot pepper value chain, determining the benefit share of the value chain actors and identifying the factors affecting the quantity of hot pepper supplied to the market in the study area.
A total of 172 sample respondents were interviewed using structured questionnaire to collect primary data. Additionally, wholesalers, retailers, processors, consumers and input suppliers were interviewed. Focused group discussions were also conducted. Secondary data were also collected from district agriculture office, district trade office and from published and unpublished documents. The data were analyzed using econometrics and descriptive statistical tools.
Out of the total respondents, 89.5% and 10.5% were male and female household heads respectively. The minimum and maximum age of the respondents was 17 and 69 years, respectively with mean age of 35.61 years. The average household size in the study area was 6.45. The minimum and maximum sizes of landholding size of the respondent farmers were 0.25 and 20 hectares, respectively with mean of 2.48 hectares. On average, respondents allocated 1.09 hectares of land for hot pepper production.
The main hot pepper value chain actors in the area are input suppliers, producers, collectors, wholesalers, processors, retailers and consumers. The main sources of inputs were traders, district agriculture offices, primary agricultural cooperatives and fellow farmers in the area. The survey result showed that the major sources of seed were traders covering 88.9% followed by neighbor farmers (8.2%). Fertilizer was among one of the inputs used for hot pepper production. Hot pepper farmers get fertilizer through DOA, traders and cooperatives covering 47.4%, 36.4% and 16.2%, respectively. Chemicals were supplied by private vendors found mainly in district markets.
The result of multiple regression showed that age, education and sex were found to influence the amount of hot pepper supplied to market positively and significantly. On the other hand, distance to market, disease pest and drought affected the quantity of hot pepper supplied to the market negatively and significantly in the study area.
Based on the findings of the study the following recommendations were given:
1) Establishing an early warning system and developing and disseminating disease resistant, drought tolerant and high yielding varieties is crucial in the area.
2) Increasing farmers’ skill, knowledge and awareness on the hot pepper crop management and on production of quality seed by themselves is important.
3) It is better to improve transportation road facilities and inputsdistribution networks need to be organized.
4) For the future it is better to incorporate all major areas in which hot pepper is produced and marketed for primary data.
Abbreviations
CSA | Central Statistical Agency |
DOA | District Office of Agriculture |
ha | Hectare |
km | Kilometer |
TLU | Tropical Livestock Unit |
VIF | Variance Inflation Factor |
Acknowledgments
The authors acknowledged Zonal and District Office of Agriculture and respective Development Agents at each kebeles. We are also thankful to all researchers and driver for their kindly support during data collection. Our thanks also extended to OARI and McARC for allocating budget and executing resources for the study.
Author Contributions
Gosa Alemu: Conceptualization, Data curation, Formal Analysis, Investigation, Writing–original draft
Birhanu Angasu: Conceptualization, Data curation, Investigation, Project administration, Writing–review & editing
Nimona Sime: Conceptualization, Data curation, Investigation, Writing–review & editing
Conflicts of Interest
The authors declare no conflicts of interest.
References
| [1] |
Abayneh F. 2020. Review of Potato Value Chain Performance in Ethiopia: Financial Value Addition and Margin Sharing Perspective. 6(4): 1-9.
|
| [2] |
Abraham T. 2013. Value Chain Analysis of Vegetables: the case of Habro and Kombolcha Woredas in Oromia region, Haramaya University, Ethiopia. MSc Thesis.
|
| [3] |
Adunea D., Bezahagn A., Azeb L. and Muhammed Sh. 2019. Beef cattle value chain analysis: Evidence from West Hararghe Zone of Ethiopia. IJASFT. 5(1): 077-087.
|
| [4] |
Ayelech Tadesse. 2011. Market chain analysis of fruits for Gomma district, Jimma zone, Oromia National Regional State. M. Sc Thesis, Haramaya University, Haramaya, Ethiopia.
|
| [5] |
Berke T (2002) The Asian vegetable research and development centerpepper project. p. 1-16. Proceedings of the 16th International PepperConference. Tampico, Mexico, USA.
|
| [6] |
Central Statistical Agency. 2018. Agricultural Sample Survey Report On Private Peasant Holdings Meher Season Area and Production of Major Crops 2017 / 2018.
|
| [7] |
Central Statistical Agency. 2019. Agricultural Sample Survey Report On Private Peasant Holdings Meher Season Area And Production Of Major Crops 2018 / 2019.
|
| [8] |
Cramer, G. and Jensen, W. (1982): Agricultural economics and agribusiness, 2nd Edition. McGraw Hill Book Company, USA. 222p.
|
| [9] |
EEPA (Ethiopian Export Promotion Agency). 2008. Export performance of Agricultural products, Addis Ababa, Ethiopia, Africa.
|
| [10] |
Greene, W. H., 2000. Econometric analysis, 4th edition. Englewood Cliffs, NJ: Prentice Hall.
|
| [11] |
Kaplinsky, R., & Morris, M. (2001). A handbook for value chain research (Vol. 113). Ottawa: IDRC.
|
| [12] |
Mekdes D., and Getachew M. (2017). Value chain Analysis of Red pepper: The case of Abeshge District, Gurage Zone, South Ethiopia. IJESNR. 2(3).
|
| [13] |
Mendoza, G. (1991): A Premier on Marketing Channels and Margins. Analytical Methods in price analysis. 257-75p.
|
| [14] |
Mendoza, G. (1995): A primer on marketing channels and margins. Institute of American cooperation of Agriculture. La Paz, Bolivia. 275-300 pp.
|
| [15] |
Rubatzky V, Yamguchi M (1997) World Vegetables. (2nd edn), International Thomson Publishing, USA, pp. 553-562.
|
| [16] |
Scott, G. J. (1995): Prices, products, and people: analyzing agricultural markets in developing countries. Lynne Rienner Publishers.
|
| [17] |
Teshale W. and Getachew M. 2017. Value chain Analysis of Red pepper: The case of Abeshge District, Gurage Zone, South Ethiopia. IJESNR.
|
| [18] |
Toyiba Sh, Lemma Z. and Endrias G. 2014. Market chain analysis of papaya (Carica papaya): The case of Dugda District, Eastern Shewa Zone, Oromia National Regional State of Ethiopia. JAED. 3(8): 120-130.
|
| [19] |
Tshiunza, M., Lemchi, J., Tenkouano, A. 2001. Determinants of market production of cooking banana in Nigeria. ACSJ, 9(3): 537-547.
|
| [20] |
Yamane, T. (1967). Statistics: an introductory analysis.
|
Cite This Article
-
-
@article{10.11648/j.innov.20240504.14,
  author = {Gosa Alemu and Birhanu Angasu and Nimona Sime},
  title = {Value Chain Analysis of Hot Pepper in West Hararghe Zone, Oromia National Regional State, Ethiopia
},
  journal = {Innovation},
  volume = {5},
  number = {4},
  pages = {132-140},
  doi = {10.11648/j.innov.20240504.14},
  url = {https://doi.org/10.11648/j.innov.20240504.14},
  eprint = {https://article.sciencepublishinggroup.com/pdf/10.11648.j.innov.20240504.14},
  abstract = {This study focused on the analysis of hot pepper value chain in West Hararghe zone with specific objectives of identifying and mapping actors and their functions along hot pepper value chain, identifying the marketing channels of hot pepper in the area, estimate the distribution of benefits of actors along the hot pepper value chain, identifying the factors that affect the supply of hot pepper to the market in the study area. Primary data were collected from 172 farmers and 44 hot pepper traders using structured questionnaires. Descriptive statistics and Econometrics models were used to analyze the collected data. Descriptive statistics results showed that the main hot pepper value chain actors in the study area are input suppliers, farmers/producers, collectors, wholesalers, processors, retailers and consumers. The study result showed that the major production constraints of hot pepper were low quality of improved seed, weed, disease pest, drought/ shortage of rainfall, cold rooftop water, lack of chemicals and lack of access to extension services. On marketing side, low price of product, illegal traders, unfair weighing and lack of legal action on illegal traders were the major problems. About 61.05% of the quantity of hot pepper supplied to market goes outside of the zone. The highest gross marketing of producers was 96.13% (channel 2) which was followed by 90.48% (channel 5). The multiple linear regression model result indicated that age, sex and education were the significant variable that affected quantity of hot pepper supplied to market positively, whereas distance to market, disease and drought affected significantly and negatively. Therefore, policies aiming at increasing farmer’s awareness of producing value added hot pepper produce and increasing quantity supplied to market are recommended to strengthen chain development.
},
 year = {2024}
}
 Copy
|
Copy
|
 Download
-
TY  - JOUR
T1  - Value Chain Analysis of Hot Pepper in West Hararghe Zone, Oromia National Regional State, Ethiopia

AU  - Gosa Alemu
AU  - Birhanu Angasu
AU  - Nimona Sime
Y1  - 2024/12/27
PY  - 2024
N1  - https://doi.org/10.11648/j.innov.20240504.14
DO  - 10.11648/j.innov.20240504.14
T2  - Innovation
JF  - Innovation
JO  - Innovation
SP  - 132
EP  - 140
PB  - Science Publishing Group
SN  - 2994-7138
UR  - https://doi.org/10.11648/j.innov.20240504.14
AB  - This study focused on the analysis of hot pepper value chain in West Hararghe zone with specific objectives of identifying and mapping actors and their functions along hot pepper value chain, identifying the marketing channels of hot pepper in the area, estimate the distribution of benefits of actors along the hot pepper value chain, identifying the factors that affect the supply of hot pepper to the market in the study area. Primary data were collected from 172 farmers and 44 hot pepper traders using structured questionnaires. Descriptive statistics and Econometrics models were used to analyze the collected data. Descriptive statistics results showed that the main hot pepper value chain actors in the study area are input suppliers, farmers/producers, collectors, wholesalers, processors, retailers and consumers. The study result showed that the major production constraints of hot pepper were low quality of improved seed, weed, disease pest, drought/ shortage of rainfall, cold rooftop water, lack of chemicals and lack of access to extension services. On marketing side, low price of product, illegal traders, unfair weighing and lack of legal action on illegal traders were the major problems. About 61.05% of the quantity of hot pepper supplied to market goes outside of the zone. The highest gross marketing of producers was 96.13% (channel 2) which was followed by 90.48% (channel 5). The multiple linear regression model result indicated that age, sex and education were the significant variable that affected quantity of hot pepper supplied to market positively, whereas distance to market, disease and drought affected significantly and negatively. Therefore, policies aiming at increasing farmer’s awareness of producing value added hot pepper produce and increasing quantity supplied to market are recommended to strengthen chain development.

VL  - 5
IS  - 4
ER  -
Copy
|
Download