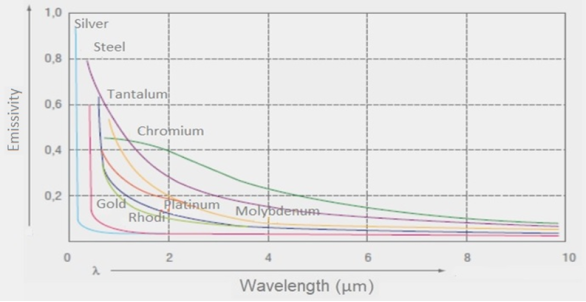
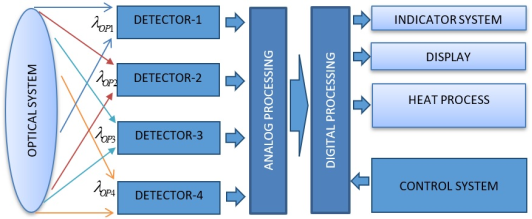
This article examines the behavior of the quadri spectral method in the design of a pyrometer applicable to the heat treatment of metals. The quadri spectral pyrometer incorporates four different optical filters that filter the four spectra to be used and converge them towards the four detectors of the device. The light energy from these spectra will be converted by the detectors into a processable electrical signal. The application of the nonlinear model known as Temperature by Nonlinear Model (TNL) will calculate and select these four wavelengths. This method applies inverse calculus, exploiting Planck's relation for thermal radiation by setting the temperature and then determining the wavelengths using ordinary least squares. With this model, the four wavelengths will be selected sequentially by modeling the emissivity of the metal as a second-degree polynomial. The obtained wavelengths will be subjected to various criteria to choose the best groups for a suitable pyrometer intended for high-temperature metal treatment. Those criteria are flux sensitivity to wavelength and temperature, standard deviation at temperature, and the minimum difference between two successive wavelengths. The various tests against the criteria, given the non-linearity of the emissivity of metals, characterize the model in high temperatures in order to proceed with such a pyrometer design.
| Published in | Journal of Electrical and Electronic Engineering (Volume 14, Issue 2) |
| DOI | 10.11648/j.jeee.20261402.14 |
| Page(s) | 99-109 |
| Creative Commons |
This is an Open Access article, distributed under the terms of the Creative Commons Attribution 4.0 International License (http://creativecommons.org/licenses/by/4.0/), which permits unrestricted use, distribution and reproduction in any medium or format, provided the original work is properly cited. |
| Copyright |
Copyright © The Author(s), 2026. Published by Science Publishing Group |
Multi Spectral Pyrometer, Wavelength, Infrared Radiation, Temperature, Metal
Near-infrared | Mid Infrared | Far infrared |
|---|---|---|
0.8μm - 2.5μm | 2.5μm - 25μm | 25μm - 1000μm |
TC [K] | Channel 1 | Channel 2 | Channel 3 | Channel 4 | ||||
|---|---|---|---|---|---|---|---|---|
[µm] | [K] | [µm] | [K] | [µm] | [K] | [µm] | [K] | |
1073.15 | 2.246 | 0.000959 | 1.535 | 0.005373 | 1.186 | 0.043606 | 0.967 | 0.461628 |
1.392 | 0.471311 | |||||||
2.000 | 0.132117 | |||||||
1.945 | 0.038898 | 1.099 | 0.128315 | |||||
1.719 | 0.484844 | |||||||
2.122 | 0.659303 | |||||||
1173.15 | 2.054 | 0.000671 | 1.403 | 0.003772 | 1.085 | 0.030674 | 0.884 | 0.323962 |
1.273 | 0.333100 | |||||||
1.896 | 0.090029 | |||||||
1.778 | 0.027332 | 1.005 | 0.090259 | |||||
1.572 | 0.340205 | |||||||
1.939 | 0.465602 | |||||||
1223.15 | 1.970 | 0.000568 | 1.346 | 0.003185 | 1.041 | 0.025831 | 0.848 | 0.272897 |
1.222 | 0.279541 | |||||||
1.821 | 0.075742 | |||||||
1.707 | 0.023056 | 0.965 | 0.075973 | |||||
1.509 | 0.287155 | |||||||
1.857 | 0.392977 | |||||||
1273.15 | 1.893 | 0.000684 | 1.294 | 0.002712 | 1 | 0.022004 | 0.815 | 0.232649 |
1.174 | 0.238138 | |||||||
1.749 | 0.064520 | |||||||
1.640 | 0.019644 | 0.900 | 0.065571 | |||||
1.449 | 0.244430 | |||||||
1.788 | 0.334194 | |||||||
1373.15 | 1.755 | 0.000357 | 1.199 | 0.002005 | 0.927 | 0.016302 | 0.756 | 0.172321 |
1.088 | 0.176781 | |||||||
1.622 | 0.047746 | |||||||
1.520 | 0.014494 | 0.855 | 0.047922 | |||||
1.343 | 0.180200 | |||||||
1.658 | 0.245986 | |||||||
Successive optimal wavelengths | Minimum difference | Maximal value |
|---|---|---|
First and second |
|
|
Second and third |
|
|
Third and forth |
|
|
TC [K] | [µm] | [K] | [%] | [µm] | [µm] |
|---|---|---|---|---|---|
1073.15 | λOP1 = 2.246 | 0.000959 | 0.000089 | λOP1 - λOP2 = 0.711 λOP2 - λOP3 = 0.349 λOP3 - λOP4 = 0.219 | λOP1 - λOP2 = 0.411 λOP2 - λOP3 = 0.192 λOP3 - λOP4 = 0.114 |
λOP2 = 1.535 | 0.005373 | 0.000501 | |||
λOP3 = 1.186 | 0.043606 | 0.004063 | |||
λOP4 = 0.967 | 0.461628 | 0.043016 | |||
1173.15 | λOP1 = 2.054 | 0.000671 | 0.000057 | λOP1 - λOP2 = 0.651 λOP2 - λOP3 = 0.318 λOP3 - λOP4 = 0.201 | λOP1 - λOP2 = 0.344 λOP2 - λOP3 = 0.160 λOP3 - λOP4 = 0.095 |
λOP2 = 1.403 | 0.003772 | 0.000321 | |||
λOP3 = 1.085 | 0.030674 | 0.002614 | |||
λOP4 = 0.884 | 0.323962 | 0.027614 | |||
1223.15 | λOP1 = 1.970 | 0.000568 | 0.000046 | λOP1 - λOP2 = 0.624 λOP2 - λOP3 = 0.305 λOP3 - λOP4 = 0.193 | λOP1 - λOP2 = 0.329 λOP2 - λOP3 = 0.154 λOP3 - λOP4 = 0.092 |
λOP2 = 1.346 | 0.003185 | 0.000260 | |||
λOP3 = 1.041 | 0.025831 | 0.002112 | |||
λOP4 = 0.848 | 0.272897 | 0.022311 | |||
1273.15 | λOP1 = 1.893 | 0.000684 | 0.000054 | λOP1 - λOP2 = 0.599 λOP2 - λOP3 = 0.294 λOP3 - λOP4 = 0.185 | λOP1 - λOP2 = 0.317 λOP2 - λOP3 = 0.148 λOP3 - λOP4 = 0.088 |
λOP2 = 1.294 | 0.002712 | 0.000213 | |||
λOP3 = 1.000 | 0.022004 | 0.001728 | |||
λOP4 = 0.815 | 0.232649 | 0.018273 | |||
1373.15 | λOP1 = 1.755 | 0.000357 | 0.000026 | λOP1 - λOP2 = 0.556 λOP2 - λOP3 = 0.272 λOP3 - λOP4 = 0.171 | λOP1 - λOP2 = 0.293 λOP2 - λOP3 = 0.119 λOP3 - λOP4 = 0.082 |
λOP2 = 1.199 | 0.002005 | 0.000146 | |||
λOP3 = 0.927 | 0.016302 | 0.001187 | |||
λOP4 = 0.756 | 0.172321 | 0.012549 |
TC [K] | λOP [µm] | Temperature for checking the standard deviation of the temperature | ||||||
|---|---|---|---|---|---|---|---|---|
975.15K | 1073.15K | 1173.15K | 1223.15K | 1273.15K | 1373.15K | 1473.15K | ||
1073.15 | λOP1 = 2.246 | 0.001459 | 0.000959 | 0.000686 | 0.000595 | 0.000524 | 0.000420 | 0.000349 |
λOP2 = 1.535 | 0.003146 | 0.001559 | 0.000884 | 0.000693 | 0.000555 | 0.000378 | 0.000273 | |
λOP3 = 1.186 | 0.011394 | 0.004336 | 0.001977 | 0.001408 | 0.001033 | 0.000600 | 0.000379 | |
λOP4 = 0.967 | 0.056348 | 0.016485 | 0.006042 | 0.003911 | 0.002627 | 0.001305 | 0.000719 | |
1173.15 | λOP1 = 2.054 | 0.001582 | 0.000982 | 0.000671 | 0.000571 | 0.000493 | 0.000382 | 0.000310 |
λOP2 = 1.403 | 0.004541 | 0.002068 | 0.001094 | 0.000832 | 0.000648 | 0.000419 | 0.000290 | |
λOP3 = 1.085 | 0.021317 | 0.007281 | 0.003035 | 0.002078 | 0.001471 | 0.000801 | 0.000478 | |
λOP4 = 0.884 | 0.138194 | 0.035367 | 0.011602 | 0.007152 | 0.004595 | 0.002106 | 0.001084 | |
1223.15 | λOP1 = 1.970 | 0.001674 | 0.001011 | 0.000675 | 0.000568 | 0.000486 | 0.000371 | 0.000296 |
λOP2 = 1.346 | 0.005532 | 0.002417 | 0.001235 | 0.000925 | 0.000711 | 0.000448 | 0.000304 | |
λOP3 = 1.041 | 0.029580 | 0.009576 | 0.003817 | 0.002564 | 0.001782 | 0.000940 | 0.000546 | |
λOP4 = 0.848 | 0.219035 | 0.052467 | 0.016292 | 0.009805 | 0.006161 | 0.002715 | 0.001351 | |
1273.15 | λOP1 = 1.893 | 0.001789 | 0.001050 | 0.000685 | 0.000571 | 0.000484 | 0.000343 | 0.000286 |
λOP2 = 1.294 | 0.006791 | 0.002847 | 0.001406 | 0.001038 | 0.000786 | 0.000484 | 0.000321 | |
λOP3 = 1.000 | 0.041610 | 0.012759 | 0.004862 | 0.003202 | 0.002185 | 0.001116 | 0.000631 | |
λOP4 = 0.815 | 0.349686 | 0.078430 | 0.023061 | 0.013551 | 0.008329 | 0.003529 | 0.001697 | |
1373.15 | λOP1 = 1.755 | 0.002101 | 0.001164 | 0.000725 | 0.000592 | 0.000492 | 0.000357 | 0.000274 |
λOP2 = 1.199 | 0.010626 | 0.004095 | 0.001886 | 0.001350 | 0.000995 | 0.000582 | 0.000370 | |
λOP3 = 0.927 | 0.084590 | 0.023272 | 0.008105 | 0.005130 | 0.003377 | 0.001616 | 0.000863 | |
λOP4 = 0.756 | 0.917752 | 0.180401 | 0.047544 | 0.026628 | 0.015659 | 0.006132 | 0.002754 | |
TC [K] | λOP [µm] | Temperature for verifying of sensitivity of the flux | ||||||
|---|---|---|---|---|---|---|---|---|
975.15K | 1073.15K | 1173.15K | 1223.15K | 1273.15K | 1373.15K | 1473.15K | ||
1073.15 | λOP1 = 2.246 | 0.006773 | 0.005576 | 0.004674 | 0.004304 | 0.003978 | 0.003429 | 0.002990 |
λOP2 = 1.535 | 0.009898 | 0.008140 | 0.006813 | 0.006268 | 0.005786 | 0.004976 | 0.004326 | |
λOP3 = 1.186 | 0.012810 | 0.010534 | 0.008815 | 0.008109 | 0.007485 | 0.006435 | 0.005591 | |
λOP4 = 0.967 | 0.015711 | 0.012919 | 0.010811 | 0.009945 | 0.009179 | 0.007891 | 0.006856 | |
1173.15 | λOP1 = 2.054 | 0.007402 | 0.006091 | 0.005102 | 0.004697 | 0.004339 | 0.003737 | 0.003255 |
λOP2 = 1.403 | 0.010829 | 0.008905 | 0.007452 | 0.006856 | 0.006328 | 0.005442 | 0.004729 | |
λOP3 = 1.085 | 0.014002 | 0.115147 | 0.009635 | 0.008863 | 0.008181 | 0.007033 | 0.006111 | |
λOP4 = 0.884 | 0.017186 | 0.014132 | 0.011826 | 0.010879 | 0.010041 | 0.008632 | 0.007500 | |
1223.15 | λOP1 = 1.970 | 0.007716 | 0.006348 | 0.005317 | 0.004894 | 0.004520 | 0.003892 | 0.003389 |
λOP2 = 1.346 | 0.011287 | 0.009282 | 0.007767 | 0.007146 | 0.006596 | 0.005671 | 0.004929 | |
λOP3 = 1.041 | 0.014594 | 0.012001 | 0.010042 | 0.009238 | 0.008527 | 0.007330 | 0.006369 | |
λOP4 = 0.848 | 0.017916 | 0.014732 | 0.012328 | 0.011341 | 0.010467 | 0.008998 | 0.007818 | |
1273.15 | λOP1 = 1.893 | 0.008029 | 0.006605 | 0.005531 | 0.005090 | 0.004701 | 0.004047 | 0.003522 |
λOP2 = 1.294 | 0.011741 | 0.009655 | 0.008079 | 0.007432 | 0.006861 | 0.005898 | 0.005126 | |
λOP3 = 1.000 | 0.015193 | 0.012493 | 0.010454 | 0.009617 | 0.008876 | 0.007631 | 0.006630 | |
λOP4 = 0.815 | 0.018641 | 0.015329 | 0.012827 | 0.011800 | 0.010891 | 0.009363 | 0.008135 | |
1373.15 | λOP1 = 1.755 | 0.008658 | 0.007122 | 0.005962 | 0.005486 | 0.005066 | 0.004359 | 0.003792 |
λOP2 = 1.199 | 0.012671 | 0.010420 | 0.008719 | 0.008021 | 0.007403 | 0.006365 | 0.005531 | |
λOP3 = 0.927 | 0.016389 | 0.013477 | 0.011277 | 0.010374 | 0.009575 | 0.008231 | 0.007152 | |
λOP4 = 0.756 | 0.020096 | 0.016525 | 0.013828 | 0.012721 | 0.011741 | 0.010093 | 0.008769 | |
TC [K] | λOP [µm] | Temperature for verifying flux of sensitivity to wavelength | ||||||
|---|---|---|---|---|---|---|---|---|
975.15K | 1073.15K | 1173.15K | 1223.15K | 1273.15K | 1373.15K | 1473.15K | ||
1073.15 | λOP1 = 2.246 | 708783 | 438419 | 215437 | 118132 | 28815.5 | -129307 | -264699 |
λOP2 = 1.535 | 3017940 | 2433730 | 1949550 | 1737360 | 1541990 | 1194490 | 894948 | |
λOP3 = 1.186 | 6295360 | 5315970 | 4503650 | 4147350 | 3819100 | 3234490 | 2729580 | |
λOP4 = 0.967 | 10640700 | 9167330 | 7945180 | 7409060 | 6915060 | 6035040 | 5274610 | |
1173.15 | λOP1 = 2.054 | 1072800 | 748273 | 480169 | 363010 | 255370 | 64539.6 | -99164.8 |
λOP2 = 1.403 | 3947540 | 3247910 | 2667830 | 2413500 | 2179270 | 1762380 | 1402700 | |
λOP3 = 1.085 | 7950900 | 6780620 | 5809910 | 5384100 | 4991770 | 4292950 | 3689210 | |
λOP4 = 0.884 | 13263700 | 11500700 | 10038200 | 9396680 | 8805530 | 7752420 | 6842330 | |
1223.15 | λOP1 = 1.970 | 1273700 | 920437 | 628392 | 500698 | 383333 | 175134 | -3618.14 |
λOP2 = 1.346 | 4446190 | 3685950 | 3055540 | 2779110 | 2524490 | 2071220 | 1680020 | |
λOP3 = 1.041 | 8840230 | 7568920 | 6514380 | 6051800 | 5624470 | 4866320 | 4210320 | |
λOP4 = 0.848 | 14664100 | 12748200 | 11158900 | 10461700 | 9819330 | 8674880 | 7685850 | |
1273.15 | λOP1 = 1.893 | 1486270 | 1103270 | 786471 | 647884 | 520461 | 294298 | 99976.3 |
λOP2 = 1.294 | 4965930 | 4143300 | 3461080 | 3161900 | 2886300 | 2395610 | 1971990 | |
λOP3 = 1.000 | 9784980 | 8407280 | 7264470 | 6763160 | 6301240 | 5478390 | 4767390 | |
λOP4 = 0.815 | 16124000 | 14049800 | 12329300 | 11574500 | 10879000 | 9639990 | 8569220 | |
1373.15 | λOP1 = 1.755 | 1952330 | 1506060 | 1136600 | 974840 | 826027 | 561657 | 334207 |
λOP2 = 1.199 | 6114380 | 5156120 | 4361330 | 4012740 | 3691580 | 3119630 | 2625670 | |
λOP3 = 0.927 | 11811500 | 10208300 | 8878370 | 8294970 | 7757400 | 6799760 | 5972200 | |
λOP4 = 0.756 | 19255100 | 16844500 | 14844900 | 13967800 | 13159500 | 11719500 | 10475000 | |
TNL | Temperature Nonlinear |
| [1] |
PhilippeHerve, JulieCedelle, IonutNegreanu, Infrared technique for simultaneous determination of temperature and emissivity,
https://www.sciencedirect.com/science/article/pii/S1350449510000721 |
| [2] |
Th. Duvaut, Comparison between multiwavelength infrared and visible pyrometry: Application to metals,
https://www.sciencedirect.com/science/article/pii/S1350449507001375 |
| [3] |
TairanFu, MinghaoDuan, JiaqiTang, ConglingShi, Measurements of the directional spectral emissivity based on a radiation heating source with alternating spectral distributions,
https://www.sciencedirect.com/science/article/pii/S001793101500784X |
| [4] | G. R. Gathers, Analysis of multiwavelength pyrometry using nonlinear chi-square fits and Monte Carlo methods, |
| [5] | Helcio R. B. Orlande, Olivier Fudym, Denis Maillet, Renato M. Cotta, Thermal Measurements and Inverse Techniques, |
| [6] | Thomas Pierre, Benjamin Rémy, Alain Degiovanni, Microscale temperature measurement by the multispectral and statistic method in the ultraviolet-visible wavelengths, |
| [7] |
M. Boivineau, G. Pottlacher, Thermophysical properties of metals at very high temperatures obtained by dynamic heating techniques: recent advances,
https://www.inderscienceonline.com/doi/pdf/10.1504/IJMPT.2006.009468 |
| [8] |
A Barlier-Salsi, Stray light correction on array spectroradiometers for optical radiation risk assessment in the workplace,
http://iopscience.iop.org/article/10.1088/0952-4746/34/4/915/meta |
| [9] | Simone MATTEÏ, Thermal radiation from opaque materials |
| [10] | Tairan Fu, Jiangfan Liu, Minghao Duan, Anzhou Zong, Temperature measurements using multicolor pyrometry in thermal radiation heating environments, |
| [11] |
Christophe Rodiet, Benjamin Rémy, Alain Degiovanni, Franck Demeurie, – Optimisation of wavelengths selection used for the multi-spectral temperature measurement by ordinary least squares method of surfaces exhibiting non-uniform emissivity,
https://www.tandfonline.com/doi/abs/10.1080/17686733.2013.812816 |
| [12] | Jian Xing, Shuang Long Cui, Yuan Dong Shi, A Iteration Processing Algorithm for Multi-Wavelength Pyrometer, |
| [13] |
V. TankH. Dietl, Multispectral infrared pyrometer for temperature measurement with automatic correction of the influence of emissivity,
https://www.sciencedirect.com/science/article/pii/0020089190900492 |
| [14] |
George Zonios, Noise and stray light characterization of a compact CCD spectrophotometer used in biomedical applications,
https://www.osapublishing.org/ao/abstract.cfm?URI=ao-49-2-163 |
| [15] |
AntónioAraújo, Dual-band pyrometry for emissivity and temperature measurements of gray surfaces at ambient temperature: The effect of pyrometer and background temperature uncertainties,
https://www.sciencedirect.com/science/article/pii/S0263224116304687 |
| [16] |
Th. Duvaut, D. Georgeault, J. L. Beaudoin, Multiwavelength infrared pyrometry: optimization and computer simulations,
https://www.sciencedirect.com/science/article/pii/1350449595000402 |
| [17] |
Christophe Rodiet, Benjamin Remy, Alain Degiovanni, Optimal wavelengths obtained from laws analogous to the Wien’s law for monospectral and bispectral methods, and general methodology for multispectral temperature measurements taking into account global transfer function including non-uniform emissivity of surfaces,
https://www.sciencedirect.com/science/article/pii/S1350449516300147 |
| [18] | C. RODIET, T. PIERRE, B. REMY et A. DEGIOVANNI, Temperature measurement by multispectral method in the infrared and ultraviolet |
| [19] | Christophe rodiet, Benjamin Remy, Thomas Pierre and Alain Degiovanni, Influence of measurement noise and number of wavelengths on the temperature measurement of opaque surface with variable emissivity by a multi-spectral method based on the flux ratio in the infrared-ultraviolet range, |
APA Style
Ezekel, R. P. (2026). Characteristics of Optimal Wavelengths Selection for High Temperature Quadrispectral Pyrometer in Near-infrared Spectral Range for Metals with Non-linear Emissivity. Journal of Electrical and Electronic Engineering, 14(2), 99-109. https://doi.org/10.11648/j.jeee.20261402.14
ACS Style
Ezekel, R. P. Characteristics of Optimal Wavelengths Selection for High Temperature Quadrispectral Pyrometer in Near-infrared Spectral Range for Metals with Non-linear Emissivity. J. Electr. Electron. Eng. 2026, 14(2), 99-109. doi: 10.11648/j.jeee.20261402.14
@article{10.11648/j.jeee.20261402.14,
  author = {Ratianarivo Paul Ezekel},
  title = {Characteristics of Optimal Wavelengths Selection for High Temperature Quadrispectral Pyrometer in Near-infrared Spectral Range for Metals with Non-linear Emissivity},
  journal = {Journal of Electrical and Electronic Engineering},
  volume = {14},
  number = {2},
  pages = {99-109},
  doi = {10.11648/j.jeee.20261402.14},
  url = {https://doi.org/10.11648/j.jeee.20261402.14},
  eprint = {https://article.sciencepublishinggroup.com/pdf/10.11648.j.jeee.20261402.14},
  abstract = {This article examines the behavior of the quadri spectral method in the design of a pyrometer applicable to the heat treatment of metals. The quadri spectral pyrometer incorporates four different optical filters that filter the four spectra to be used and converge them towards the four detectors of the device. The light energy from these spectra will be converted by the detectors into a processable electrical signal. The application of the nonlinear model known as Temperature by Nonlinear Model (TNL) will calculate and select these four wavelengths. This method applies inverse calculus, exploiting Planck's relation for thermal radiation by setting the temperature and then determining the wavelengths using ordinary least squares. With this model, the four wavelengths will be selected sequentially by modeling the emissivity of the metal as a second-degree polynomial. The obtained wavelengths will be subjected to various criteria to choose the best groups for a suitable pyrometer intended for high-temperature metal treatment. Those criteria are flux sensitivity to wavelength and temperature, standard deviation at temperature, and the minimum difference between two successive wavelengths. The various tests against the criteria, given the non-linearity of the emissivity of metals, characterize the model in high temperatures in order to proceed with such a pyrometer design.},
 year = {2026}
}
TY  - JOUR
T1  - Characteristics of Optimal Wavelengths Selection for High Temperature Quadrispectral Pyrometer in Near-infrared Spectral Range for Metals with Non-linear Emissivity
AU  - Ratianarivo Paul Ezekel
Y1  - 2026/04/13
PY  - 2026
N1  - https://doi.org/10.11648/j.jeee.20261402.14
DO  - 10.11648/j.jeee.20261402.14
T2  - Journal of Electrical and Electronic Engineering
JF  - Journal of Electrical and Electronic Engineering
JO  - Journal of Electrical and Electronic Engineering
SP  - 99
EP  - 109
PB  - Science Publishing Group
SN  - 2329-1605
UR  - https://doi.org/10.11648/j.jeee.20261402.14
AB  - This article examines the behavior of the quadri spectral method in the design of a pyrometer applicable to the heat treatment of metals. The quadri spectral pyrometer incorporates four different optical filters that filter the four spectra to be used and converge them towards the four detectors of the device. The light energy from these spectra will be converted by the detectors into a processable electrical signal. The application of the nonlinear model known as Temperature by Nonlinear Model (TNL) will calculate and select these four wavelengths. This method applies inverse calculus, exploiting Planck's relation for thermal radiation by setting the temperature and then determining the wavelengths using ordinary least squares. With this model, the four wavelengths will be selected sequentially by modeling the emissivity of the metal as a second-degree polynomial. The obtained wavelengths will be subjected to various criteria to choose the best groups for a suitable pyrometer intended for high-temperature metal treatment. Those criteria are flux sensitivity to wavelength and temperature, standard deviation at temperature, and the minimum difference between two successive wavelengths. The various tests against the criteria, given the non-linearity of the emissivity of metals, characterize the model in high temperatures in order to proceed with such a pyrometer design.
VL  - 14
IS  - 2
ER  -
Electronic Department, ESP-Antsirabe, Antsirabe, Madagascar
Biography: Ratianarivo Paul Ezekel is a Teacher at Polytechnical High School of Antsirabe, Vakinankaratra University, Electronic Engineering Department. He completed his PhD in Electronic Divices et Systems Engineering from Antananarivo University in 2018, and his Master of Engineering in Automatic Electronic Systems from Polytechnical High School of Antananarivo in 20010. Recognized for his exceptional contributions, Dr. RATIANARIVO Paul Ezekel has been known as the chef department of electronic engineering.
Research Fields: Electronic system, Instrumentation, Embedded systems, programmable system

Information