3. Results and Discussion
The author believes that the current system of reserve currency leads to high levels of risk of uncertainty for those countries that use the U. S. dollar as an anchor currency or baskets of currencies.
The U.S. dollar remains the reserve currency for the world's central banks, although there is a tendency to reduce the share of the U.S. dollar in the world central banks' assets and liability.
Gold - begins to return with a significant specific weight to the INERNATIONAL RESERVES of the world central banks.
The Federal Reserve’s actions, using the U.S. dollar as a reserve currency, contribute to numerous crises. The transmission mechanisms and transformation functions of banks lead to an unavoidable consequence: the devaluation of national currencies. This devaluation is seen as the only viable measure to preserve economic stability and maintain competitive advantages in an increasingly competitive global environment for 149 emerging markets and developing countries countries to use anchor currency or basket of currencies.
The BRICS countries will continue to find mechanisms to replace the U.S. dollar as settlements between these countries at the level of the central banks of these countries or special purpose banks that are used to setlle transactions.
The large size of the US cash dollar circulating outside the U.S. shows the power of the U.S. dollar as a reserve currency for the vast majority of the world's countries.
The key elements of the research are taken from October 06, 2021.
The International Role of the U.S. Dollar.
Bertaut, Carol C., Bastian von Beschwitz, and Stephanie E. Curcuru (2021). "The International Role of the U.S. Dollar," FEDS Notes. Washington: Board of Governors of the Federal Reserve System, October 06, 2021, https://doi.org/10.17016/2380-7172.2998
| [1] | Bertaut, Carol C., Bastian von Beschwitz, and Stephanie E. Curcuru (2021). "The International Role of the U.S. Dollar," FEDS Notes. Washington: Board of Governors of the Federal Reserve System, October 06, 2021, https://doi.org/10.17016/2380-7172.2998 |
[1]
.
For most of the last century, the preeminent role of the U.S. dollar in the global economy has been supported by the size and strength of the U.S. economy, its stability and openness to trade and capital flows, and strong property rights and the rule of law. As a result, the depth and liquidity of U.S. financial markets is unmatched, and there is a large supply of extremely safe dollar-denominated assets. This note reviews the use of the dollar in international reserves, as a currency anchor, and in transactions
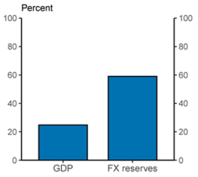
By most measures the dollar is the dominant currency and plays an outsized international role relative to the U.S. share of global GDP (see
Figure 1). That said, this dominance should not be taken for granted and the note ends with a discussion of possible challenges to the dollar's status.
Figure 1. U.S. share of world GDP vs. U.S. dollar share of international reserves.
Note: U.S. share of 2020 nominal world GDP compared to the dollar's share of globally disclosed foreign exchange reserves in 2020-Q4. At current exchange rates.
Source: IMF COFER; IMF World Economic Outlook database.
Accessible version
Figure 1 | [1] | Bertaut, Carol C., Bastian von Beschwitz, and Stephanie E. Curcuru (2021). "The International Role of the U.S. Dollar," FEDS Notes. Washington: Board of Governors of the Federal Reserve System, October 06, 2021, https://doi.org/10.17016/2380-7172.2998 |
[1]
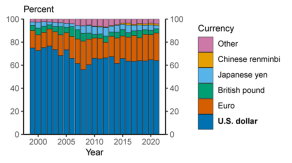
There is widespread confidence in the U.S. dollar as a store of value.
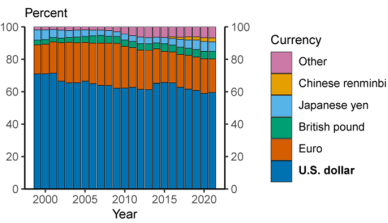
A key function of a currency is as a store of value which can be saved and retrieved in the future without a significant loss of purchasing power. One measure of confidence in a currency as a store of value is its usage in official foreign exchange reserves. As shown in
Figure 2, the dollar comprised 60 percent of globally disclosed official foreign reserves in 2021. This share has declined from 71 percent of reserves in 2000, but still far surpassed all other currencies including the euro (21 percent), Japanese yen (6 percent), British pound (5 percent), and the Chinese renminbi (2 percent). Moreover, the decline in the U.S. dollar share has been taken up by a wide range of other currencies, rather than by a single other currency. Thus, while countries have diversified their reserve holdings somewhat over the past two decades, the dollar remains by far the dominant reserve currency.
Figure 2. Foreign exchange reserves.
Note: Share of globally disclosed foreign exchange reserves. At current exchange rates. Data are annual and extend from 1999 through 2021. 2021 is 2021-Q1. Legend entries appear in graph order from top to bottom. Chinese renmimbi is 0 until 2015-Q2.
Source: IMF COFER.
Accessible version
Figure 2 | [1] | Bertaut, Carol C., Bastian von Beschwitz, and Stephanie E. Curcuru (2021). "The International Role of the U.S. Dollar," FEDS Notes. Washington: Board of Governors of the Federal Reserve System, October 06, 2021, https://doi.org/10.17016/2380-7172.2998 |
[1]
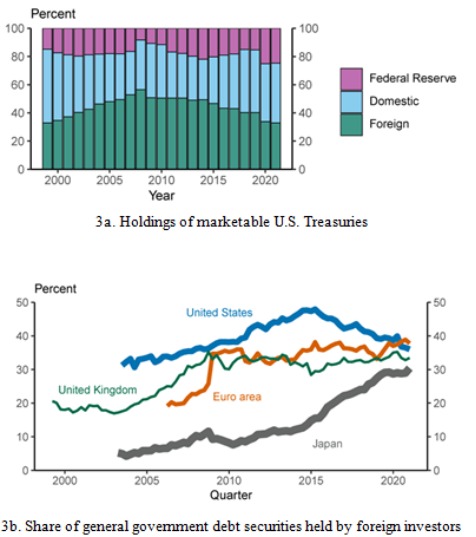
The bulk of these official dollar reserves are held in the form of U.S. Treasury securities, which are in high demand by both official and private foreign investors. As of the end of the first quarter of 2021, $7.0 trillion or 33 percent of marketable Treasury securities outstanding were held by foreign investors, both official and private (see
Figure 3a), while 42 percent were held by private domestic investors, and 25 percent by the Federal Reserve System. Although the share of Treasuries held by foreign investors has declined from almost 50 percent in 2015, the current foreign share of Treasury holdings is comparable to the share of euro-area government debt held by investors outside of the euro area (shown in
Figure 3b) and higher than the foreign-held shares of British or Japanese government debt.
Figure 3. Foreign holdings of government debt.
Note:
Figure 3a legend entries appear in graph order from top to bottom.
Figure 3b excludes domestic central bank holdings. Intra-euro area holdings of euro area debt securities are considered domestic holdings. General government debt securities includes local, state, and national debt securities.
Figure 3a. data are annual and extend from 1999 through 2021. 2021 is 2021-Q1.
Figure 3b. Data are quarterly and extend from 1999-Q1 through 2020-Q4.
Source: Financial Accounts of the United States, Table L.210. BIS debt securities statistics; World Bank/IMF Quarterly External Debt Statistics (QEDS), accessed through Haver Analytics; Bank of England; Bank of Japan; European Central Bank; Federal Reserve Board; Board staff calculations.
Accessible version
Figure 3 | [1] | Bertaut, Carol C., Bastian von Beschwitz, and Stephanie E. Curcuru (2021). "The International Role of the U.S. Dollar," FEDS Notes. Washington: Board of Governors of the Federal Reserve System, October 06, 2021, https://doi.org/10.17016/2380-7172.2998 |
[1]
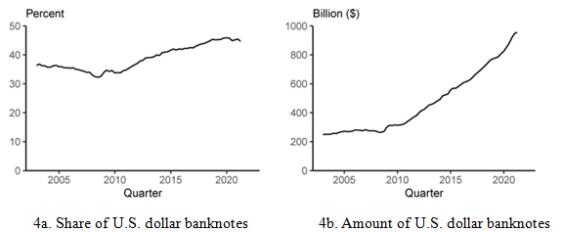
Foreign investors also hold substantial amounts of paper banknotes. As shown in
Figure 4, the value of U.S. dollar banknotes held abroad has increased over the past two decades, both on an absolute basis and as a fraction of banknotes outstanding. Federal Reserve Board staff estimate that over $950 billion in U.S. dollar banknotes were held by foreigners at the end of the first quarter of 2021, roughly half of total U.S. dollar banknotes outstanding.
Figure 4. Foreign holdings of U.S. dollar banknotes.
Note: The exact amount of U.S. dollar banknotes held by foreigners is not known. This is most likely a conservative estimate. See Judson (2017). Data are quarterly and extend from 2002-Q4 through 2021-Q1.
Source: Financial Accounts of the United States, Table L.204; Factors Affecting Reserve Balances (H.4.1),
Table 1; Board staff calculations.
Accessible version
Figure 4 | [1] | Bertaut, Carol C., Bastian von Beschwitz, and Stephanie E. Curcuru (2021). "The International Role of the U.S. Dollar," FEDS Notes. Washington: Board of Governors of the Federal Reserve System, October 06, 2021, https://doi.org/10.17016/2380-7172.2998 |
[1].
Additionally, many foreign countries leverage the effectiveness of the U.S. dollar as a store of value by limiting the movements of their currencies with respect to the U.S. dollar – in other words, using it as an anchor currency. As Ilzetzki, Reinhart, and Rogoff (2020) highlight, the dollar's usage as an anchor currency has increased over the past two decades. They estimate that 50 percent of world GDP in 2015 was produced in countries whose currency is anchored to the U.S. dollar (not counting the United States itself)
| [3] | Ilzetzki, Ethan O., Carmen M. Reinhart and Kenneth S. Rogoff, “Exchange Rate Arrangements into the 21st Century: Will the Anchor Currency Hold?, mimeo (University of Maryland and Harvard University). |
[3].
In contrast, the share of world GDP anchored to the euro was only 5 percent (not counting the euro area itself). Moreover, since the end of the Ilzetzki et al. sample in 2015, this anchoring has changed little. One exception might be the re-anchoring of the the Chinese renminbi from the U.S. dollar to a basket of currencies. However, the U.S. dollar and currencies anchored to the U.S. dollar comprise over 50 percent of this basket. So in practice, the Chinese renminbi remained effectively anchored to the U.S. dollar according to the Ilzetzki et al. definition, because in 90 percent of months between January 2016 and April 2021 the renminbi moved less than 2 percent against the U.S. dollar
| [4] | Their definition of anchored currencies includes currencies explicitly pegged to the dollar as well as currencies that move less than 2 percent against the dollar in over 90 percent of months. |
[4].
On the other hand, the paper of Thierry Bracke and Irina Bunda contributed to the empirical literature on the de facto exchange rate regimes in emerging and developing economies. We propose a synthetic measure of exchange rate practices over the period 1980 to 2010, using a sample of 149 emerging and developing countries. We use an enhanced version of the methodology proposed by Frankel and Wei (2008). Under this methodology, the degree of exchange rate flexibility and the anchor choice are simultaneously estimated. We improve upon the original methodology by proposing a dynamic measure of exchange rate practices obtained through recursive constrained linear least-squares of the currency exchange rate variation against the variation of SDR currencies and a flexibility indicator. This enables us to generate anchor currency weights for all countries in the sample on a monthly basis from 1980 to 2010
| [5] | U.S. GDP may have eclipsed British GDP as early as the late 1800s, but the dollar did not completely solidify its dominance until after the Bretton Woods Agreement in 1944 (Eichengreen and Flandreau (2008)). Return to text. |
[5]
.
The individual country results are then aggregated on a trade-weighted basis into a global indicator of exchange rate regime choice. This indicator captures both the degree of exchange rate flexibility and the global weights of the main anchor currencies. Our global indicator suggests that there have been over the past 30 years no systematic or trend shifts in exchange rate practices of emerging market and developing countries. The US dollar has remained the main anchor currency, with the euro as a distant second, throughout the entire sample period. Nevertheless, there has been some short-term variation in exchange rate practices, in particular during major financial crises when several emerging markets were forced to (temporarily) abandon or adjust their pegs. Also, we find some more heterogeneous evolutions at a regional level, in particular for central and eastern European and CIS countries, where the US dollar’s weight has decreased over the past two decades at the benefit of a shift toward euro anchoring and enhanced exchange rate flexibility
| [5] | U.S. GDP may have eclipsed British GDP as early as the late 1800s, but the dollar did not completely solidify its dominance until after the Bretton Woods Agreement in 1944 (Eichengreen and Flandreau (2008)). Return to text. |
[5]
.
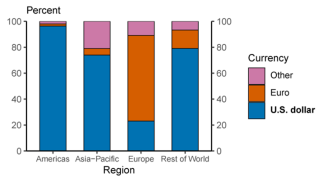
The U.S. dollar is dominant in international transactions and financial markets.
The international role of a currency can also be measured by its usage as a medium of exchange. The dominance of the dollar internationally has been highlighted in several recent studies of the currency composition of global trade and international financial transactions. The U.S. dollar is overwhelmingly the world's most frequently used currency in global trade. An estimate of the U.S. dollar share of global trade invoices is shown in
Figure 5. Over the period 1999-2019, the dollar accounted for 96 percent of trade invoicing in the Americas, 74 percent in the Asia-Pacific region, and 79 percent in the rest of the world. The only exception is Europe, where the euro is dominant.
Figure 5. Share of export invoicing.
Note: Average annual currency composition of export invoicing, where data are available. Data extend from 1999 through 2019. Regions are those defined by the IMF. Legend entries appear in graph order from top to bottom.
Source: IMF Direction of Trade; Central Bank of the Republic of China; Boz et al. (2020); Board staff calculations.
Accessible version
Figure 5 | [1] | Bertaut, Carol C., Bastian von Beschwitz, and Stephanie E. Curcuru (2021). "The International Role of the U.S. Dollar," FEDS Notes. Washington: Board of Governors of the Federal Reserve System, October 06, 2021, https://doi.org/10.17016/2380-7172.2998 |
[1].
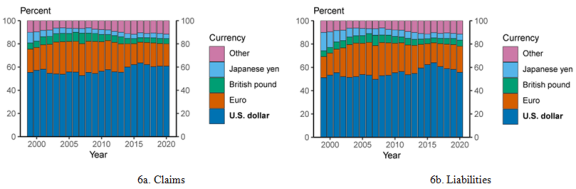
In part because of its dominant role as a medium of exchange, the U.S. dollar is also the dominant currency in international banking. As shown in
Figure 6, about 60 percent of international and foreign currency liabilities (primarily deposits) and claims (primarily loans) are denominated in U.S. dollars. This share has remained relatively stable since 2000 and is well above that for the euro (about 20 percent).
Figure 6. Share of international and foreign currency banking claims and liabilities.
Note: Share of banking claims and liabilities across national borders or denominated in a foreign currency. Excludes intra-euro area international liabilities and claims. At current exchange rates. Data are annual and extend from 1999 through 2020. Legend entries appear in graph order from top to bottom.
Source: BIS locational banking statistics; Board staff calculations.
Accessible version
Figure 6 | [1] | Bertaut, Carol C., Bastian von Beschwitz, and Stephanie E. Curcuru (2021). "The International Role of the U.S. Dollar," FEDS Notes. Washington: Board of Governors of the Federal Reserve System, October 06, 2021, https://doi.org/10.17016/2380-7172.2998 |
[1]
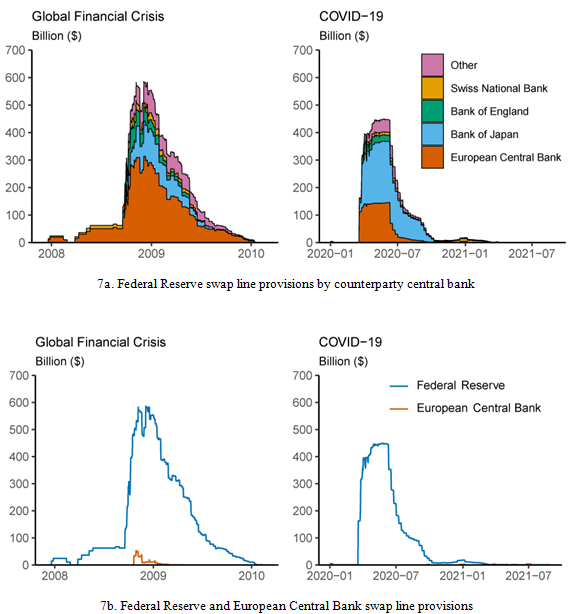
With dollar financing in particularly high demand during times of crisis, foreign financial institutions may face difficulties in obtaining dollar funding. In response, the Federal Reserve has introduced two programs to ease crisis-induced strains in international dollar funding markets, thus mitigating the effects of strains on the supply of credit to domestic and foreign firms and households. To ensure that dollar financing remained available during the 2008-2009 financial crisis, the Federal Reserve introduced temporary swap lines with several foreign central banks, a subset of which were made permanent in 2013
| [6] | Even excluding China, about 30 percent of world GDP (excluding the United States) is anchored to the U.S. dollar, significantly more than for any other currency. |
[6].
During the COVID-19 crisis in March 2020, the Federal Reserve increased the frequency of operations for the standing swap lines and introduced temporary swap lines with additional counterparties
| [7] | Since 2013, the following six central banks have had permanent bilateral swap arrangements with each other: the Bank of Canada, the Bank of England, the Bank of Japan, the European Central Bank, the Federal Reserve, and the Swiss National Bank. |
[7].
The Federal Reserve also introduced a repo facility available to Foreign and International Monetary Authorities (FIMA) with accounts at the Federal Reserve Bank of New York, which was made permanent in 2021
Both the swap lines and FIMA repo facility have enhanced the standing of the dollar as the dominant global currency, as approved users know that in a crisis they have access to a stable source of dollar funding. The swap lines were extensively used during the 2008-2009 financial crisis and the 2020 COVID-19 crisis, reaching outstanding totals of $585 billion and $450 billion, respectively (see
Figure 7a). Although other central banks have also established swap lines, non-dollar-denomindated swap lines offered by the European Central Bank and other central banks saw little usage (see
Figure 7b). This fact highlights how crucial dollar funding is in the operations of many internationally active banks.
Figure 7. Central bank swap lines.
Note: In
Figure 7a legend entries appear in graph order from top to bottom. Federal reserve swap line provisions to the Bank of England, Bank of Japan, and other central are at or near 0 prior to September 2008. Provisions to the Swiss National Bank are at or near 0 prior to March 2008. Provisions for the Swiss National Bank and Bank of England are at or near zero after June 2009.
Figure 7b includes both swap line and repo provisions by the European Central Bank for the COVID-19 period. At current exchange rates. Data are daily and extend from December 1, 2007 through February 28, 2010 for the Global Financial Crisis, and January 1, 2020 through August 31, 2021 for the COVID-19 period. Swap line provisions for the European Central Bank are 0 (or near 0 when shown in billions) October 2008 and after February 2009.
Source: Federal Reserve Bank of New York; European Central Bank.
Accessible version
Figure 7 | [1] | Bertaut, Carol C., Bastian von Beschwitz, and Stephanie E. Curcuru (2021). "The International Role of the U.S. Dollar," FEDS Notes. Washington: Board of Governors of the Federal Reserve System, October 06, 2021, https://doi.org/10.17016/2380-7172.2998 |
[1]
Issuance of foreign currency debt—debt issued by firms in a currency other than that of their home country — is also dominated by the U.S. dollar. The percentage of foreign currency debt denominated in U.S. dollars has remained around 60 percent since 2010, as seen in
Figure 8. This puts the dollar well ahead of the euro, whose share is 23 percent.
Figure 8. Share of foreign currency debt issuance.
Note: Foreign currency debt is denominated in a foreign currency relative to the country of the issuing firm (not the location of issuance). At current exchange rates. Data are annual and extend from 1999 through 2021. 2021 is 2021-H1. Legend entries appear in graph order from top to bottom. Chinese renmimbi is 0 until 2008.
Source: Dealogic; Refinitiv; Board staff calculations.
Accessible version
Figure 8 | [1] | Bertaut, Carol C., Bastian von Beschwitz, and Stephanie E. Curcuru (2021). "The International Role of the U.S. Dollar," FEDS Notes. Washington: Board of Governors of the Federal Reserve System, October 06, 2021, https://doi.org/10.17016/2380-7172.2998 |
[1]
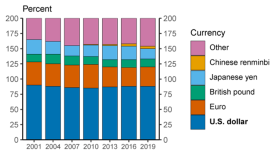
The many sources of demand for U.S. dollars are also reflected in the high U.S. dollar share of foreign exchange (FX) transactions. The most recent Triennial Central Bank Survey for 2019 from the Bank for International Settlements indicated that the U.S. dollar was bought or sold in about 88 percent of global FX transactions in April 2019. This share has remained stable over the past 20 years (
Figure 9). In contrast, the euro was bought or sold in 32 percent of FX transactions, a decline from its peak of 39 percent in 2010.8.
Figure 9. Share of over-the-counter foreign exchange transactions.
Note: On a net-net basis at current exchange rates. Percentages sum to 200 percent because every FX transaction includes two currencies. Legend entries appear in graph order from top to bottom. Chinese renmimbi is 0 until 2013.
Source: BIS Triennial Central Bank Survey of FX and OTC Derivatives Markets.
Accessible version
Figure 9 | [1] | Bertaut, Carol C., Bastian von Beschwitz, and Stephanie E. Curcuru (2021). "The International Role of the U.S. Dollar," FEDS Notes. Washington: Board of Governors of the Federal Reserve System, October 06, 2021, https://doi.org/10.17016/2380-7172.2998 |
[1]
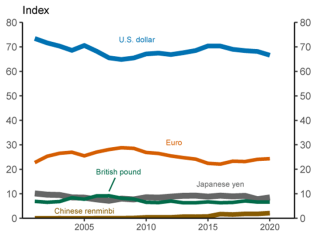
Overall, U.S. dollar dominance has remained stable over the past 20 years.
A review of the use of the dollar globally over the last two decades suggests a dominant and relatively stable role. To illustrate this stability, we construct an aggregate index of international currency usage. This index is computed as the weighted average of five measures of currency usage for which time series data are available: Official currency reserves, FX transaction volume, foreign currency debt instruments outstanding, cross-border deposits, and cross-border loans. We display this index of international currency usage in
Figure 10. The dollar index level has remained stable at a value of about 75 since the Global Financial Crisis in 2008, well ahead of all other currencies. The euro has the next-highest value at about 25, and its value has remained fairly stable as well. While international usage of the Chinese renminbi has increased over the past 20 years, it has only reached an index level of about 3, remaining even behind the Japanese yen and British pound, which are at about 8 and 7, respectively.
Figure 10. Index of international currency usage.
Note: Index is a weighted average of each currency's share of globally disclosed FX reserves (25 percent weight), FX transaction volume (25 percent), foreign currency debt issuance (25 percent), foreign currency and international banking claims (12.5 percent), and foreign currency and international banking liabilities (12.5 percent).
Source: IMF COFER; BIS Triennial Central Bank Survey of FX and OTC Derivatives Market; Dealogic; Refinitiv; BIS locational banking statistics; Board staff calculations.
Accessible version
Figure 10 | [1] | Bertaut, Carol C., Bastian von Beschwitz, and Stephanie E. Curcuru (2021). "The International Role of the U.S. Dollar," FEDS Notes. Washington: Board of Governors of the Federal Reserve System, October 06, 2021, https://doi.org/10.17016/2380-7172.2998 |
[1]
Diminution of the U.S. dollar's status seems unlikely in the near term.
Near-term challenges to the U.S. dollar's dominance appear limited. In modern history there has been only one instance of a predominant currency switching—the replacement of the British pound by the dollar. The dollar rose to prominence after the financial crisis associated with World War I, then solidified its international role after the Bretton Woods Agreement in 1944 (Tooze 2021, Eichengreen and Flandreau 2008, Carter 2020)
| [5] | U.S. GDP may have eclipsed British GDP as early as the late 1800s, but the dollar did not completely solidify its dominance until after the Bretton Woods Agreement in 1944 (Eichengreen and Flandreau (2008)). Return to text. |
[5].
However, over a longer horizon there is more risk of a challenge to the dollar's international status, and some recent developments have the potential to boost the international usage of other currencies.
Increased European integration is one possible source of challenge, as the European Union (EU) is a large economy with fairly deep financial markets, generally free trade, and robust and stable institions. During the COVID-19 crisis, the EU made plans to issue an unprecedented amount of jointly backed debt. If fiscal integration progresses and a large, liquid market for EU bonds develops, the euro could become more attractive as a reserve currency. This integration could potentially be accelerated by enhancements to the EU's sovereign debt market infrastructure and introducing a digital euro. Additionally, the euro's prominent role in corporate and sovereign green finance could bolster its international status if these continue to grow. However, even with more fiscal integration, remaining political separation will continue to cause policy uncertainty.
Another source of challenges to the U.S. dollar's dominance could be the continued rapid growth of China. Chinese GDP already exceeds U.S. GDP on a purchasing power parity basis (IMF World Economic Outlook, July 2021) and is projected to exceed U.S. GDP in nominal terms in the 2030s
| [5] | U.S. GDP may have eclipsed British GDP as early as the late 1800s, but the dollar did not completely solidify its dominance until after the Bretton Woods Agreement in 1944 (Eichengreen and Flandreau (2008)). Return to text. |
[5].
It is also by far the world's largest exporter, though it lags the United States by value of imports (IMF Direction of Trade Statistics, 2021-Q2). There are significant roadblocks to more widespread use of the Chinese renminbi. Importantly, the renminbi is not freely exchangeable, the Chinese capital account is not open, and investor confidence in Chinese institutions, including the rule of law, is relatively low (Wincuinas 2019). These factors all make the Chinese renmimbi—in whatever form—relatively unattractive for international investors.
A shifting payments landscape could also pose a challenge to the U.S. dollar's dominance. For example, the rapid growth of digital currencies, both private sector and official, could reduce reliance on the U.S. dollar. Changing consumer and investor preferences, combined with the possibility of new products, could shift the balance of perceived costs and benefits enough at the margin to overcome some of the inertia that helps to maintain the dollar's leading role. That said, it is unlikely that technology alone could alter the landscape enough to completely offset the long-standing reasons the dollar has been dominant.
In sum, absent any large-scale political or economic changes which damage the value of the U.S. dollar as a store of value or medium of exchange and simultaneously bolster the attractiveness of dollar alternatives, the dollar will likely remain the world's dominant international currency for the foreseeable future.
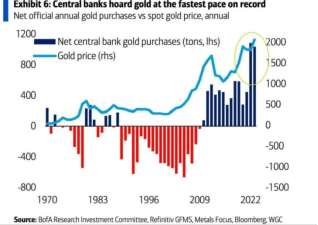
If we look at the last decade, the share of gold in the FOREX of central banks began to grow with a significant share in the FOREX of the world's central banks.
As we can see from
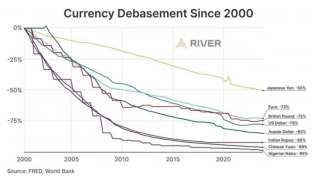
Figure 11, the net annual increase in the purchase of monetary gold by central banks in tones began to grow dynamically from 2009 to 2022. On the other hand, the US dollar loses its purchasing power and significantly devalues. Look at
Figure 12.
In order to challenge the research results Please look at the following Charts.
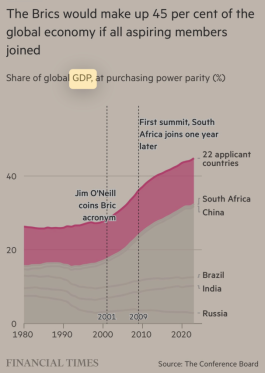
The size of such as BRICS begins to increase. Their share of world GDP begins to compete with the proportion of countries that use the dollar as an anchor currency. We look at the dynamics of the GDP of the BRICS countries.
According to the calculations of purchasing power parity, the BRICS countries can exceed 50% of the world's total GDP. This is a fluff, but the dynamics are obvious. And the BRICS countries are gradually reducing the share of the US dollar in the its members' Central Bank's international reserves.
The visual increase in the capacity of the BRICS countries is shown in
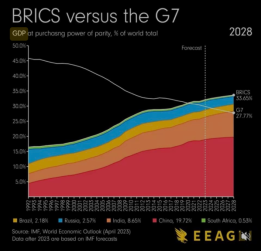
Figure 14, where the dynamics of the specific weight in terms of purchasing power parity 14 of the economies of the G7 countries and the economies of the BRICS countries is shown.
According to assumptions, the proportion of GDP of the BRICS countries in the world GDP at purchasing power parity in 2024 should exceed the specific weight of the GDP of the G7 countries in the world GDP.
The Role of the Federal Reserve Hence, there is a need for a better understanding of exchange rate practices in emerging markets and developing economies. This paper of Tierry Brake and Irina Bunke provides a systematic way of looking at the role played by anchor currencies or baskets of currencies, based on a sample of 149 emerging market and developing countries. An extension of Frankel and Wei (2008) is used to assess a country’s de facto exchange rate regime (i.e., hard peg, intermediate or freely floating) by simultaneously estimating the degree of exchange rate flexibility and the choice of the anchor. The paper is thus related with two strands of literature. On the one hand, in order to estimate the degree of exchange rate flexibility, we use techniques borrowed from the fixed- versus-floating literature on the de facto exchange rate regime that a country follows in practice. On the other hand, for pegged regimes, we identify the currency or basket of currencies to which a particular country’s exchange rate is linked, and for currency baskets, we calculate the importance (weights) of individual currencies, similar to the literature on the choice of currency basket weights
The main findings of Tierry Brake and Irina Bunle were twofold. First, there is no evidence of a systematic shift away from the US dollar as an anchor currency at the global level, based on the trade- weighted indicator of exchange rate regimes. However, panel estimation results show heterogeneous trends at the regional level. In particular, for Central and Eastern European and CIS countries, the US dollar anchor weight has declined in tandem with a move towards a closer tracking of the euro and enhanced exchange rate flexibility. Second, the results suggest that the evolution of the anchoring role of currencies can be mainly explained by structural shifts in global trade and the currency denomination of long-term external debt. Moreover, regional network effects play a significant role in explaining anchor currency choices, suggesting that, if one or several major countries move towards an alternative currency anchor, or towards more flexibility, this encourages their neighbours in the region to follow
So since 2000 year the sound research on the consequnces for 149 emerging markets and developing countries countries to use anchor currency or basket of currencies. Lets see on the
Figure 13. We can see sound results that puts a lot of questions for next reseaches and findings.
Table 1. The scale of devaluation Author’s own research.
Pegged (0%): 19 countries including Bahrain, UAE, Kuwait | Antigua and Barbuda, Bahamas, Bahrain, Barbados, Belize, Djibouti, Dominica, Grenada, Jordan, Kuwait, Maldives, Oman, Panama, Qatar, Saudi Arabia, St. Kitts and Nevis, St. Lucia, St. Vincent and Grenadines, UAE |
- 0-15%: 10 countries including Morocco, Peru, Thailand | Bolivia, Bulgaria, Cambodia, Fijui, Guatemala, Morocco, Peru, Poland, Thailand, Tonga |
- 15-50%: 7 countries including Malaysia, Hungary, Philippines | Brunei, Czech Republic, Georgia, Hungary, Malasia, Moldova, Philipiness |
- 50-75%: 4 countries including Honduras, Vietnam | Costa Rica, Honduras, Mauritius, Vietnam |
- 75-100%: 6 countries including Mexico, India, Chile | Algeria, Chile, India, Kyrgyz Republic, Mexico, Nepal |
- 100-200%: 12 countries including Indonesia, Colombia, Bangladesh | Bangladesh, Colombia, Indonesia, Kenya, Laos, Paraguay, Romania, Seychelles, Solomon Islands, Sudan, Tunisia, Uganda, |
- 200-300%: 8 countries including Russia, Kazakhstan, Uruguay | Dominican Republic, Jamaica, Kazakhstan, Mongolia, Russia, Rwanda, Tanzania, Uruguay |
- 300-400%: 2 countries (Mozambique, Sri Lanka) | Mozambique, Sri Lanka |
- 400-500%: 3 countries (Guinea, Pakistan, Gambia) | Gambia, Guinea, Pakistan |
- 500-1000%: 6 countries including Ukraine, Ethiopia, Yemen | Ethiopia, Haiti, Tajikistan, Ukraine, Yemen, Zambia |
- Over 1000%: 10 countries including Argentina, Syria, Lebanon | Angola, Argentina, DR Congo, Ghana, Lebanon, Myanmar, Suriname, Syria, Sierra Leone, Turkey |
The tragedy is that the U.S. dollar as an acnhor has lost 78%. Please look at
Figure 12.
The countries listed below were included in the main analysis of de fact anchor currency choice and the construction of aggregate indicators. Data are available on a monthly basis from January 1978 to December 2008 unless otherwise stated. The asterisk denotes the countries included in the analysis of the determinants of the degree of pegging on a global currency (Section 5)
THE consequances for 149 emerging markets and developing countries countries to use anchor currency or basket of currencies.
1. Albania (1994-):
a) 2000: ~140 lek/USD
b) 2024: ~95 lek/USD
c) Result: Currency strengthened by approximately 32%
2. Algeria:
a) 2000: ~69.3 dinar/USD
b) 2024: ~136 dinar/USD
c) Result: ~96% devaluation
3. Angola (1996-):
a) 2000: ~5.6 kwanza/USD
b) 2024: ~830 kwanza/USD
c) Result: ~14,700% devaluation
4. Antigua and Barbuda:
a) Fixed rate: 2.7 East Caribbean dollar/USD
b) Result: No change (pegged to USD)
5. Argentina:
a) 2000: ~1 peso/USD
b) 2024: ~800 peso/USD
c) Result: ~79,900% devaluation
6. Armenia (1993-)
a) 2000: ~524 dram/USD
b) 2024: ~400 dram/USD
c) Result: Currency strengthened by approximately 24%
7. Azerbaijan (1993-):
a) 2000: ~4,474 manat/USD
b) 2024: ~1.7 manat/USD
c) Result: Cannot be directly compared due to redenomination in 2006
8. The Bahamas:
a) Fixed rate: 1:1 with USD
b) Result: No change (pegged to USD)
9. Bahrain:
a) Fixed rate: 0.376 dinar/USD
b) Result: No change (pegged to USD)
10. Bangladesh:
a) 2000: ~51 taka/USD
b) 2024: ~110 taka/USD
c) Result: ~115% devaluation
11 Barbados:
a) Fixed rate: 2 Barbadian dollar/USD
b) Result: No change (pegged to USD)
12. Belarus (1995-):
a) 2000: ~320 ruble/USD
b) 2024: ~3.2 ruble/USD
c) Note: Underwent redenomination in 2016 (1:10000)
d) Adjusted result: ~900% devaluation
13. Belize:
a) Fixed rate: 2 Belize dollar/USD
b) Result: No change (pegged to USD)
14. Benin (-Oct. 2008):
a) Uses CFA Franc (fixed to Euro)
b) 2000: ~655 CFA/USD
c) 2024: ~600 CFA/USD
d) Result: ~8% strengthening (due to Euro fluctuations)
15. Bhutan:
a) Pegged to Indian Rupee
b) 2000: ~43.5 ngultrum/USD
c) 2024: ~83 ngultrum/USD
d) Result: ~91% devaluation
16. Bolivia:
a) 2000: ~6.18 boliviano/USD
b) 2024: ~6.96 boliviano/USD
c) Result: ~13% devaluation
17. Botswana:
a) 2000: ~4.62 pula/USD
b) 2024: ~13.5 pula/USD
c) Result: ~192% devaluation
18. Bosnia and Herzegovina:
a) Fixed to Euro
b) 2000: ~1.96 mark/USD
c) 2024: ~1.8 mark/USD
d) Result: ~8% strengthening (due to Euro fluctuations)
19. Brazil:
a) 2000: ~1.79 real/USD
b) 2024: ~5 real/USD
c) Result: ~180% devaluation
20. Brunei Darussalam:
a) 2000: ~1.67 Brunei dollar/USD
b) 2024: ~1.33 Brunei dollar/USD
c) Result: ~20% strengthening
21. Burkina Faso:
a) Uses CFA Franc (fixed to Euro)
b) 2000: ~655 CFA/USD
c) 2024: ~600 CFA/USD
d) Result: ~8% strengthening (due to Euro fluctuations)
22. Burundi:
a) 2000: ~800 franc/USD
b) 2024: ~2,850 franc/USD
c) Result: ~256% devaluation
23. Cambodia:
a) 2000: ~3,780 riel/USD
b) 2024: ~4,150 riel/USD
c) Result: ~10% devaluation
24. Cameroon:
a) Uses CFA Franc (fixed to Euro)
b) 2000: ~655 CFA/USD
c) 2024: ~600 CFA/USD
d) Result: ~8% strengthening (due to Euro fluctuations)
25. Cape Verde:
a) 2000: ~115 escudo/USD
b) 2024: ~100 escudo/USD
c) Result: ~13% strengthening
26. Chad:
a) Uses CFA Franc (fixed to Euro)
b) 2000: ~655 CFA/USD
c) 2024: ~600 CFA/USD
d) Result: ~8% strengthening (due to Euro fluctuations)
27. Chile:
a) 2000: ~530 peso/USD
b) 2024: ~950 peso/USD
c) Result: ~79% devaluation
28. China:
a) 2000: ~8.28 yuan/USD
b) 2024: ~7.2 yuan/USD
c) Result: ~13% strengthening
29. Colombia:
a) 2000: ~1,873 peso/USD
b) 2024: ~4,080 peso/USD
c) Result: ~118% devaluation
30. Comoros:
a) Fixed to Euro
b) 2000: ~491 franc/USD
c) 2024: ~450 franc/USD
d) Result: ~8% strengthening (due to Euro fluctuations)
31. DR Congo:
a) 2000: ~50 franc/USD
b) 2024: ~2,500 franc/USD
c) Result: ~4,900% devaluation
32. Republic of Congo:
a) Uses CFA Franc (fixed to Euro)
b) 2000: ~655 CFA/USD
c) 2024: ~600 CFA/USD
d) Result: ~8% strengthening (due to Euro fluctuations)
33. Costa Rica:
a) 2000: ~308 colón/USD
b) 2024: ~535 colón/USD
c) Result: ~74% devaluation
34. Côte d'Ivoire:
a) Uses CFA Franc (fixed to Euro)
b) 2000: ~655 CFA/USD
c) 2024: ~600 CFA/USD
d) Result: ~8% strengthening (due to Euro fluctuations)
35. Croatia:
a) Joined Eurozone in 2023
b) Historical comparison not applicable due to Euro adoption
36. Djibouti:
a) Fixed rate: 177.72 franc/USD
b) Result: No change (pegged to USD)
37. Dominica:
a) Fixed rate: 2.7 East Caribbean dollar/USD
b) Result: No change (pegged to USD)
38. Dominican Republic:
a) 2000: ~16.18 peso/USD
b) 2024: ~57 peso/USD
c) Result: ~252% devaluation
39. Ecuador:
a) Dollarized economy since 2000
b) Result: Uses USD
40. Egypt:
a) 2000: ~3.47 pound/USD
b) 2024: ~31 pound/USD
c) Result: ~793% devaluation
41. El Salvador:
a) Dollarized economy since 2001
b) Result: Uses USD
42. Equatorial Guinea:
a) Uses CFA Franc (fixed to Euro)
b) 2000: ~655 CFA/USD
c) 2024: ~600 CFA/USD
d) Result: ~8% strengthening (due to Euro fluctuations)
43. Ethiopia:
a) 2000: ~8.2 birr/USD
b) 2024: ~56 birr/USD
c) Result: ~583% devaluation
44. Fiji:
a) 2000: ~1.97 dollar/USD
b) 2024: ~2.25 dollar/USD
c) Result: ~14% devaluation
45. Gabon:
a) Uses CFA Franc (fixed to Euro)
b) 2000: ~655 CFA/USD
c) 2024: ~600 CFA/USD
d) Result: ~8% strengthening (due to Euro fluctuations)
46. The Gambia:
a) 2000: ~11.4 dalasi/USD
b) 2024: ~64 dalasi/USD
c) Result: ~461% devaluation
47. Georgia:
a) 2000: ~1.97 lari/USD
b) 2024: ~2.7 lari/USD
c) Result: ~37% devaluation
48. Ghana:
a) 2000: ~0.7 cedi/USD
b) 2024: ~12 cedi/USD
c) Note: Underwent redenomination in 2007
d) Adjusted result: ~1,614% devaluation
49. Grenada:
a) Fixed rate: 2.7 East Caribbean dollar/USD
b) Result: No change (pegged to USD)
50. Guatemala:
a) 2000: ~7.76 quetzal/USD
b) 2024: ~7.85 quetzal/USD
c) Result: ~1% devaluation
51. Guinea:
a) 2000: ~1,746 franc/USD
b) 2024: ~8,600 franc/USD
c) Result: ~392% devaluation
52. Guinea-Bissau:
a) Uses CFA Franc (fixed to Euro)
b) 2000: ~655 CFA/USD
c) 2024: ~600 CFA/USD
d) Result: ~8% strengthening (due to Euro fluctuations)
53. Guyana:
a) 2000: ~182 dollar/USD
b) 2024: ~210 dollar/USD
c) Result: ~15% devaluation
54. Haiti:
a) 2000: ~19 gourde/USD
b) 2024: ~135 gourde/USD
c) Result: ~611% devaluation
55. Honduras:
a) 2000: ~14.84 lempira/USD
b) 2024: ~24.7 lempira/USD
c) Result: ~66% devaluation
56. India:
a) 2000: ~43.5 rupee/USD
b) 2024: ~83 rupee/USD
c) Result: ~91% devaluation
57. Indonesia:
a) 2000: ~7,085 rupiah/USD
b) 2024: ~15,600 rupiah/USD
c) Result: ~120% devaluation
58. Iraq:
a) 2000: Not comparable due to regime change
b) 2024: ~1,320 dinar/USD
c) Result: Cannot calculate due to historical discontinuity
59. Jamaica:
a) 2000: ~43.5 dollar/USD
b) 2024: ~155 dollar/USD
c) Result: ~256% devaluation
60. Jordan:
a) Fixed rate: 0.709 dinar/USD
b) Result: No change (pegged to USD)
61. Kazakhstan:
a) 2000: ~138 tenge/USD
b) 2024: ~450 tenge/USD
c) Result: ~226% devaluation
62. Kenya:
a) 2000: ~76 shilling/USD
b) 2024: ~157 shilling/USD
c) Result: ~107% devaluation
63. Kuwait:
a) 2000: ~0.31 dinar/USD
b) 2024: ~0.31 dinar/USD
c) Result: Relatively stable (managed float)
64. Kyrgyz Republic:
a) 2000: ~45.7 som/USD
b) 2024: ~89 som/USD
c) Result: ~95% devaluation
65. Laos:
a) 2000: ~7,674 kip/USD
b) 2024: ~19,500 kip/USD
c) Result: ~154% devaluation
66. Lebanon:
a) 2000: ~1,507 pound/USD
b) 2024: ~89,000 pound/USD
c) Result: ~5,805% devaluation
67. Libya:
a) 2000: ~0.54 dinar/USD
b) 2024: ~4.8 dinar/USD
c) Result: ~789% devaluation
68. Macedonia (North Macedonia):
a) 2000: ~65.3 denar/USD
b) 2024: ~57 denar/USD
c) Result: ~13% strengthening
69. Madagascar:
a) 2000: ~6,767 ariary/USD
b) 2024: ~4,500 ariary/USD
c) Result: ~33% strengthening
70. Malawi:
a) 2000: ~46 kwacha/USD
b) 2024: ~1,680 kwacha/USD
c) Result: ~3,552% devaluation
71. Malaysia:
a) 2000: ~3.80 ringgit/USD
b) 2024: ~4.65 ringgit/USD
c) Result: ~22% devaluation
72. Maldives:
a) Fixed rate: 15.42 rufiyaa/USD
b) Result: No change (pegged to USD)
73. Mali:
a) Uses CFA Franc (fixed to Euro)
b) 2000: ~655 CFA/USD
c) 2024: ~600 CFA/USD
d) Result: ~8% strengthening (due to Euro fluctuations)
74. Mauritania:
a) 2000: ~238 ouguiya/USD
b) 2024: ~39 ouguiya/USD
c) Note: Underwent redenomination in 2018
d) Adjusted result: ~64% devaluation
75. Mauritius:
a) 2000: ~25.2 rupee/USD
b) 2024: ~44 rupee/USD
c) Result: ~75% devaluation
76. Mexico:
a) 2000: ~9.5 peso/USD
b) 2024: ~17 peso/USD
c) Result: ~79% devaluation
77. Moldova:
a) 2000: ~12.4 leu/USD
b) 2024: ~17.8 leu/USD
c) Result: ~44% devaluation
78. Mongolia:
a) 2000: ~1,097 tugrik/USD
b) 2024: ~3,450 tugrik/USD
c) Result: ~214% devaluation
79. Morocco:
a) 2000: ~10.05 dirham/USD
b) 2024: ~10.1 dirham/USD
c) Result: ~0.5% devaluation (relatively stable)
80. Mozambique:
a) 2000: ~15.7 metical/USD
b) 2024: ~64 metical/USD
c) Result: ~308% devaluation
81. Myanmar:
a) 2000: ~6.5 kyat/USD
b) 2024: ~2,100 kyat/USD
c) Result: ~32,208% devaluation
82. Namibia:
a) 2000: ~6.15 dollar/USD
b) 2024: ~18.7 dollar/USD
c) Result: ~204% devaluation
83. Nepal:
a) 2000: ~71 rupee/USD
b) 2024: ~132 rupee/USD
c) Result: ~86% devaluation
84. Nicaragua:
a) 2000: ~12.68 córdoba/USD
b) 2024: ~36.5 córdoba/USD
c) Result: ~188% devaluation
85. Niger:
a) Uses CFA Franc (fixed to Euro)
b) 2000: ~655 CFA/USD
c) 2024: ~600 CFA/USD
d) Result: ~8% strengthening (due to Euro fluctuations)
86. Nigeria:
a) 2000: ~100 naira/USD
b) 2024: ~890 naira/USD
c) Result: ~790% devaluation
87. Oman:
a) Fixed rate: 0.385 rial/USD
b) Result: No change (pegged to USD)
88. Pakistan:
a) 2000: ~51.8 rupee/USD
b) 2024: ~280 rupee/USD
c) Result: ~441% devaluation
89. Panama:
a) Uses USD
b) Result: No change (dollarized)
90. Papua New Guinea:
a) 2000: ~2.78 kina/USD
b) 2024: ~3.7 kina/USD
c) Result: ~33% devaluation
91. Paraguay:
a) 2000: ~3,485 guarani/USD
b) 2024: ~7,300 guarani/USD
c) Result: ~109% devaluation
92. Peru:
a) 2000: ~3.49 sol/USD
b) 2024: ~3.7 sol/USD
c) Result: ~6% devaluation
93. Philippines:
a) 2000: ~40.3 peso/USD
b) 2024: ~55.5 peso/USD
c) Result: ~38% devaluation
94. Qatar:
a) Fixed rate: 3.64 riyal/USD
b) Result: No change (pegged to USD)
95. Russia:
a) 2000: ~28.7 ruble/USD
b) 2024: ~90 ruble/USD
c) Result: ~214% devaluation
96. Rwanda:
a) 2000: ~393 franc/USD
b) 2024: ~1,250 franc/USD
c) Result: ~218% devaluation
97. Samoa:
a) 2000: ~3.29 tala/USD
b) 2024: ~2.7 tala/USD
c) Result: ~18% strengthening
98. São Tomé and Príncipe:
a) 2000: ~7,978 dobra/USD
b) 2024: ~23.2 dobra/USD
c) Note: Underwent redenomination
d) Adjusted result: ~191% devaluation
99. Saudi Arabia:
a) Fixed rate: 3.75 riyal/USD
b) Result: No change (pegged to USD)
100. Senegal:
a) Uses CFA Franc (fixed to Euro)
b) 2000: ~655 CFA/USD
c) 2024: ~600 CFA/USD
d) Result: ~8% strengthening (due to Euro fluctuations)
101 Seychelles:
a) 2000 Exchange Rate: ~5.6 rupee/USD
b) 2024 Exchange Rate: ~13.9 rupee/USD
c) Calculation:
d) Result: ~148% devaluation.
102. Sierra Leone:
a) 2000 Exchange Rate: ~2,000 leone/USD
b) 2024 Exchange Rate: ~22,000 leone/USD
c) Calculation:
d) Result: ~1,000% devaluation.
103. Solomon Islands:
a) 2000 Exchange Rate: ~4.07 dollar/USD
b) 2024 Exchange Rate: ~8.55 dollar/USD
c) Calculation:
d) Result: ~110% devaluation.
104. South Africa:
a) 2000 Exchange Rate: ~6.15 rand/USD
b) 2024 Exchange Rate: ~18.8 rand/USD
c) Calculation:
d) Result: ~206% devaluation.
105. Sri Lanka:
a) 2000 Exchange Rate: ~78 rupee/USD
b) 2024 Exchange Rate: ~365 rupee/USD
c) Calculation:
d) Result: ~368% devaluation.
106. St. Kitts and Nevis:
a) Fixed Rate: 2.7 East Caribbean dollar/USD
b) Result: No change (pegged to USD).
107. St. Lucia:
a) Fixed Rate: 2.7 East Caribbean dollar/USD
b) Result: No change (pegged to USD).
108. St. Vincent and the Grenadines:
a) Fixed Rate: 2.7 East Caribbean dollar/USD
b) Result: No change (pegged to USD).
109. Sudan:
a) 2000 Exchange Rate: ~257 pound/USD
b) 2024 Exchange Rate: ~610 pound/USD
c) Calculation:
d) Result: ~137% devaluation.
110. Suriname:
a) 2000 Exchange Rate: ~2.2 dollar/USD
b) 2024 Exchange Rate: ~38.8 dollar/USD
c) Calculation:
d) Result: ~1,664% devaluation.
111. Swaziland (Eswatini):
a) 2000 Exchange Rate: ~6.15 lilangeni/USD
b) 2024 Exchange Rate: ~18.7 lilangeni/USD
c) Calculation:
d) Result: ~204% devaluation.
112. Syria:
a) 2000 Exchange Rate: ~11.2 pound/USD
b) 2024 Exchange Rate: ~13,500 pound/USD
c) Calculation:
d) Result: ~120,357% devaluation.
113. Tajikistan:
a) 2000 Exchange Rate: ~1.8 somoni/USD
b) 2024 Exchange Rate: ~10.9 somoni/USD
c) Calculation:
d) Result: ~506% devaluation.
114. Tanzania:
a) 2000 Exchange Rate: ~800 shilling/USD
b) 2024 Exchange Rate: ~2,500 shilling/USD
c) Calculation:
d) Result: ~213% devaluation.
115. Thailand:
a) 2000 Exchange Rate: ~40.5 baht/USD
b) 2024 Exchange Rate: ~35 baht/USD
c) Calculation:
d) Result: ~14% strengthening.
116. Timor-Leste:
a) Dollarized Economy
b) Result: No change (uses USD).
117. Togo:
a) Uses CFA Franc (fixed to Euro)
b) 2000 Exchange Rate: ~655 CFA/USD
c) 2024 Exchange Rate: ~600 CFA/USD
d) Result: ~8% strengthening due to Euro fluctuations.
118. Tonga:
a) 2000 Exchange Rate: ~2.04 paʻanga/USD
b) 2024 Exchange Rate: ~2.34 paʻanga/USD
c) Calculation:
d) Result: ~15% devaluation.
119. Trinidad and Tobago:
a) 2000 Exchange Rate: ~6.3 dollar/USD
b) 2024 Exchange Rate: ~6.8 dollar/USD
c) Calculation:
d) Result: ~8% devaluation.
120. Tunisia:
a) 2000 Exchange Rate: ~1.25 dinar/USD
b) 2024 Exchange Rate: ~3.15 dinar/USD
c) Calculation:
d) Result: ~152% devaluation.
121. Turkey:
a) 2000 Exchange Rate: ~625,000 lira/USD
b) 2024 Exchange Rate: ~27.6 lira/USD (after 2005 redenomination, 1:1,000,000).
c) Adjusted 2000 Exchange Rate:.
d) Calculation:
e) Result: ~4,316% devaluation.
122. Uganda:
a) 2000 Exchange Rate: ~1,515 shilling/USD
b) 2024 Exchange Rate: ~3,750 shilling/USD
c) Calculation:
d) Result: ~148% devaluation.
123. Ukraine:
a) 2000 Exchange Rate: ~5.44 hryvnia/USD
b) 2024 Exchange Rate: ~37 hryvnia/USD
c) Calculation:
d) Result: ~580% devaluation.
124. United Arab Emirates:
a) Fixed Rate: 3.67 dirham/USD
b) Result: No change (pegged to USD).
125. Uruguay:
a) 2000 Exchange Rate: ~11 peso/USD
b) 2024 Exchange Rate: ~38 peso/USD
c) Calculation:
d) Result: ~245% devaluation.
126. Vanuatu:
a) 2000 Exchange Rate: ~129 vatu/USD
b) 2024 Exchange Rate: ~123 vatu/USD
c) Calculation:
d) Result: ~5% strengthening.
127. Venezuela:
a) 2000 Exchange Rate: ~688 bolívar/USD
b) 2024 Exchange Rate: ~40,000,000 bolívar/USD (after multiple redenominations).
c) Adjusted 2000 Exchange Rate: Accounting for redenominations (2008: 1:1,000, 2018: 1:100,000, 2021: 1:1,000,000):
d) Calculation:
e) Result: Hyperinflation, effectively incalculable.
128. Vietnam:
a) 2000 Exchange Rate: ~14,093 dong/USD
b) 2024 Exchange Rate: ~24,700 dong/USD
c) Calculation:
d) Result: ~75% devaluation.
129. Yemen:
a) 2000 Exchange Rate: ~162 riyal/USD
b) 2024 Exchange Rate: ~1,250 riyal/USD
c) Calculation:
d) Result: ~672% devaluation.
130. Zambia:
a) 2000 Exchange Rate: ~3,110 kwacha/USD
b) 2024 Exchange Rate: ~21,000 kwacha/USD
c) Calculation:
d) Result: ~576% devaluation.
131. Zimbabwe:
a) 2000 Exchange Rate: ~38 ZWD/USD
b) 2024 Exchange Rate: ~8,600,000 ZWD/USD (after redenominations).
c) Accounting for redenomination (2006: 1:1,000, 2008: 1:10,000, 2009: abandonment of ZWD).
d) Adjusted 2000 Rate:.
e) Calculation:
f) Result: Hyperinflation, effectively incalculable.
New EU Member States:
132. Bulgaria:
a) 2000 Exchange Rate: ~2.03 lev/USD
b) 2024 Exchange Rate: ~1.81 lev/USD
c) Calculation:
d) Result: ~11% strengthening.
133. Czech Republic:
a) 2000 Exchange Rate: ~38 koruna/USD
b) 2024 Exchange Rate: ~23 koruna/USD
c) Calculation:
d) Result: ~39% strengthening.
134. Slovak Republic:
a) Joined the Eurozone in 2009.
b) Result: Comparison not applicable post-Euro adoption.
135. Estonia:
a) Joined the Eurozone in 2011.
b) Result: Comparison not applicable post-Euro adoption.
136. Hungary:
a) 2000 Exchange Rate: ~282 forint/USD
b) 2024 Exchange Rate: ~350 forint/USD
c) Calculation:
d) Result: ~24% devaluation.
137. Latvia:
a) Joined the Eurozone in 2014.
b) Result: Comparison not applicable post-Euro adoption.
138. Lithuania:
a) Joined the Eurozone in 2015.
b) Result: Comparison not applicable post-Euro adoption.
139. Poland:
a) 2000 Exchange Rate: ~4.1 zloty/USD
b) 2024 Exchange Rate: ~4.4 zloty/USD
c) Calculation:
d) Result: ~7% devaluation.
140. Romania:
a) 2000 Exchange Rate: ~21,680 leu/USD
b) 2024 Exchange Rate: ~4.6 leu/USD (after 2005 redenomination, 1:10,000).
c) Adjusted 2000 Exchange Rate:.
d) Calculation:
e) Result: ~112% devaluation.
Ukraine devalued its currency from 4.1 UAH per USD in 2000 to 42 UAH per USD in 2024, which is a plus 600%devaluation.
The Ukrainian hryvnia exhibits large fluctuations in both the flexibility coefficient and the US dollar coefficient, in line with the two other classifications that assign the currency to either freely floating/falling or the soft peg/managed floating categories until 2002. Our results suggest a shift to a full US dollar peg in 2002, which is again consistent with the other two classifications. However, results from more recent period, during the global financial crisis, point to a small degree of currency flexibility and de-pegging from the US dollar standard. The flexibility coefficient increases sharply after May 2008, systematically exceeding 0.90 during the rest of the sample period. While the two other classifications are not yet available for this most recent time period, the finding seems to be in line with the temporary decoupling of the Ukrainian hryvnia from the US dollar and its large depreciation in the wake of the global financial crisis
Conclusions of the
findings.
This study extends the Frankel and Wei (2008) methodology to estimate the exchange rate anchoring behaviour in a sample of 149 emerging and developing economies, tracking changes over time during the period 1980-2010. Robustness checks based on individual country results show a high degree of correlation of our results with the equivalent discrete de facto classifications of Ilzetzki, Reinhart and Rogoff (2008) and the IMF.
The study constructs an aggregate trade-weighted global indicator of exchange rate regime choice to capture the role of the global currencies and their long-term trends in the evolution of the exchange rates of selected emerging market and developing countries. The overall results suggest that the US dollar has over the past three decades maintained a clear leading role as an important exchange rate anchor currency, with a trade-weighted share of around 50% on average. On a trade-weighted basis, the shares of the euro and the Japanese yen are far smaller, at around 7.5% and 3%, respectively, whereas the share of the British pound has virtually vanished over the last decade compared to earlier periods.
Over time, there have been some important fluctuations in the anchoring role of currencies, mainly of the US dollar. Especially around the times of global financial crisis such as the Asian crisis of the late-1990s, some emerging and developing economies appear to have temporarily abandoned (partly voluntary, partly forced) US dollar pegs, but in general the US dollar re-established itself quickly as the leading anchoring currency after each crisis episode. Also during the recent global financial crisis 2008-2009, the US dollar lost some of its anchoring role, as some large emerging market economies (e.g. Russia) were forced to temporarily abandon their exchange rate targets. Whether the US dollar’s leading anchoring role will re-emerge to pre-crisis levels remains to be seen and cannot be answered yet with the analysis in this study.
The paper finds that network effects related to trade and currency denomination of debt play a significant role in determining the anchor currency weights. The empirical analysis points to a significant role, especially in the case of the euro, for “transaction motives”, i.e., trade linkages and external debt denomination. As for the US dollar, regional factors also have a strong influence on the choice of the anchor currency. There is some evidence, following the launch of the euro in 1999, of an increasing role of trade relations in explaining the euro share, while an increasing role of debt denomination in explaining the US dollar share.
The results of the study have some important policy implications. The “US dollar block” within the emerging and developing country sphere has over the past decades remained very strong and important, despite temporary decouplings from the US dollar around the time of crises (e.g., Asian crisis). This appears to confirm the global relevance of the fear of floating argument and implies that the room for independent monetary policy conduct remains limited in the emerging and developing countries as a group. Also, as a result, global exchange rate configurations continue to be characterised by an element of inflexibility, as the lack of adjustment of some leading emerging and developing country currencies vis-à-vis the US dollar may complicate the adjustment of global trade imbalances.
The Federal Reserve’s actions, using the U.S. dollar as a reserve currency, contribute to numerous crises. The transmission mechanisms and transformation functions of banks lead to an unavoidable consequence: the devaluation of national currencies. This devaluation is seen as the only viable measure to preserve economic stability and maintain competitive advantages in an increasingly competitive global environment.
Despite its valuable findings, this study has certain limitations that should be acknowledged to provide a balanced interpretation of the results. It is difficul to set the timeframe for next substantial changes in the use of U.S. dollar as an anchor currency to many Governments, the power of BRICS's versus the G7's GDPs at purchasing power of parity is to be studied further, the status of reserve currency is to be studied at numerous quatitative methods, competion among key currencies usually brings new conditions and new challenges.
The study needs further reseaches on the possible shocks and bubbles that will flourish through markets in the next decades. Europe often struggles to turn ideas into new technologies that can drive growth. One reason is that it is much less able than the United States to channel its significant savings into scaling up innovation
.