Air pollution is a major public health concern in Bangladesh, contributing to significant respiratory and cardiovascular issues. The objective of this study is to monitor the Particulate Matters (PM1, PM2.5 & PM10) and Carbon Monoxide (CO) concentration based on different land use in Pabna district town. This study was conducted in 40 locations of Pabna district town, by using portable Air Quality Monitor, Indoor Outdoor Formaldehyde (HCHO) Detector (Model: DM106) and CO Meter (Model: AS8700A). It was found that, the average concentrations of PM1, PM2.5 & PM10 of 40 places in Pabna district town were 34.50, 57.02 and 73.43 µg/m3 respectively. The average concentration of PM2.5 and PM10 were found 2.28 and 1.49 times higher than World Health Organization (WHO) which is respectively. It is estimated that the average PM2.5 /PM10 was 77.63%, PM1 /PM2.5 was 60.46%. From the outcome of this research the studied land uses are arranged in descending order based on average concentration PM which follows as road intersection area > commercial area > mixed area > industrial area > residential area > sensitive area. Therefore, the findings underscore the urgent need for targeted air quality management strategies in Pabna district, particularly in high-pollution areas, to mitigate health risks associated with elevated particulate matter concentrations.
| Published in | Journal of Health and Environmental Research (Volume 11, Issue 3) |
| DOI | 10.11648/j.jher.20251103.14 |
| Page(s) | 76-88 |
| Creative Commons |
This is an Open Access article, distributed under the terms of the Creative Commons Attribution 4.0 International License (http://creativecommons.org/licenses/by/4.0/), which permits unrestricted use, distribution and reproduction in any medium or format, provided the original work is properly cited. |
| Copyright |
Copyright © The Author(s), 2025. Published by Science Publishing Group |
Particulate Matter, Gaseous Pollutants, Descriptive Statistic, Pabna District Town
S. N. | Land Use Type | Description | Number of Locations |
|---|---|---|---|
1 | Sensitive Area | Hospitals, clinics, schools, colleges, mosques, madrasas, temples, churches, administrative buildings | 9 |
2 | Residential Area | Primarily housing zones and residential neighborhoods | 3 |
3 | Mixed Area | Combination of markets, buildings, and main roads | 6 |
4 | Commercial Area | Business centers, shopping areas, and local markets | 6 |
5 | Road Intersection Aarea | Busy road junctions, bends, and high traffic zones | 5 |
6 | Industrial Area | Locations near factories and industrial establishments | 11 |
Total | 40 |
SL. | Parameters | Instrument | Model |
|---|---|---|---|
1. | PM1, PM2.5, PM10, HCHO, TVOC, Temperature, Humidity | Air Quality Monitor, Indoor Outdoor Formaldehyde (HCHO) Detector | Model: DM106; B07SCM4YN3 (Saiko) |
2. | Carbon Monoxide (CO) | Handheld Carbon Monoxide Meter | AS8700A (Smart Sensor / OEM) |
PM1 | ||||||
|---|---|---|---|---|---|---|
S. N. | Land Use | NoL | Range (µg/m3) | Mean (µg/m3) | Std. Deviation (µg/m3) | Coefficient of Variation (%) |
1 | Sensitive Area | 9 | 15.25 | 25.64 | 4.65 | 18.12 |
2 | Mixed Area | 6 | 32.50 | 36.83 | 13.47 | 36.58 |
3 | Residential Area | 3 | 8.50 | 29.17 | 4.26 | 14.61 |
4 | Road Intersection Area | 5 | 50.00 | 45.85 | 19.04 | 41.52 |
5 | Commercial Area | 6 | 26.50 | 40.63 | 10.86 | 26.74 |
6 | Industrial Area | 11 | 17.50 | 28.89 | 4.93 | 17.08 |
PM2.5 | ||||||
|---|---|---|---|---|---|---|
S. N. | Land Use | NoL | Range (µg/m3) | Mean (µg/m3) | Std. Deviation (µg/m3) | Coefficient of Variation (%) |
1 | Sensitive Area | 9 | 25.00 | 42.61 | 7.88 | 18.49 |
2 | Mixed Area | 6 | 52.00 | 60.75 | 21.29 | 35.04 |
3 | Residential Area | 3 | 11.00 | 48.25 | 5.65 | 11.71 |
4 | Road Intersection Area | 5 | 86.00 | 76.60 | 32.68 | 42.66 |
5 | Commercial Area | 6 | 41.50 | 65.88 | 17.32 | 26.30 |
6 | Industrial Area | 11 | 27.25 | 48.05 | 8.11 | 16.88 |
PM10 | ||||||
|---|---|---|---|---|---|---|
S. N. | Land Use | NoL | Range (µg/m3) | Mean (µg/m3) | Std. Deviation (µg/m3) | Coefficient of Variation (%) |
1 | Sensitive Area | 9 | 32.00 | 54.58 | 9.92 | 18.18 |
2 | Mixed Area | 6 | 67.00 | 78.29 | 27.74 | 35.43 |
3 | Residential Area | 3 | 16.50 | 62.25 | 8.30 | 13.33 |
4 | Road Intersection Area | 5 | 109.00 | 98.10 | 41.52 | 42.32 |
5 | Commercial Area | 6 | 54.25 | 85.71 | 22.51 | 26.26 |
6 | Industrial Area | 11 | 36.25 | 61.66 | 10.70 | 17.36 |
SI No | Land Use | Number of locations | Range (ppm) | Min. (ppm) | Max. (ppm) | Mean (ppm) | Std. Deviation (ppm) | Coefficient of Variation (%) |
|---|---|---|---|---|---|---|---|---|
1 | Sensitive Area | 9 | 7.00 | 0.00 | 7.00 | 0.78 | 2.33 | 300.00 |
2 | Mixed Area | 6 | 15.00 | 0.00 | 15.00 | 6.33 | 5.89 | 92.97 |
3 | Residential Area | 3 | 4.00 | 5.00 | 9.00 | 7.00 | 2.00 | 28.57 |
4 | Road Intersection Area | 5 | 37.00 | 0.00 | 37.00 | 20.00 | 15.72 | 78.58 |
5 | Commercial Area | 6 | 33.00 | 0.00 | 33.00 | 15.00 | 11.85 | 78.99 |
6 | Industrial Area | 11 | 31.00 | 0.00 | 31.00 | 12.73 | 9.26 | 72.79 |
Rank | Land use Type | Land Use | PM1 | PM2.5 | PM10 |
|---|---|---|---|---|---|
Road Intersection Area | Chadmari Moor | 78.25 | 132.25 | 169 | |
Commercial Area | Tula Potti | 54 | 85.5 | 112.25 | |
Mixed Area | Pabna Medical College | 51.25 | 85 | 108.75 | |
Sensitive Area | Chief Judicial Magistrate Court | 14.75 | 25 | 32 | |
Mixed Area | Public Library Pabna | 18.75 | 33 | 41.75 | |
Sensitive Area | Onukul Chandra Shotshonggo | 22.75 | 36.75 | 47.75 |
ECA | Energy and Clean Air |
DoE | Department of Environment, Bangladesh |
NAAQS | National Ambient Air Quality Standard |
PM | Particulate Matter |
UNEP | United Nations Environment Programme |
U.S. EPA | U. S. Environmental Protection Agency |
WHO | World Health Organization |
| [1] | WHO- World Health Organization (2024). Air pollution. Retrieved August 25, 2024, from |
| [2] | NRDC - Natural Resources Defense Council (2024). Clean air. Natural Resources Defense Council. Retrieved August 27, 2024, from |
| [3] | UNEP - United Nations Environment Programme (2023). Air Pollution Note: Data You Need to Know. UNEP. Retrieved August 27, 2024, from |
| [4] | World Bank (2022ᵃ). Fighting air pollution: A deadly killer and core development challenge. World Bank. Retrieved August 27, 2024, from |
| [5] | AQLI - Air Quality Life Index. (2023). AQLI top charts 2023. The University of Chicago, Energy Policy Institute. Retrieved from |
| [6] | UNICEF (2024). Disease burden of air pollution on children continues to rise in Bangladesh, according to latest report. UNICEF. Retrieved from |
| [7] | World Bank. (2022ᵇ). Bangladesh clean air and sustainable environment project implementation completion and results report (Report No. P168901). World Bank. Retrieved from |
| [8] |
U. S. EPA - U. S. Environmental Protection Agency (2024ᵃ). Particulate matter (PM) basics. Retrieved August 25, 2024, from
https://www.epa.gov/pm-pollution/particulate-matter-pm-basics |
| [9] | IQAir (2023). World Air Quality Report 2023. IQAir. Retrieved from |
| [10] | Thangavel, P., Park, D. and Lee, Y. (2022). Recent Insights into Particulate Matter (PM2.5)-Mediated Toxicity in Humans: An Overview. Int J Environ Res Public Health, 19(12), 7511. |
| [11] |
HEI - Health Effects Institute (2024). State of global air report 2024. Health Effects Institute. Retrieved August 27, 2024, from
https://www.stateofglobalair.org/resources/report/state-global-air-report-2024 |
| [12] | EIU - Economist Intelligence Unit (2024). The global liveability index 2024: Summary report. Economist Intelligence Unit. Retrieved August 27, 2024, from |
| [13] | Majumder, A. K., Hossain, S. M. A., Patoary, M. N. A., & Rahman, M. (2023). Spatial distribution of air quality in Netrokona district town, Bangladesh. Open Access Research Journal of Engineering and Technology, 5(1), 1-11. |
| [14] | Majumder, A. K., Mahmud, K. K., Rahman, M., Patoary, M. N. A., Gautam, S., and Tanima, K. R. (2025). Spatial distribution and health implications of particulate matter concentrations across diverse land use types in Dinajpur District, Bangladesh. Geosystems and Geoenvironment, 4(3), 100397, ISSN 2772-8838. |
| [15] | Majumder, A. K., Rahman, M., Patoary, M. N. A., Kamruzzaman, A. M. and Majumder, R. (2024ᵃ). Time Series Analysis PM2.5 Concentration for Capital City Dhaka from 2016 to 2023. Science Frontiers, 5(1): 35-42. |
| [16] | Majumder, A. K., Akbar, A. T. M. M., Rahman, M., Patoary, M. N. A., Islam, M. R., and Majumder, R. (2024ᵇ). Monsoon Season Spatial Distribution of Particulates Concentration in the Road Intersection Area of Different Land Use in Major City in South Asian Countries. Journal of Health and Environmental Research, 10(1): 15-28. |
| [17] | Dibya, T. B., Proma, A. Y. and Dewan, S. M. R. (2023). Poor Respiratory Health is a Consequence of Dhaka’s Polluted Air: A Bangladeshi Perspective. Environ Health Insights, 17: 11786302231206126. |
| [18] | Pabna District - Banglapedia. (2025). |
APA Style
Majumder, A. K., Ali, M. T. (2025). Urban Land Use and Particulate Matter Distribution During Winter: A Case Study of Pabna District Town, Bangladesh. Journal of Health and Environmental Research, 11(3), 76-88. https://doi.org/10.11648/j.jher.20251103.14
ACS Style
Majumder, A. K.; Ali, M. T. Urban Land Use and Particulate Matter Distribution During Winter: A Case Study of Pabna District Town, Bangladesh. J. Health Environ. Res. 2025, 11(3), 76-88. doi: 10.11648/j.jher.20251103.14
@article{10.11648/j.jher.20251103.14,
  author = {Ahmad Kamruzzaman Majumder and Mohammad Tariq Ali},
  title = {Urban Land Use and Particulate Matter Distribution During Winter: A Case Study of Pabna District Town, Bangladesh
},
  journal = {Journal of Health and Environmental Research},
  volume = {11},
  number = {3},
  pages = {76-88},
  doi = {10.11648/j.jher.20251103.14},
  url = {https://doi.org/10.11648/j.jher.20251103.14},
  eprint = {https://article.sciencepublishinggroup.com/pdf/10.11648.j.jher.20251103.14},
  abstract = {Air pollution is a major public health concern in Bangladesh, contributing to significant respiratory and cardiovascular issues. The objective of this study is to monitor the Particulate Matters (PM1, PM2.5 & PM10) and Carbon Monoxide (CO) concentration based on different land use in Pabna district town. This study was conducted in 40 locations of Pabna district town, by using portable Air Quality Monitor, Indoor Outdoor Formaldehyde (HCHO) Detector (Model: DM106) and CO Meter (Model: AS8700A). It was found that, the average concentrations of PM1, PM2.5 & PM10 of 40 places in Pabna district town were 34.50, 57.02 and 73.43 µg/m3 respectively. The average concentration of PM2.5 and PM10 were found 2.28 and 1.49 times higher than World Health Organization (WHO) which is respectively. It is estimated that the average PM2.5 /PM10 was 77.63%, PM1 /PM2.5 was 60.46%. From the outcome of this research the studied land uses are arranged in descending order based on average concentration PM which follows as road intersection area > commercial area > mixed area > industrial area > residential area > sensitive area. Therefore, the findings underscore the urgent need for targeted air quality management strategies in Pabna district, particularly in high-pollution areas, to mitigate health risks associated with elevated particulate matter concentrations.
},
 year = {2025}
}
TY  - JOUR
T1  - Urban Land Use and Particulate Matter Distribution During Winter: A Case Study of Pabna District Town, Bangladesh

AU  - Ahmad Kamruzzaman Majumder
AU  - Mohammad Tariq Ali
Y1  - 2025/09/09
PY  - 2025
N1  - https://doi.org/10.11648/j.jher.20251103.14
DO  - 10.11648/j.jher.20251103.14
T2  - Journal of Health and Environmental Research
JF  - Journal of Health and Environmental Research
JO  - Journal of Health and Environmental Research
SP  - 76
EP  - 88
PB  - Science Publishing Group
SN  - 2472-3592
UR  - https://doi.org/10.11648/j.jher.20251103.14
AB  - Air pollution is a major public health concern in Bangladesh, contributing to significant respiratory and cardiovascular issues. The objective of this study is to monitor the Particulate Matters (PM1, PM2.5 & PM10) and Carbon Monoxide (CO) concentration based on different land use in Pabna district town. This study was conducted in 40 locations of Pabna district town, by using portable Air Quality Monitor, Indoor Outdoor Formaldehyde (HCHO) Detector (Model: DM106) and CO Meter (Model: AS8700A). It was found that, the average concentrations of PM1, PM2.5 & PM10 of 40 places in Pabna district town were 34.50, 57.02 and 73.43 µg/m3 respectively. The average concentration of PM2.5 and PM10 were found 2.28 and 1.49 times higher than World Health Organization (WHO) which is respectively. It is estimated that the average PM2.5 /PM10 was 77.63%, PM1 /PM2.5 was 60.46%. From the outcome of this research the studied land uses are arranged in descending order based on average concentration PM which follows as road intersection area > commercial area > mixed area > industrial area > residential area > sensitive area. Therefore, the findings underscore the urgent need for targeted air quality management strategies in Pabna district, particularly in high-pollution areas, to mitigate health risks associated with elevated particulate matter concentrations.

VL  - 11
IS  - 3
ER  -
Department of Environmental Science, Stamford University Bangladesh, Dhaka, Bangladesh;Center for Atmospheric Pollution Studies (CAPS), Dhaka, Bangladesh
Department of Environmental Science, Stamford University Bangladesh, Dhaka, Bangladesh
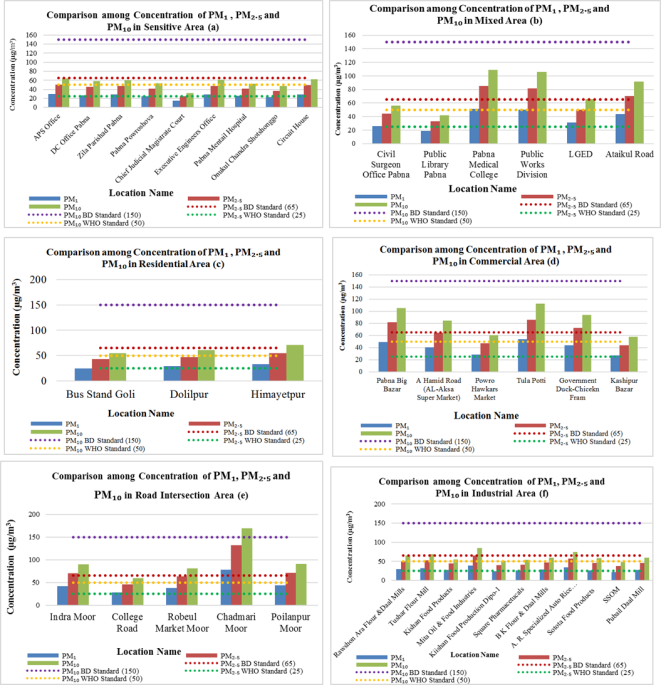
Figure 1. Comparison among average Concentration of PM1, PM2.5 & PM10 in Different Land Use.
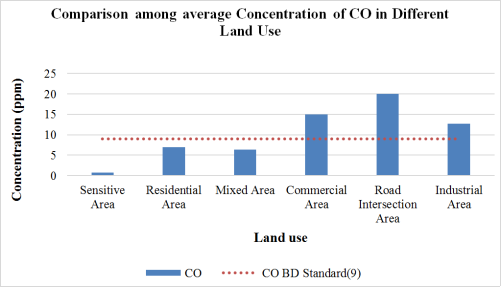
Figure 2. Comparison among average Concentration of CO in Different Land Use.
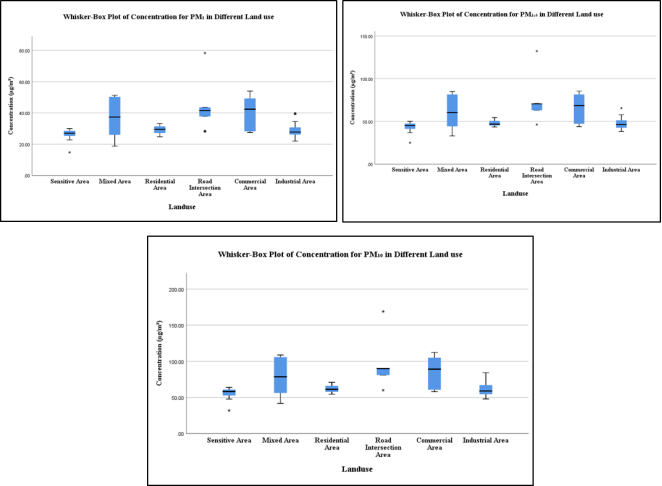
Figure 3. Whisker Box Plot of the Concentration of PM1, PM2.5 & PM10 in Different Land use.
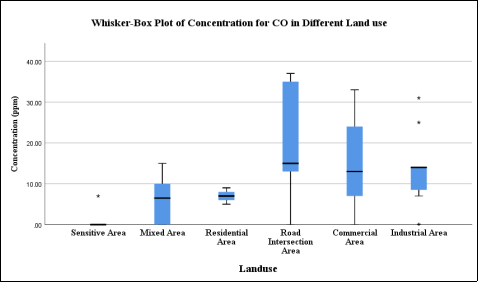
Figure 4. Whisker Box Plot of the Concentration of CO in Different Land use.
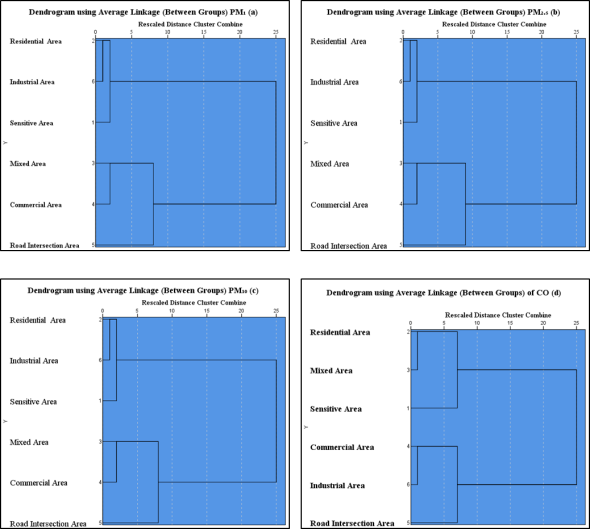
Figure 5. Land Use Based Cluster Analysis of PM1, PM2.5, PM10 and CO.
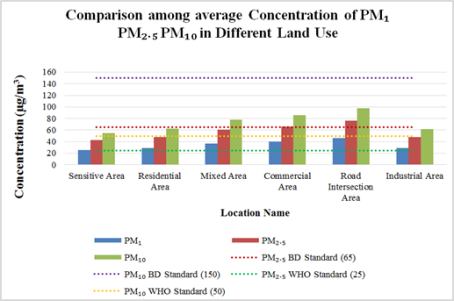
Figure 6. Comparison among Average Concentration of PM1, PM2.5 & PM10.
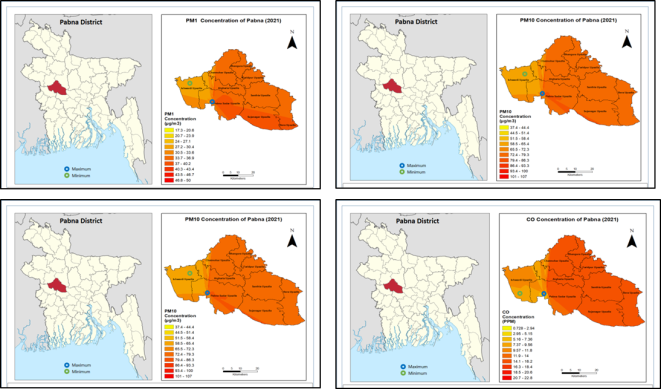
Figure 7. PM1, PM2.5, PM10 and CO Concentration of Pabna District Town.
Information

