Research Article | | Peer-Reviewed

Quantitative Structure Photovoltaic Properties Relationship of Coumarin Dyes Derived

Received: 18 July 2024     Accepted: 26 August 2024     Published: 11 September 2024
Views:       Downloads:
Abstract

The performance of an organic solar cell is strongly influenced by the structure of the photosensitizer. In this work, the open-circuit voltage (VOC) and conversion efficiency (η) of a series of coumarin dyes are quantitatively related to the structure of nine coumarin derivatives. The Quantitative Structure Property Relationship (QSPR) is performed using the statistical method of multiple linear regression. In addition, descriptors determined from the ground state at the Cam_B3lyp/6-31G(d, p) level of theory and from the 2D structure of the molecules are mathematically related to the photovoltaic properties. These VOC and η models are accredited with very good statistical indicators (R2 = 0.906 and 0.918; Qcv2= 0.845 and 0.849; S= 0.045 and 0.112; F = 14.524 and 16.846). These statistical indicators confirm the robustness and performance of the models developed. The results show that Voc improves with decreasing surface tension (ts) and increasing number of cycles (cycle). As for the conversion efficiency of light radiation into electrical energy, it is optimal when the light harvesting efficiency (LHEth) and the excited state lifetime (τth) are high. In conclusion, these models have good predictive capabilities and can be used to predict and explain the open-circuit voltage and efficiency of coumarin derivatives that belong to the same field of application.

Published in Modern Chemistry (Volume 12, Issue 2)
DOI 10.11648/j.mc.20241202.12
Page(s) 33-46
Creative Commons

This is an Open Access article, distributed under the terms of the Creative Commons Attribution 4.0 International License (http://creativecommons.org/licenses/by/4.0/), which permits unrestricted use, distribution and reproduction in any medium or format, provided the original work is properly cited.

Copyright

Copyright © The Author(s), 2024. Published by Science Publishing Group

Keywords

Solar Cell, Coumarin, DFT, QSPR

1. Introduction
Dye-Sensitized Solar Cells (DSSCs) are a solar cell technology using organic dyes to absorb light and generate electricity . DSSCs are promising alternative to traditional silicon solar cells because they are less expensive to produce and can be made from abundant materials . The dyes used in DSSCs are generally organic compounds that exhibit light absorption properties in the visible range (figure 1).
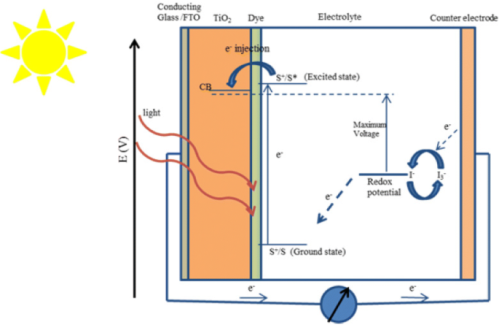
Figure 1. Different constituents and functioning principle of a DSSC.
DSSCs are composed of several layers . Dye layer, usually based on organic dyes such as coumarins, is adsorbed onto a layer of porous semiconductor material, called electrode material. When sunlight hits dye and it is excited, it releases electrons. These electrons are then captured by electrode material. Subsequently, holes left by the electrons are filled by electrons from a liquid electrolyte or solid material in the opposite layer of DSSC. Dye behaves like an electron pump.
There are several types of dyes, including ruthenium-based dyes, phosphine derivatives and coumarin derivatives Coumarin-derived photosensitizers . are synthetic and natural organic compounds found in the plant kingdom . The dye C343 is the basic motif for the development of coumarin-derived photosensitizers . Coumarin dyes offer several advantages for use in DSSCs. They have good light absorption capacity in the visible spectrum, enabling them to convert efficiently solar energy into electricity. In addition, coumarins can be synthesized with a wide variety of molecular structures, enabling researchers to modify their light absorption properties and facilitate electron transfer. Coumarins are chemical compounds with a characteristic structure called a coumarin core. The addition of specific functional groups enhances light absorption, while the use of special molecular structures facilitates electron transfer. Our study focuses on coumarin photosensitizers. This class of solar cell dyes is based on the π-conjugated donor-acceptor (D-π-A) structure) . The donor is coumarin, which contains an amino group in its structure. The acceptor is cyano acrylic acid. In these compounds, the spacer is a π-conjugated system. It consists of thiophene or methine substituents .
Coumarin-based DSSCs show promising results, with solar-to-electricity conversion efficiencies up to more than 10%. However, it should be noted that coumarin-based DSSCs are not yet widely commercialized and challenges remain to improve their long-term stability. Therefore, in order to improve the performance of these systems, it is important to understand the origin of their photovoltaic properties. The overall objective of this study is to establish a quantitative structure- photovoltaic property relationship (QSPR) for a series of nine coumarin derivatives. The QSPR methodology used in this work consists of establishing a mathematical property function whose variables are molecular descriptors .
2. Material and Methods
2.1. Material and Method of Calcul
The molecular descriptors used in the models are obtained from the 2D structure of the dyes and the ground state molecule. The 2D and 3D descriptors are determined using Chemsketch and Gaussian 09 Rev A.02 software, respectively . The minimum energy state is obtained after optimization and frequency calculation. In this study, the density functional theory (DFT) method at Cam-B3LYP/6-31G(d,p) is employed for geometry optimization and frequency calculation. In addition to DFT, time-dependent DFT (TD-DFT) is used to simulate excited states. This calculation is performed at the TD-Cam-B3LYP/6-31G(d,p) level.
The experimental database consists of nine molecules whose photovoltaic properties in derived solar cells have been determined under the same conditions . Compound C343 is the reference. These compounds absorb in the visible region. The introduction of methine (-CH=CH-) groups linked to cyano (-CN) and carboxyl (-COOH) in the structure increases the extent of conjugation. Figure 2 shows the structures of the compounds studied.
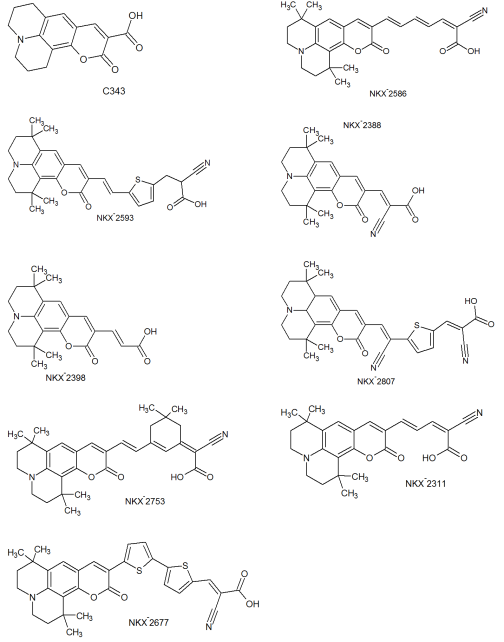
Figure 2. Structures of the coumarin derivatives studied.
Moreover, the introduction of thiophene not only increases conjugation but also stabilizes and performs photovoltaic without affecting absorption properties. Table 1 displays the photovoltaic property values of the coumarin dye solar cells studied.
Table 1. Absorption wavelengths of the coumarin derivatives studied and performance of the corresponding DSSCs).

Colorant

λmaxabs(nm)

Jsc (mA cm-2)

VOC (V)

ff

η(%)

C343

442

4.100

0.410

0.560

0.900

NKX-2311

504

15.200

0.550

0.620

5.200

NKX-2388

493

12.900

0.500

0.640

4.100

NKX-2398

451

11.100

0.510

0.600

3.400

NKX-2586

506

15.100

0.470

0.500

3.500

NKX-2593

510

14.700

0.670

0.730

7.200

NKX-2677

511

14.300

0.730

0.740

7.700

NKX-2753

492

16.100

0.600

0.690

6.700

NKX-2807

566

14.300

0.510

0.730

5.300

These molecules are divided in two groups where six molecules form our training set and three molecules are used for validation.
Experimental properties can be mathematically related to theoretical descriptors. However, if the order of the property under investigation varies from one molecule to another, then the inverse of the base-10 logarithm of the property shall be used.
2.2. Data Analysis Methods
The aim of these methods is to analyze the structural data in order to identify the factors that determine the measured activity.
Some are linear, such as Simple Linear Regression (SLR), Multiple Linear Regression (MLR) and Partial Least Squares (PLS) . Others are non-linear, such as decision trees , neural networks , and genetic algorithms . These methods are available in software such as Excel . Origin Microcal, Minitab, XLSAT Statistica, SPSS, to cite only those.
The statistical analysis method used in our study is the Multiple Linear Regression (MLR) method available in XLSAT .
The selection of the best models is based on certain statistical indicators. These include the coefficient of determination R (and its square R2), the standard deviation S, and the Fischer coefficient F. The statistical quality of a model is determined by these three criteria . They allow us to assess the accuracy of the values calculated on the test set and describe the internal predictive ability of the model. The coefficient of cross-determination QCV 2estimates the external predictive ability of the model. R2, S and F refer to the fit between calculated and experimental values: they describe the predictive capacity within the limits of the model and allow us to estimate the accuracy of the values calculated on the training set . The cross-validation correlation coefficient QCV 2provides information about the predictive power of the model. This predictive power is called "internal" because it is calculated from the structures used to build the model.
The coefficient of determination R2 provides an assessment of the dispersion of theoretical values around experimental values.The quality of the model is best when the points are close to the line of best fit . The fit of the points to this line can be assessed by the correlation coefficient:
R2=1-yi,exp-ŷi,théo2yi,exp-y̅i,exp2 (1)
Where:
𝑦𝑖, 𝑒𝑥: Experimental value of the photovoltaic property
𝑦𝑖, 𝑡ℎé: Theoretical value of the photovoltaic property
𝑦𝑖, 𝑒𝑥: Average value of the experimental values of the photovoltaic property
The closer the R² value is to 1, the more the theoretical and experimental values are correlated. Furthermore, the variance σ2 is determined by relationship 2:
σ2=s2=yi,exp-yi,théo2n-k-1 (2)
Where k is the number of independent variables (descriptors), n is the number of molecules in the test or training set and n-k-1 is the degree of freedom.
The standard deviation S:
S=yi,exp-yi,théo2n-k-1 (3)
The Fisher F index is used to measure the level of statistical significance of the model, i.e. the quality of the choice of descriptors making up the model.
F=yi,théo-yi,exp2yi,exp-yi,théo2*n-k-1k(4)
The coefficient of determination for cross-validation QCV2 is calculated using the following relationship:
Qcv2=yi,théo-y̅i,exp2-yi,théo-yi,exp2yi,théo-y̅i,exp2(5)
For Eriksson and al. the performance of a mathematical model is characterised by a value of QCV2 > 0.5 for a satisfactory model. The model is said to be excellent if QCV2 > 0.9. According to them, given a test set, a model will perform well if the acceptance criterion R2- Qcv2< 0,3 is met.
2.3. Interpretation and Validation of a QSPR Model
2.3.1. Internal Validation
The influence of compounds in the training set on the model is estimated by internal validation methods. Internal validation of a QSPR model is performed using LOO (Leave-One Out) or LMO (Leave-Many Out) cross-validation, which is quantified by the coefficient QCV2. In this process, a certain number k of molecules are extracted from the initial set of N molecules, and a new model is built with the remaining (N-k) molecules using the selected descriptors (only the regression constants change). This process is then repeated to remove and predict the values of all the molecules in the training set. Depending on the number of molecules removed at each iteration, this refers to Leave-One-Out (LOO) or Leave-Many-Out (LMO), as one or more molecules are removed .
2.3.2. Randomization
To ensure the reliability of a RQSP/RQSA model, randomization tests are one of the most widely used techniques. The randomization test is used to assert that the good correlations between the descriptors and the activity or property presented by the RQSA/ RQSP model are not due to chance. To do this, the observations are disordered, for example ten times, by randomly changing the activity column, but the descriptor columns remain unchanged. The result is ten models with specific statistical characteristics. If the randomization of observations leads to reliable predictive models, then the predictive abilities of the constructed RQSA/ RQSP model are not due to chance correlations .
2.3.3. External Validation
External validation tests the reliability and predictive power of the QSAR/QSAR model. The model is applied to a set of molecules not used in its development to determine the correlation between calculated and experimental activities. The higher the correlation, the better the model's ability to predict activities for molecules outside the training set . The set of molecules used in this framework is called the validation set. This validation is characterized by the parameters R2 (test) QCV2 (test). Model validation can be performed by calculating the cross-validation regression coefficient QCV2 and the quotient (or ratio) of the theoretical activity to the experimental activity.
This ratio is calculated using the validation set. The model is considered to perform well if QCV2 or the ratio is close to one.
Other criteria can be used to check the predictive power of RQSP/RQSA models. They are known as "external validation criteria" or "Tropsha criteria" .
External validation criteria (test series)
RTest2>0,7(Criteria 1)
QCv Test2>0,6(Criteria 2)
RTest2-R020,3(Criteria 3)
RTest2-R02RTest2<0,1et0,85k1,15(Criteria 4)
RTest2-R'02RTest2<0,1et0,85k'1,15(Criteria 5)
With
R2: Correlation coefficient for molecules in the test series.
R02: Correlation coefficient between predicted and experimental values for the test series.
R0'2: Correlation coefficient between experimental and predicted values for the test series.
k: is the constant of the correlation line (at the origin) (predicted values vs. experimental values).
k': is the constant of the correlation line (at the origin) (experimental values versus predicted values).
2.4. Photovoltaic Properties Studied
2.4.1. Light Harvesting Efficiency (LHE)
The electron injection efficiency can be approximated theoretically by calculating the light harvesting efficiency (LHE) of the dyes. This value must be as high as possible to maximize the induced photocurrent. The LHE is determined by the following expression:
LHE = 1 – 10-A= 1 – 10-f(6)
A (or f) is the oscillator strength of the electronic transition of greatest absorbance.
2.4.2. Conversion Efficiency
The conversion efficiency of a system can be calculated from the short-circuit current density (JSC), the open-circuit voltage (VOC), the form factor (ff) and the light intensity IS:
η=JSCVOCffIS(7)
In addition to the properties of the semiconductor and the redox mediator, the photo-physical and electrochemical properties of the photosensitizer will be largely responsible for the cell's performance. Indeed, its oxidation potential will determine the maximum Voc and the absorption properties will determine the short-circuit current .
From this expression, JSC and IS cannot be calculated theoretically. The open-circuit voltage (VOC) is a function of the dye's LUMO energy and the TiO2 conduction band energy by the following expression:
VOC=1e(ELUMO- ECB)(8)
A higher LUMO value results in a higher VOC value.
2.4.3. Excited STATE Lifetime τ
The excited state lifetime is an important factor in the evaluation of the charge transfer efficiency of the dye. A dye with a long excited state lifetime will have an easy electron transfer. The excited state lifetime is calculated by the following formula :
τ=1,499fE2(9)
E and f represent the transition energy and transition oscillator strength respectively.
3. Results and Discussion
3.1. Molecular Descriptors and QSAR Models Obtained
A QSPR model is built from a database of experimental data, but most importantly from molecular descriptors. A large number of descriptors are available. In the case of this study, the 2D and 3D descriptors used (Table 1) are determined using Chemsketch and Gaussian 09 software, respectively . The 3D descriptors are obtained from the geometry of the ground state. This minimum energy state is obtained after geometry optimization and frequency calculation using the DFT method at the Cam-B3LYP/6-31G(d,p) level. Table 2 shows the descriptors used in the QSPR model and the values of the photovoltaic properties determined experimentally. The photovoltaic properties, the open circuit voltage VOC and the conversion efficiency η, are the subject of the study.
Table 2. Molecular descriptors used in the QSPR models.

CODE

Descriptors

Photovoltac property

Colorant

ts

cycle

LHEth

τth

pɳexp

Vocexp

C343

73.900

4

0.832

0.049

0.046

0.410

NKX-2388

64.300

4

0.888

0.136

-0.613

0.500

NKX-2586

61.900

4

0.992

0.078

-0.544

0.470

NKX-2677

74.200

6

0.98

0.107

-0.886

0.730

NKX-2753

59.000

5

0.986

0.085

-0.826

0.600

NKX-2807

73.000

5

0.985

0.09

-0.724

0.510

NKX-2311

62.900

4

0.972

0.095

-0.716

0.550

NKX-2398

58.500

4

0.806

0.155

-0.531

0.510

NKX-2593

68.200

5

0.986

0.096

-0.857

0.670

The interdependence of both descriptors is elucidated by a correlation matrix analysis (Table 2). The descriptors used in a QSPR model must be independent of each other. This non-dependence is verified for a cross-correlation coefficient aij less than 0.7. Examination of Table 3 shows that all aij coefficients are less than 0.7. Hence, the descriptors used in the different models are independent of each other.
Table 3. Cross Correlation Coefficients for Descriptors Used in QSPR Models.

Variables

LHEth

τth

ts

cycle

LHEth

1

0.188

-0.305

0.566

τth

0.188

1

-0.189

0.216

ts

-0.305

-0.189

1

0.345

cycle

0.566

0.216

0.345

1

Using linear regression, the descriptors are mathematically related to the photovoltaic property: this is called a QSPR model. The number of descriptors involved in a model must be equal to 1/5 of the number of molecules in the series studied. In our study, the models obtained are a function of two descriptors corresponding to 1/5 of the nine molecules of the coumarin series studied.
For the purposes of this study, this experimental database is divided into two parts. A first set of six molecules constitutes the learning set, while the remaining three molecules constitute the validation set. The validation set for the QSPR conversion efficiency model consists of the compounds NKX-2593, NKX-2677 and NKX-2807, while the validation set for the QSPR open circuit voltage VOC model consists of the molecules NKX-2311, NKX-2398 and NKX-2593.
The best QSPR model obtained for open circuit voltage is a function of the 2D descriptor surface tension (ts) and the number of cycles contained in the coumarin derivative structure (cycle). The equation for this QSPR open circuit voltage model is:
Vocexp= 0.19124 – 0.00455*ts + 0.14001*cycle(10)
The negative surface voltage coefficient indicates that an increase in the value of this parameter reduces the open-circuit voltage. However, increasing the number of cycles will increase the open-circuit voltage of the photovoltaic cell.
The relative contribution of the descriptors to open-circuit voltage prediction (Figure 3) is also studied.
Examination of the contributions shows that the conversion efficiency of a solar cell is closely related to its light-harvesting efficiency and the lifetime of the excited state of the photosensitizer. Examination of this equation shows that pɳexp increases as LHEth and τth decrease. In other words, the conversion efficiency ɳexp increases as LHEth and τth increase. Light-harvesting efficiency is the key to maximizing electricity production from solar energy. Solar panels are designed to capture sunlight and convert it to electricity. The efficiency of solar panels depends on factors such as the quality of the materials used, the panel design, and the ability to absorb sunlight efficiently over a wide range of wavelengths. Thus, improving light-harvesting efficiency is a constant goal to optimize the performance of optical devices and maximize energy yields. The excited state lifetime of a photosensitizer, also known as the excitation lifetime, refers to the amount of time the photosensitizer remains in an excited state after absorbing light. This parameter is important in fields such as photobiology, photochemistry, and photodynamics. The longer the excitation lifetime, the greater the chance that the chromophore will transfer its electron to the semiconductor, such as titanium dioxide.
Furthermore, in this model, the light harvesting efficiency (LHEth) is the primary descriptor in predicting the conversion yield of coumarin derivatives. This is clarified by analyzing the contribution of each descriptor (Figure 4). The number of aromatic rings is the main descriptor. Thus, an increase in the number of cycles, and therefore in the extent of conjugation, improves open-circuit voltage. In fact, in cycles, electrons do not belong to the atoms but to the cycle, which increases their mobility.
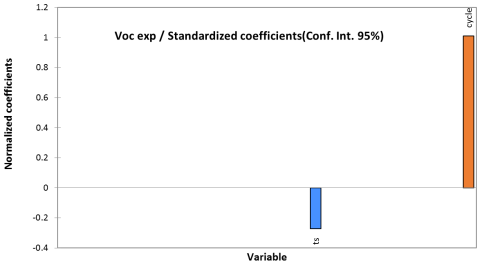
Figure 3. Contribution of the various descriptors used in the model.
In addition to open-circuit voltage, the conversion efficiency η of light radiation into electrical energy is related to descriptors. The conversion efficiency η is a key parameter for assessing the efficiency of converting light energy into electrical energy. Using the multilinear regression method, the opposite of the logarithm to base ten (pɳexp = -log(ɳexp)) is mathematically related to descriptors. Table 2 shows the values of the descriptors and the photovoltaic property under study.
The equation of the QSPR-pɳexp model is as follows:
exp= 3.13044-3.35340*LHEth-6.02687*τth(11)
The conversion efficiency of a solar cell is closely related to its light-harvesting efficiency and the lifetime of the excited state of the photosensitizer. Examination of this equation shows that pɳexp increases as LHEth and τth decrease. In other words, the conversion efficiency ɳexp increases as LHEth and τth increase. Light-harvesting efficiency is the key to maximizing electricity production from solar energy. Solar panels are designed to capture sunlight and convert it to electricity. The efficiency of solar panels depends on factors such as the quality of the materials used, the panel design, and the ability to absorb sunlight efficiently over a wide range of wavelengths. Thus, improving light-harvesting efficiency is a constant goal to optimize the performance of optical devices and maximize energy yields. The excited state lifetime of a photosensitizer, also known as the excitation lifetime, refers to the amount of time the photosensitizer remains in an excited state after absorbing light. This parameter is important in fields such as photobiology, photochemistry, and photodynamics. The longer the excitation lifetime, the greater the chance that the chromophore will transfer its electron to the semiconductor, such as titanium dioxide.
Furthermore, in this model, the light harvesting efficiency (LHEth) is the primary descriptor in predicting the conversion yield of coumarin derivatives. This is clarified by analyzing the contribution of each descriptor (Figure 4).
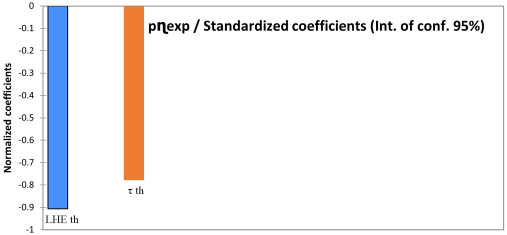
Figure 4. Contribution of descriptors in the QSPR-pɳexp model.
3.2. Internal and External Validation of the QSPR Models
3.2.1. Internal Validation and Significance of the Models
The statistical indicators for the QSPR-VOC and QSPR-ɳexp models are shown in Table 4.
Table 4. Statistical indicators.

QSPR model

Voc

ɳexp

Indicators statistical

Value

Number of compounds N

9

Correlation coefficient of the regression line R2

0.906

0.918

Prediction correlation coefficient Qcv2

0.845

0.849

Standard Deviation

0.045

0.112

Validation of Fischer F

14.524

16.846

Confidence level α

95%

Statistical analysis was used to determine the significance of the model. The values of the statistical indicators determined are summarized in Table 4.
The values of the statistical indicators listed in this table reflect a good correlation of the property with surface tension and the number of cycles in the different molecules. The correlation coefficient 𝑅2 indicates that 90.64% of the molecular descriptors were taken into account in establishing the model. Moreover, the standard deviation of 0.045 reflects the consistency of the method used. The significance of the model is given by the Fischer coefficient F= 14.524: this high value reflects a strong relationship between the photovoltaic property and the descriptors used in the model. Also, the value of the QCV2 cross-validation coefficient of determination is 0.845. This value (greater than 0.5 and close to 0.9) indicates that the model is highly satisfactory. The acceptability of this model is proven by calculating the absolute value of the difference between 𝑅2 and QCV2. This difference (0.062), which is less than 0.3, testifies the model's acceptability.
As for the QSPR-ɳexp model, molecular descriptors (LHE et τ) are taken into account at 91.82%, with a standard deviation of 0.112. This model is significant with a Fischer coefficient (F= 16.846) above the Fischer threshold. This indicator shows a strong relationship between conversion yield and the descriptors. This model is acceptable and very satisfactory with a cross-validation correlation coefficient QCV2 = 0.849 ˃ 0.5 and R2-Qcv2=0,069 < 0,3.
Internal validation is achieved by calculating Roy's parameter. This key parameter of the randomization test is obtained after ten (10) iterations. The randomization test is performed only on the compounds in the test set, as the model is based on these. We have limited ourselves to ten iterations. The randomized coefficients of determination (R2r) for each iteration are given in the following Table 5:
Table 5. Randomized coefficients of determination (R2r).

QSPR-VOC model

Iterations

1

2

3

4

5

6

7

8

9

10

Rr2

0,841

0,842

0,535

0,012

0,092

0,027

0,027

0,101

0,101

0,101

QSPR- ɳexp model

Iterations

1

2

3

4

5

6

7

8

9

10

Rr2

0,852

0,804

0,840

0,321

0,276

0,711

0,790

0,472

0,461

0,251

Roy's parameter (R2p =0.679 and 0.506) is lower than the model's R2 coefficient (0.911), so we can confirm that the pattern established is not due to chance.
3.2.2. External Validation of QSPR Models
External validation is carried out using the ratio (Theoretical property/Experimental property) and the Trophsa criteria. The Vocth/Vocexp ratio is determined for all nine molecules. The values are shown in Table 6.
The values of the Vocth/Vocexp ratio of the validation set, which tend towards unity (Table 6.), reflect the good correlation between the theoretical and experimental open-circuit voltage of coumarin molecules.
The model can therefore be used to predict the properties of other coumarin molecules. These observations are confirmed by the regression line corresponding to the QSPR-Voc model (Figure 5). The blue points correspond to the test set and the red points correspond to the validation set. In addition to the Vocth/Vocexp ratio, Tropsha criteria are used for external model validation. The Tropsha criteria are listed in Table 7.
Table 6. Experimental and theoretical open-circuit voltage values of the QSPR-Voc model.

Colorants

Vocexp

Vocth

Vocth/Vocexp

Training set

C343

0.410

0.415

1.013

NKX-2388

0.500

0.459

0.918

NKX-2586

0.470

0.470

1.000

NKX-2677

0.730

0.694

0.951

NKX-2753

0.600

0.623

1.038

NKX-2807

0.510

0.559

1.097

Validation set

NKX-2311

0.550

0.465

0.846

NKX-2398

0.510

0.485

0.951

NKX-2593

0.670

0.581

0.867

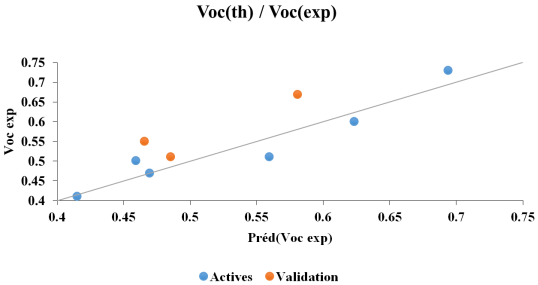
Figure 5. Model linear regression line QSPR-Voc.
Table 7. Tropsha Criteria.

Tropsha criteria

RTest2

Qcv Test2

RTest2-R02

RTest2-R02RTest2

RTest2-R0'2RTest2

k

k’

QSPR-Voc model

0.845

0.845

0

0

0.007

1.131

0.886

QSPR-ɳ model

0.849

0.849

0

0

0.172

0.916

1.088

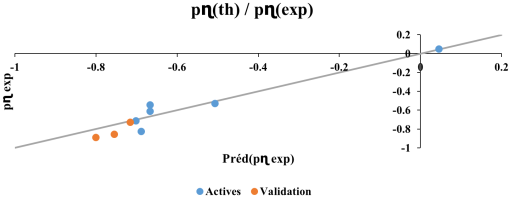
Figure 6. Model linear regression line QSPR-pɳ.
All values satisfy the Tropsha criteria, so these models are acceptable for predicting the photovoltaic properties of coumarins.
External validation of this QSPR-nexp model is performed using the pnth/pnexp ratio and Tropsha criteria. The pnth/pnexp ratio values reported in the table are close to unity. These values indicate the good correlation between theoretical and experimental conversion efficiencies. This is illustrated by the model's regression line (figure 6). This model therefore offers a better prediction of the conversion yields of the coumarin derivatives in the validation set.
Table 8. pnth/pnexp ratio values.

Colorants

pɳ exp

th

pnth/pnexp

Training set

C343

0.046

0.045

0.986

NKX-2311

-0.716

-0.702

0.980

NKX-2388

-0.613

-0.667

1.089

NKX-2398

-0.532

-0.507

0.953

NKX-2586

-0.544

-0.666

1.225

NKX-2753

-0.826

-0.688

0.833

Validation set

NKX-2593

-0.857

-0.755

0.880

NKX-2677

-0.887

-0.801

0.903

NKX-2807

-0.724

-0.715

0.987

With respect to the Tropsha criteria listed in Table 8, examination of this table shows that all five Tropsha criteria are met. Therefore, this model is acceptable for predicting the photovoltaic properties of coumarins that belong to the same field of application.
3.3. Scope of Applicability
A QSPR model can be used to determine the property value for systems belonging to the same family. However, this prediction is only possible if the system belongs to the same applicability domain. This applicability domain is obtained by determining the threshold lever from the standardized residuals. Analysis of this graph indicates that a molecule belongs to the same applicability domain if the value of its lever is less than 1 (hthreshold =1).
A QSPR model cannot be considered universal because it is developed on a limited number of compounds that do not cover the entire chemical space. For this reason, the predicted property of a compound that is chemically dissimilar to the training set cannot be considered reliable. The applicability domain defines the range in which a compound can be predicted with confidence. It therefore corresponds to the region of chemical space that includes compounds from the training set and similar, nearby compounds in the same space. This region is defined by a threshold lever. For the QSPR model, the threshold lever is one (Figures 7 and 8). Thus, the prediction of the conversion yield of a coumarin derivative using this model is reliable only if the compound has a leverage value less than unity.
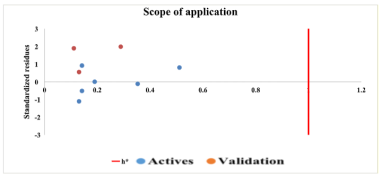
Figure 7. Domain of application of QSPR-Voc model.
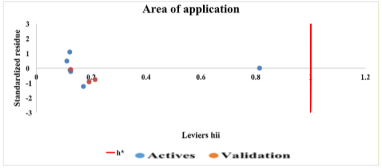
Figure 8. Scope of application of the QSPR-conversion efficiency model.
4. Conclusion
In this work, the photovoltaic properties of a series of nine coumarin derivatives are related to molecular descriptors using QPSR methodology. The photovoltaic properties studied are open circuit voltage and conversion efficiency. Molecular descriptors are related to these photovoltaic properties using multiple linear regression. The best QSPR model obtained for the open-circuit voltage is a function of the surface tension (ts) and the number of aromatic rings in the coumarin derivative structure. As for the light conversion efficiency, the best QSPR model obtained depends on the light harvesting efficiency (LHEth) and the excited state lifetime (τth). Furthermore, the open-circuit voltage is strongly influenced by the aromatic ring number, while the conversion efficiency is closely related to the light collection efficiency. These VOC and η models are accredited with very good statistical indicators R2 = 0.906 – 0.918; Qcv2= 0.845 – 0.849; S= 0.045 – 0.112; F=14.524 – 16.846, highlighting their acceptability and performance in predicting open-circuit voltage characteristics and conversion efficiency (VOC and ɳ). These models are not arbitrary. All five Tropsha criteria are met, demonstrating the predictive effectiveness of the established models. The significance of these two QSPR models through validity tests and ranges of applicability will play an important role in understanding the relationship between the selected descriptors and the photovoltaic properties of coumarin derivatives. This study could help us to design new photovoltaic compounds of coumarin derivatives with improved properties.
Abbreviations

DSSC

Dye-Sensitized Solar Cells

QSPR

Quantitative Structure- Property Relationship

DFT

Density Functional Theory

TD-DFT

Time-Dependent DFT

SLR

Simple Linear Regression

MLR

Multiple Linear Regression

PLS

Partial Least Squares

LOO

Leave-One Out

LMO

Leave-Many Out

VOC

Open-Circuit Voltage

Author Contributions
Nobel Kouakou N’guessan: Conceptualization, Formal Analysis, Methodology
Mamadou Koné Guy Richard: Formal Analysis, Methodology, Writing – original draft
Ouattara Wawohinlin Patrice: Formal Analysis, Methodology
Dembélé Georges Stéphane: Methodology, Software, Validation, Writing – original draft
Kafoumba Bamba: Formal Analysis, Supervision, Writing – original draft
Nahossé Ziao: Formal Analysis, Methodology, Supervision, Writing – original draft
Conflicts of Interest
The authors declare no conflicts of interest.
References
[1] B. O’Regan et M. Graetzel, «A Low-Cost, High-Efficiency Solar Cell Based on Dye Sensitized Colloidal TiO2 Films» Nature, vol. 353, p. 737 – 740, 1991.
[2] A. I. E. Duarte, A. L. L. Cruz, A. Marquina, J. A. A. Martínez, A. G. Juárez et C. Z. Islas, «One-step method to simultaneously grow TiO2 compact and porous layers for DSSC photoelectrodes» Appl Nanosci, vol. 14, p. 819–826, 2024.
[3] A. Saraswathi, N. Shobanadevi, M. Muthupriya, M. B. M. Yusuf et T. A. Sheeba, «Synergistic Incorporation of 2D Graphitic Carbon Nitride into Bimetal Oxide Photoanodes Towards Higher-Performance DSSCs» J. Electron. Mater, vol. 53, p. 3384–3397, 2024.
[4] S. A. Abrol, C. Bhargava et P. Sharma, «Fabrication of DSSC using doctor blades method incorporating polymer electrolytes,» Mater. Res. Exp., vol. 8, p. 045010, 2021.
[5] N. K. N’guessan, K. Bamba, W. P. Ouattara et N. Ziao, «Theoretical Investigation of Structural and Electronic Properties of Ruthenium Azopyridine Complexes Dyes for Photovoltaic Applications by Using DFT and TD-DFT Methods,» European Scientific Journal, vol. 14, n° %121, p. 1857 – 7881, 2018.
[6] N. T. Sethu et S. Shanmugan, «Towards sustainable solar cells: unveiling the latest developments in bio-nano materials for enhanced DSSC efficiency,» Clean Energy, vol. 8, n° %13, p. 238–257, 2024.
[7] K. Sharma, V. Sharma et S. S. Sharma, «Dye-sensitized solar cells: fundamentals and current status,» Nanoscale Res Lett, vol. 13, p. 381, 2018.
[8] L. Ouattara, K. Bamba, M. G.-R. Koné, J. S. N’dri, K. N. N’Guessan, P. M. Ouattara et F. Diarrassouba, «Predictive Modeling of Breast Anticancer Activity of a Series of Coumarin Derivatives Using Quantum Descriptors,» Chemical Science International Journal, vol. 26, n° %14, pp. 1-10, 2019.
[9] A–A. M. Fenjan et I. S. Mahdi, «Synthesis and Characterization of New Mannich Bases Derived from 7-hydroxy-4-methyl Coumarin,» Baghdad Sci. J, vol. 13, 2016.
[10] J. M. Rehm, G. L. McLendon, Y. Nagasawa, K. Yoshihara, J. Moser et M. Grätzel, «Femtosecond Electron-Transfer Dynamics at a Sensitizing Dye Semiconductor (TiO2) Interface,» J. Phys. Chem., vol. 100, n° %123, p. 9577–9578, 1996.
[11] M. Pastore et F. De Angelis, «Aggregation of Organic Dyes on TiO2 in Dye-Sensitized Solar Cells Models: An ab Initio Investigation,» ACS Nano, vol. 4, n° %11, p. 556–562, 2010.
[12] Y. Ooyama et Y. Harima, «Molecular Designs and Syntheses of Organic Dyes for Dye Sensitized Solar Cells,» Eur. J. Org. Chem., pp. 2903-2934, 2009.
[13] K. Hara, K. Sayama, Y. Ohga, A. Shinpo, S. Suga et H. Arakawa, «A coumarin-derivative dye sensitized nanocrystalline TiO2 solar cell having a high solar-energy conversion efficiency up to 5.6%» Chem. Commun, pp. 569-570, 2001.
[14] A. Furube, R. Katoh, K. Hara, T. Sato, S. Murata, H. Arakawa et M. Tachiya, «Lithium ion effect on electron injection from a photoexcited coumarin derivative into a TiO2 nanocrystalline film investigated by visible-to-IR ultrafast spectroscopy», J. Phys. Chem., vol. 109, pp. 16406-16414, 2005.
[15] Z. D. Sun, J. S. Zhao, Z. Mei et J. Xue-Hai, «Theoretical study of nitrogen cation modified aromatics containing thiophene as π-linker for p-type photosensitizers,» J Mol Model, vol. 25, p. 300, 2019.
[16] F. Diarrassouba, M. Koné, K. Bamba, Y. Traoré, M. Koné et E. Assanvo, «Development of Predictive QSPR Model of the First Reduction Potential from a Series of Tetracyanoquinodimethane (TCNQ) Molecules by the DFT (Density Functional Theory) Method,» Computational Chemistry, vol. 7, pp. 121-142, 2019.
[17] M. J. Frisch, G. W. Trucks, H. B. Schlegel, G. E. Scuseria, M. A. Robb, J. R. Cheeseman, G. Scalmani, V. Barone, B. Mennuci, G. A. Petersson, H. Nakatsuji, M. Caricato, X. Li, H. P. Hratchian, A. F. Izmaylov, J. Bloino, G. Zheng, J. L. Sonnerberg, M. Hada, Ehara, K. Toyota, R. Fukuda, J. Hasegawa, M. Ishida, T. Nakajima, Y. Honda, O. Kitao, H. Nakai, T. Vreven, A. Montgomery, J. E. Peralta, F. Ogliaro, M. Bearpark, J. J. Heyd, E. Brothers, K. N. Kudin, V. N. Staroverov, R. Kobayashi, J. Normand, K. Raghavachari, A. Rendell, J. C. Burant, S. S. Iyengar, J. Tomasi, M. Cossi, N. Rega, J. M. Milliam, M. Klene, J. E. Knox, J. B. Cross, V. Bakken, C. Adamo, J. Jaramillo, R. Gomperts, R. E. stratmann, O. Yazyev, A. J. Austin, R. Cammi, C. Pomeli, J. W. Ochterski, R. L. Martin, K. Morokuma, V. G. Zakrzewski, G. A. Voth, P. Salvador, J. J. Dannenberg, S. Dapprich, S. Daniels, O. Farkas, J. B. Foresman, J. V. Ortiz, J. Cioslowski et D. J. Fox, Gaussian 09, Revison A.02, WAllingford C T: inc, 2009.
[18] A. Segalina, X. Assfeld, A. Monari et M. Pastore, «Computational Modeling of Exciton Localization in Self-Assembled Perylene Helices: Effects of Thermal Motion and Aggregate Size» J. Phys. Chem. C, vol. 123, n° %111, p. 6427–6437, 2019.
[19] F. Bonachera, Les triplets pharmacophoriques flous: développement et applications, Lille: Université Lille1 sciences et téchnologies: PhD thèse, 2011.
[20] J. Ghasemi, S. Saaidpour et S. D. Brown, «QSPR study for estimation of acidity constants of some aromatic acids derivatives using multiple linear regression (MLR) analysis,» J. Mol. Struct. (Theochem), vol 85(1), pp 27-32, 2007.
[21] P. Geladi et B. R. Kowalski, «Partial Least Squares Regression: a Tutorial,» Anal. Chim. Acta., vol. 185, pp. 1-17., 1986.
[22] A. F. Duprat, T. Huynh et G. Dreyfus, «Toward a principled methodology for neural network design and performance evaluation in RQSA. Application to the prediction of LogP,» J. Chem. Inf. Comput. Sci., vol. 38, pp. 586-594, 1998.
[23] J. Gasteiger et J. Zupan, «Neural Networks in Chemistry,» Angew. Chem. Int. Ed. Engl., vol. 32, pp. 503-527, 1993.
[24] Microsoft Office Professionnel Plus «(15.0.4420.1017) MSO (15.0.4420.1017) 64 Bits (2013),» Partie de Microsoft Office Professionnel Plus, 2013.
[25] XLSTAT v2014 1995-2014, «XLSTAT and Addinsoft are Registered Trademarks of Addinsoft,»
[26] M. V. Diudea, « QSPR/RQSA Studies for Molecular Descriptors,,» New York: Nova Science: Huntingdon, 2000.
[27] M. G.-R. Koné, ÉTUDE THÉORIQUE DE QUELQUES PROPRIÉTÉS MOLÉCULAIRES DANS LA FAMILLE DES BENZIMIDAZOLYL-CHALCONES, Abidjan: Université Nangui Abrogoua, 2017.
[28] L. Eriksson, J. Jaworska, A. Worth, M. T. D. Cronin, R. M. M. Dowell et P. Gramatica, «Methods for Reliability and Uncertainty Assessment and for Applicability Evaluations of Classification- and Regression-Based RQSAs,» Environmental Health Perspectives, vol. 111, n°110, pp. 1361-1375, 2003.
[29] L. Zhang, H. Zhu, T. I. Oprea, A. Golbraikh et A. Tropsha, «RQSA Modeling of theBlood-Brain Barrier Permeability for Diverse Organic Compounds,» Pharm. Res., vol. 25, p. 1902–1914., 2008.
[30] L. He et P. C. Jurs, «Assessing the reliability of a RQSA model's predictions,» J. Mol. Graph. Model, vol. 23, pp. 503-523, 2005.
[31] P. Gramatica, «Principles of QSAR models validation: internal and external,» RQSA. Comb. Sci., vol. 26, p. 694–701, 2007.
[32] N. Chirico et P. Gramatica, «Real External Predictivity of QSAR Models: How To Evaluate It ? Comparison of Different Validation Criteria and Proposal of Using the Concordance Correlation Coefficient,,» J. Chem. Inf. Model, vol. 51, n° 119, pp. 2320-2335, 2011.
[33] A. Golbraikh et A. Tropsha, «Beware of q2!,» J. Mol. Graph. Model, vol. 20, p. 269–276., 2002.
[34] C. Qin et A. E. Clark, «DFT characterization of the optical and redox properties of natural pigments relevant to dye-sensitized solar cells,» Chem. Phys. Lett., vol. 26, p. 438, 2007.
[35] M. Nazeeruddin, E. Baranoff et M. Grätzel, «Dye-sensitized solar cells: A brief overview,» Solar energy, vol. 85, p. 1175, 2011.
[36] W. Sang-aroona, b. S. Saekowb et V. Amornkitbamrungb, «Density functional theory study on the electronic structure of Monascus dyes as photosensitizer for dye-sensitized solar cells,» Journal of Photochemistry and Photobiology A: Chemistry, vol. 236, p. 35– 40, 2012.
[37] M. Li, L. Kou, L. Diao, Q. Zhang, Z. Li, Q. Wu, W. Lu, D. Pan et Z. Wei, «Theoretical study of WS-9-Based organic sensitizers for unusual vis/NIR absorption and highly efficient dye-sensitized solar cells,» J. Phys. Chem., vol. 119, p. 9782–9790, 2015.
Cite This Article
  • APA Style

    N’guessan, N. K., Richard, M. K. G., Patrice, O. W., Stéphane, D. G., Bamba, K., et al. (2024). Quantitative Structure Photovoltaic Properties Relationship of Coumarin Dyes Derived. Modern Chemistry, 12(2), 33-46. https://doi.org/10.11648/j.mc.20241202.12

    Copy | Download

    ACS Style

    N’guessan, N. K.; Richard, M. K. G.; Patrice, O. W.; Stéphane, D. G.; Bamba, K., et al. Quantitative Structure Photovoltaic Properties Relationship of Coumarin Dyes Derived. Mod. Chem. 2024, 12(2), 33-46. doi: 10.11648/j.mc.20241202.12

    Copy | Download

    AMA Style

    N’guessan NK, Richard MKG, Patrice OW, Stéphane DG, Bamba K, et al. Quantitative Structure Photovoltaic Properties Relationship of Coumarin Dyes Derived. Mod Chem. 2024;12(2):33-46. doi: 10.11648/j.mc.20241202.12

    Copy | Download

  • @article{10.11648/j.mc.20241202.12,
      author = {Nobel Kouakou N’guessan and Mamadou Koné Guy Richard and Ouattara Wawohinlin Patrice and Dembélé Georges Stéphane and Kafoumba Bamba and Nahossé Ziao},
      title = {Quantitative Structure Photovoltaic Properties Relationship of Coumarin Dyes Derived
    },
      journal = {Modern Chemistry},
      volume = {12},
      number = {2},
      pages = {33-46},
      doi = {10.11648/j.mc.20241202.12},
      url = {https://doi.org/10.11648/j.mc.20241202.12},
      eprint = {https://article.sciencepublishinggroup.com/pdf/10.11648.j.mc.20241202.12},
      abstract = {The performance of an organic solar cell is strongly influenced by the structure of the photosensitizer. In this work, the open-circuit voltage (VOC) and conversion efficiency (η) of a series of coumarin dyes are quantitatively related to the structure of nine coumarin derivatives. The Quantitative Structure Property Relationship (QSPR) is performed using the statistical method of multiple linear regression. In addition, descriptors determined from the ground state at the Cam_B3lyp/6-31G(d, p) level of theory and from the 2D structure of the molecules are mathematically related to the photovoltaic properties. These VOC and η models are accredited with very good statistical indicators (R2 = 0.906 and 0.918; Qcv2= 0.845 and 0.849; S= 0.045 and 0.112; F = 14.524 and 16.846). These statistical indicators confirm the robustness and performance of the models developed. The results show that Voc improves with decreasing surface tension (ts) and increasing number of cycles (cycle). As for the conversion efficiency of light radiation into electrical energy, it is optimal when the light harvesting efficiency (LHEth) and the excited state lifetime (τth) are high. In conclusion, these models have good predictive capabilities and can be used to predict and explain the open-circuit voltage and efficiency of coumarin derivatives that belong to the same field of application.
    },
     year = {2024}
    }
    

    Copy | Download

  • TY  - JOUR
    T1  - Quantitative Structure Photovoltaic Properties Relationship of Coumarin Dyes Derived
    
    AU  - Nobel Kouakou N’guessan
    AU  - Mamadou Koné Guy Richard
    AU  - Ouattara Wawohinlin Patrice
    AU  - Dembélé Georges Stéphane
    AU  - Kafoumba Bamba
    AU  - Nahossé Ziao
    Y1  - 2024/09/11
    PY  - 2024
    N1  - https://doi.org/10.11648/j.mc.20241202.12
    DO  - 10.11648/j.mc.20241202.12
    T2  - Modern Chemistry
    JF  - Modern Chemistry
    JO  - Modern Chemistry
    SP  - 33
    EP  - 46
    PB  - Science Publishing Group
    SN  - 2329-180X
    UR  - https://doi.org/10.11648/j.mc.20241202.12
    AB  - The performance of an organic solar cell is strongly influenced by the structure of the photosensitizer. In this work, the open-circuit voltage (VOC) and conversion efficiency (η) of a series of coumarin dyes are quantitatively related to the structure of nine coumarin derivatives. The Quantitative Structure Property Relationship (QSPR) is performed using the statistical method of multiple linear regression. In addition, descriptors determined from the ground state at the Cam_B3lyp/6-31G(d, p) level of theory and from the 2D structure of the molecules are mathematically related to the photovoltaic properties. These VOC and η models are accredited with very good statistical indicators (R2 = 0.906 and 0.918; Qcv2= 0.845 and 0.849; S= 0.045 and 0.112; F = 14.524 and 16.846). These statistical indicators confirm the robustness and performance of the models developed. The results show that Voc improves with decreasing surface tension (ts) and increasing number of cycles (cycle). As for the conversion efficiency of light radiation into electrical energy, it is optimal when the light harvesting efficiency (LHEth) and the excited state lifetime (τth) are high. In conclusion, these models have good predictive capabilities and can be used to predict and explain the open-circuit voltage and efficiency of coumarin derivatives that belong to the same field of application.
    
    VL  - 12
    IS  - 2
    ER  - 

    Copy | Download

Author Information
  • Thermodynamics and Physical Chemistry of the Environment Laboratory, Unit of Formation and Recherche Sciences Fondamentales et Appliquée, University of Nangui Abrogoua, Abidjan, Ivory Cost

  • Thermodynamics and Physical Chemistry of the Environment Laboratory, Unit of Formation and Recherche Sciences Fondamentales et Appliquée, University of Nangui Abrogoua, Abidjan, Ivory Cost

  • Thermodynamics and Physical Chemistry of the Environment Laboratory, Unit of Formation and Recherche Sciences Fondamentales et Appliquée, University of Nangui Abrogoua, Abidjan, Ivory Cost

  • Thermodynamics and Physical Chemistry of the Environment Laboratory, Unit of Formation and Recherche Sciences Fondamentales et Appliquée, University of Nangui Abrogoua, Abidjan, Ivory Cost

  • Thermodynamics and Physical Chemistry of the Environment Laboratory, Unit of Formation and Recherche Sciences Fondamentales et Appliquée, University of Nangui Abrogoua, Abidjan, Ivory Cost

  • Thermodynamics and Physical Chemistry of the Environment Laboratory, Unit of Formation and Recherche Sciences Fondamentales et Appliquée, University of Nangui Abrogoua, Abidjan, Ivory Cost

  • Abstract
  • Keywords
  • Document Sections

    1. 1. Introduction
    2. 2. Material and Methods
    3. 3. Results and Discussion
    4. 4. Conclusion
    Show Full Outline
  • Abbreviations
  • Author Contributions
  • Conflicts of Interest
  • References
  • Cite This Article
  • Author Information