Research Article | | Peer-Reviewed

Physico-chemical and Bacteriological Evaluation, Based on the Water Quality Index (AQI) and the Inorganic Pollution Index (IPO) of Wastewater from an Oil Refinery

Received: 5 December 2025     Accepted: 31 December 2025     Published: 27 January 2026
Views:       Downloads:
Abstract

Refinery wastewater contains a complex pollutant load (hydrocarbons, phenols, heavy metals, sulfides) that requires advanced treatment before discharge. This study evaluates the effectiveness of a treatment system by analyzing physicochemical and bacteriological parameters based on the Water Quality Index (WQI) and the Inorganic Pollution Index (IPO). The methodology employed allowed for 61 days of monitoring at four treatment plant stations. The parameters analyzed included COD, TSS, hydrocarbons, volatile phenols, sulfides, ammonia nitrogen, heavy metals (Pb, As, Cr), and pH. The methods used combined UV spectrophotometry, ICP, and colorimetric tests. The primary treatment reduced COD by 85% and hydrocarbons by 92%. Secondary treatment maintained residual COD at 45.2 mg/L and phenols at 0.15 mg/L. At the outlet, regulatory compliance exceeded 95% for all parameters, with removal rates of 93% (COD), 98.8% (hydrocarbons), and 99.4% (phenols). The IPO and IQE indices confirmed a significant improvement in water quality after treatment. The performance demonstrates the effectiveness of a combined physicochemical and biological approach. Some variations in inlet pH and sulfide levels indicate the need for appropriate pretreatment. The use of the IQE/IPO indices facilitates environmental monitoring and decision-making. The treatment system studied is effective in meeting petroleum wastewater discharge standards. Targeted optimizations, particularly regarding pH regulation and sulfide monitoring, could further improve its performance. This study provides a methodological framework applicable in similar contexts, particularly in the Sahel region.

Published in Modern Chemistry (Volume 14, Issue 1)
DOI 10.11648/j.mc.20261401.12
Page(s) 9-21
Creative Commons

This is an Open Access article, distributed under the terms of the Creative Commons Attribution 4.0 International License (http://creativecommons.org/licenses/by/4.0/), which permits unrestricted use, distribution and reproduction in any medium or format, provided the original work is properly cited.

Copyright

Copyright © The Author(s), 2026. Published by Science Publishing Group

Keywords

Petroleum Wastewater, Water Quality Index, Inorganic Pollution Index, Physicochemical Treatment, Heavy Metals

1. Introduction
Water, the source of all life on Earth, is a limited natural resource that is used extensively in domestic purposes, as well as in large quantities in agriculture and industry.
As a result of these uses, water is often polluted, and its discharge into the environment could have long-term consequences for human health and the environment.
According to Resjek, wastewater, or wastewater, is water laden with pollutants, soluble or insoluble, originating primarily from human activity . Wastewater is generally a mixture of pollutants belonging to a specific category, dispersed or dissolved in water that has been used for domestic or industrial purposes.
Wastewater is essential in the operation of oil production facilities, which are considered a major source of pollution that harms the environment and, consequently, human health. The oil industry encompasses a wide and highly variable range of water uses. This use can cause water pollution, as industrial discharges from refineries are composed of chemicals, heavy metals, and hydrocarbons (organic components that are either non-biodegradable or slowly biodegradable). Thus, once released into the environment, this wastewater poses a significant threat to the balance of ecosystems. Inorganic wastewater often contains various pollutants such as heavy metals, acids, and polycyclic aromatic hydrocarbons. These pollutants can be contaminated by waterways, groundwater, and soils, thereby compromising drinking water quality and biodiversity . Wastewater, regardless of its origin, is generally laden with inorganic pollutants, which, depending on their quantity and composition, represent a real danger to receiving environments or their users. Removing these toxic elements requires the design of a treatment system. However, before designing any treatment process, it is essential to characterize the effluent to be treated, both quantitatively and qualitatively. To assess the concentration of pollutants in water used in the petroleum industry, it is necessary to conduct physicochemical analyses that reveal the presence of suspended mineral and organic matter . These components can have a natural origin, come from waste, soil, or human activity in the surrounding area. Water quality is influenced by a multitude of phenomena, both natural and anthropogenic. Monitoring this water quality is of paramount importance for public health, as alterations can have devastating consequences for the soil, human organisms, and even the health of an entire population.
Proper management of wastewater from all hydrocarbon production industries helps protect and preserve the natural environment from pollution. From an environmental perspective, wastewater from hydrocarbon production can pose problems related to its dispersal into other environmental compartments . The main sources of water contamination are: domestic and industrial wastewater, agricultural production, air pollutants, former landfills, and hazardous substances used in industry . When heavy metals come into contact with water, chemical reactions occur in relation to acidity, alkalinity, temperature, and oxygenation. Furthermore, the solubility of a metal is an important factor. If the metal is soluble, it will leach into groundwater and/or plants, while if it is insoluble, it will remain in the soil. Solubility depends on several factors, the most important being soil acidity. Wastewater, particularly from industrial activities, is often heavily contaminated with toxic chemicals . These inorganic pollutants can include metallic compounds such as lead, copper, and zinc, which are commonly used in various industrial processes. When released into the environment without proper treatment, these pollutants can migrate into groundwater and surface water, contaminating water resources used by the local population . Furthermore, their accumulation in soils can disrupt ecosystems, impair soil fertility, and consequently affect agricultural productivity .
The main objective of our work is to assess the pollutant content of oil refinery effluents by analyzing their physicochemical and bacteriological characteristics before and after treatment, in order to determine the discharge standard and its inorganic pollution status, based on the Water Quality Index (WQI) and the Inorganic Pollution Index (IPO). The specific objective will be to highlight the possibilities for treating hydrocarbon production industry effluents using appropriate technologies in a context such as that of Chad . This will be achieved through laboratory tests with various configurations and operating conditions.
2. Materials and Methods
2.1. Materials Used
Table 1 lists all the materials and reagents used in this work.
Table 1. Different materials used for the article.

Nitrogen Ammonia N2-NH4)

Materials needed:

Graduated cylinder; Erlenmeyer flask; 10 ml glass cuvette; Micropipette; DR-2800 UV spectrophotometer.

Reagents:

Tartaric acid; NaOH; Zinc sulfate; Nessler's reagent.

Phosphate

Materials needed:

50 mL tubes; DR 2800 UV spectrophotometer; 13 mL cuvette;

Micropipette.

Reagents:

Ammonium persulfate; Ammonium molybdate; Ascorbic acid

Toxic Substances Phenol

Materials needed:

50 mL tubes; DR 2800 UV spectrophotometer; 30 mL square cuvette;

Micropipette.

Reagents:

Buffer reagent; 4-amino anti; Ferric potassium.

Sulphite ions

Materials needed:

Erlenmeyer flask with stopper; Graduated cylinder; Graduated burette (for titration).

Reagents:

NaOH; Zinc acetate; Iodine; Hydrogen chloride (HCl);

Sodium thiosulfate (titrant); Starch.

Oil content

Materials needed:

Beaker; Graduated cylinder; Filter; Bubbling apparatus assembly;

Laminar flow hood; Computer and main server; Reading cuvette; Carbon tetrachloride; Sodium sulfate anhydride.

Lead

Materials needed:

DR 6000 spectrophotometer; graduated cylinder; 250 ml beaker;

Fast Column Extractor; stand; cotton swab; piston; measuring cuvette

Reagents

Lead 1 reagent (preservative acid); Lead 2 reagent with fixative solution; 25 ml of Lead-3 solution; Lead-4 solution; Lead-5 solution; Lead-6 solution; distilled water

Total Chrome

Materials needed:

DR 6000 spectrophotometer; test tube; warm bath

Reagents

25 ml sample water; Chromium 1 reagent sachet

Chromium 2 reagent sachet; Chromaver 3 reagent sachet; cold water

Control sample water

Arsenic

Materials needed:

A bottle; filter slide; stopper; black slide (Palintest color chart); filter paper; DigiPAsS

Reagent: reagent sachet A1; tablet A2; deionized water

2.2. Method
We explain the methodology used in the laboratories.
2.2.1. Nitrogenous Ammonia (Ammoniacal Nitrogen N2-NH4)
1) Principle:
2) Organically bound nitrogen is oxidized to nitrate by digestion with peroxodisulfate. Nitrate ions react with 2, 6-dimethylphenol in a phosphoric acid solution to form nitrophenol.
3) Procedure:
4) Take 50 mL of heated distilled water (blank);
5) Place 100 mL of the samples (cleans) in an Erlenmeyer flask;
6) Add 1 mL of zinc sulfate and two drops of NaOH, then filter;
7) Take a filtered solution (50 mL for unconcentrated samples and distilled to 50 mL with heated distilled water for concentrated samples);
8) Add two drops of tartaric acid;
9) Add another 1 mL of Nessler's reagent;
10) Mix thoroughly and let stand for 10 minutes.
2.2.2. Phosphate
1) Phosphates are among the anions readily bound by soil; their presence in natural waters is linked to the nature of the soils they pass through and the decomposition of organic matter. Each fraction can be analytically separated into orthophosphates, hydrolyzable phosphorus, and organic phosphorus.
2) Total phosphorus is determined, after mineralization of the sample, by scanning electron microscopy (SEMS) with inductive coupling.
3) Principle:
4) In an acidic medium and in the presence of ammonium molybdate ions, a phosphomolybdic complex forms, which is then reduced by ascorbic acid. Procedure:
5) Take 5 ml of distilled water (the blank) in the 50 ml tube;
6) Add 4 ml of potassium persulfate and dilute to 25 ml;
7) Heat for 30 minutes;
8) Remove from heat and cool, then dilute to 50 ml;
9) Add 2 ml of ammonium molybdate and 1 ml of ascorbic acid;
10) Mix thoroughly and let stand for 10 minutes;
11) Read the results in DR2800.
2.2.3. Toxic Substances: Phenol (Unit: μg/L Phenol Index)
Highly toxic, phenol is known for its persistence and bioaccumulation potential.
The sample is fed into a continuous carrier stream, mixed with phosphoric acid, and then distilled inline at pH 1.4. The distillate containing vapor-volatile phenolic compounds is then mixed with continuously flowing solutions of aminoantipyrine and potassium hexacyanoferrate (III). The phenolic compounds in the distillate are oxidized by hexacyanoferrate (III), and the resulting quinones react with aminoantipyrine to form yellow condensation products, which are measured spectrometrically in a flow spectrometer between 505 nm and 515 nm.
2.2.4. Analytical Method
1) Turn on the DR-2800 Spectrophotometer.
2) Stabilize the instrument for 30 minutes to 1 hour
3) Place 50 mL of distilled water (blank) in the 50 mL tube;
4) Take 50 mL of the unconcentrated sample (for concentrated samples, take a few precise mL and then dilute to 50 mL with distilled water);
5) Add 0.5 mL of buffer reagent and 1 mL of 4-amino-anti-syrin 20 g/L. Mix thoroughly.
6) Add 1 mL of ferric potassium 80 g/L (mix thoroughly);
7) Mix thoroughly and allow the instrument to react for 10 minutes;
8) Select the phenol parameters in the instrument (DR-2800 Spectrophotometer)
9) Select the 7.5 mL cuvette for the reading.
First step:
1) Calibrate the instrument with the mixture (distilled water + reagents); Step Two
2) Homogenize the mixture and fill the cuvette with it.
3) Insert the cuvette into the instrument.
4) Read the phenol concentration in mg/L in the DR-2800 and record the value.
5) Rinse the cuvette with distilled water.
6) The phenol concentration will be displayed.
2.2.5. Sulfide Ions (Sulfite)
The presence of sulfides in wastewater is due in part to industrial activities, but primarily to the bacterial reduction of sulfates. Hydrogen sulfide, recognized by its characteristic rotten egg odor, is highly toxic.
This method allows for the measurement of sulfide concentrations from 0.02 to 1.00 mg/L in domestic, industrial, and surface water wastewater.
Principle:
Hydrogen sulfide, a highly volatile gas, is fixed by the addition of zinc acetate in the form of particulate zinc sulfide, which, upon the addition of sodium hydroxide, co-precipitates with the resulting zinc hydroxide flocs. Interference is eliminated by distilling the sample. The sulfides react with dimethyl-p-phenylenediamine in the presence of ferric chloride to form methylene blue. The absorbance is measured using a UV-visible spectrophotometer at a wavelength of 664 nm, and the concentration is deduced from the distilled calibration curve. The concentration of the standard used is previously determined by iodometric titration.
Procedure:
1) Place 50 mL of distilled water (the blank) in a stoppered Erlenmeyer flask;
2) Take 50 mL of the unconcentrated sample (and for concentrated samples, take a precise few mL and then dilute to 50 mL with distilled water);
3) Add two (2) drops of NaOH;
4) Add 5 mL of zinc acetate;
5) 10 mL of iodine;
6) 5 mL of HCl (a brick-red color appears);
a) Close the stoppers and place the Erlenmeyer flasks containing the mixture in a dark place for 5 minutes; Remove and titrate with the sodium thiosulfate titrant solution until a pale yellow color appears;
b) Add a pinch of starch; a blue color appears;
c) Titrate again with sodium thiosulfate until the color changes to clear.
d) Enter the volume consumed and have it calculated using the calculator application.
2.2.6. Oil Content
Mineral oils and greases are derived from petroleum distillation and are divided into two categories: aliphatic hydrocarbons and aromatic hydrocarbons.
An oil consists of hydrocarbons containing 17 to 22 carbon atoms, while a grease consists of hydrocarbons containing more than 22 carbon atoms.
Petroleum hydrocarbons are pollutants with a variety of physical, chemical, and toxic properties. The main sources of emissions into the environment are produced by the petroleum industry and by effluents from industries that use petroleum products in their industrial processes.
Procedure
1) Take 50 mL of the sample and pour it into the separatory funnel;
2) Also take 50 mL of carbon tetrachoride solvent;
3) Assemble the apparatus (reattach the flask to the separatory funnel);
4) Bubble the solution for 3 minutes; repeat this action at least 3 times;
5) Filter the solution (using anhydride sodium sulfate solution);
6) Turn on the computer and server, then calibrate it with carbon tetrachoride;
7) Take the filtered solution from the cuvette and insert it into the computer server; click the read button;
8) Once the plotted curve is displayed, read the result shown on the screen in mg/L.
9) Other parameters were measured at the National Wastewater Laboratory:
2.2.7. Heavy Metal Analysis
1) This analysis is performed on an inductively coupled plasma atomic absorption spectrometer (ICP-AAS):
2) Procedure
3) Filter the sample.
4) Place the lamp associated with the heavy metal to be examined in the appropriate compartment, then light the flame through which the lamp beam passes. The filtrate is drawn to the atomizer via the nebulizer, and the lamp beam is absorbed by the atoms. Read the value on the screen in mg/L.
(i). (Lead (Pb))
Analysis Procedure:
Program the DR 6000 spectrophotometer with code 283 for lead;
Measure 100 ml of sample using a graduated cylinder and pour into a 250 ml beaker;
Acidification step: Add 1 ml of lead reagent 1 (preservative acid) to the sample and stir to mix well;
Fixation step: Add 2 ml of lead reagent 2 with a fixative solution. If the sample was preserved with HNO3, check the pH and adjust to a pH between 6.7 and 7.1 with 5N NaOH;
Column preparation: Mount the Fast Column Extractor on a stand and moisten the cotton pad with distilled water. Press the absorbent with the plunger, then remove the plunger;
Lead extraction: Slowly pour the prepared sample into the center of the column (2 drops/second). When the flow stops, fully press the absorbent with the plunger and then remove the plunger;
Eluation: Pour 25 ml of Lead-3 solution into the column, allow it to flow slowly, then squeeze the buffer;
Colorimetric preparation:
1) Add 1 ml of Lead-4 Neutralizer solution to the eluent and mix;
2) Add 1 sachet of Lead-5 indicator and mix the solution;
3) Pour 10 ml of the solution into a measuring cuvette;
4) Start the reaction time of 2 minutes;
Measurement step: Once the time has elapsed, insert the cuvette and press Zero;
Remove the cuvette and add 3 drops of Lead-6 Decolorizer solution, then mix well;
Reinsert the cuvette into the spectrometer and press Measure;
The result is displayed as µg/L of Pb.
(ii). Arsenic Analysis Protocol (Palintest)
Step 1: Sample Preparation
1. Bottle Preparation
- Take a bottle and fill it to the line (50 ml) with the water to be analyzed.
- Place the bottle on a flat surface.
2. Adding Sachet A1
- Take one reagent sachet A1 and pour it entirely into the bottle.
3. Preparing the Filter Device
- Take the device with the filter slide and check that the slides are firmly inserted into the stopper.
4. Adding Tablet A2
- Take one tablet A2 and gently drop it into the bottle.
- The sample will begin to fizz.
5. Closing the Bottle
- Immediately and firmly insert the stopper into the bottle.
6. Reaction Time
- Allow 20 minutes for the reaction.
- After 20 minutes: remove the black slide and proceed to the next step.
Step 2: Arsenic Measurement
1. Remove the black slide from the device. 2. Compare the color obtained on the black slide to the Palintest color chart to determine the arsenic concentration in ppb.
3. If the result exceeds 500 ppb, use a dilution bottle:
- Dilute with deionized water.
- Repeat the test from step 1 with the appropriate dilution.
Step 3: Using the DigiPAsS
1. If the visual reading is less than 100 ppb, insert the black slide into the DigiPAsS.
2. Read and record the result in μg/L.
3. Disposal of materials:
- Open the two filter slides.
- Remove the filter paper and dispose of it in the provided waste bag.
(ⅲ). Total Chromium
Procedure:
1) Turn on the machine;
2) Allow to stabilize;
3) Program the DR 6000 spectrophotometer with code 100 for total chromium;
4) Pour 25 ml of sample water into a tube;
5) Add one sachet of Chromium 1 reagent and shake well;
6) Immerse the tube in a warm bath for 5 minutes;
7) Remove the tube and pour cold water until the temperature reaches 25°C;
8) Add one sachet of Chromium 2 reagent and shake well;
9) Add one sachet of chromium acid reagent to the mixture and homogenize;
10) Finally, add one sachet of Chromaver 3 and homogenize;
11) Allow to stand for 5 minutes;
12) Pour 25 ml of sample water into another tube and use as a control;
13) Once the time has elapsed, insert the control and click on Zero;
14) Then insert the sample and click on Read, and note the displayed value.
3. Results and Discussion
3.1. Analysis Results
This study presents a comprehensive performance analysis of an industrial wastewater treatment system over a 61-day period, based on monitoring four strategic stations.
The collected data allows for a detailed evaluation of treatment efficiency from the raw effluent inlet to the system outlet.
3.1.1. Analysis of Station CI-101, the System Inlet Point
The analysis of Station CI-101, the system inlet point, reveals a significant pollutant load characterized by high concentrations of COD (1259–1952 mg/L) and organic compounds, consistently exceeding design standards. The strong correlation observed between COD and volatile phenols (r = 0.67) suggests a common origin for these contaminants, likely related to the industrial activities generating the effluent.
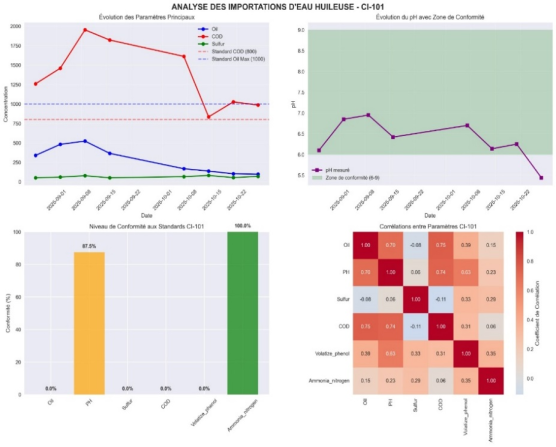
Figure 1. Response of the grouped results of the analysis of station C1-101
In this figure, the presence of variable sulfide concentrations and pH fluctuations indicates the need for robust pretreatment to stabilize these parameters before the main treatment stages .
3.1.2. Remarkable Efficiency of Primary Treatment by Floating Basins
Station PK-102 demonstrates the remarkable efficiency of primary treatment by floating basins.
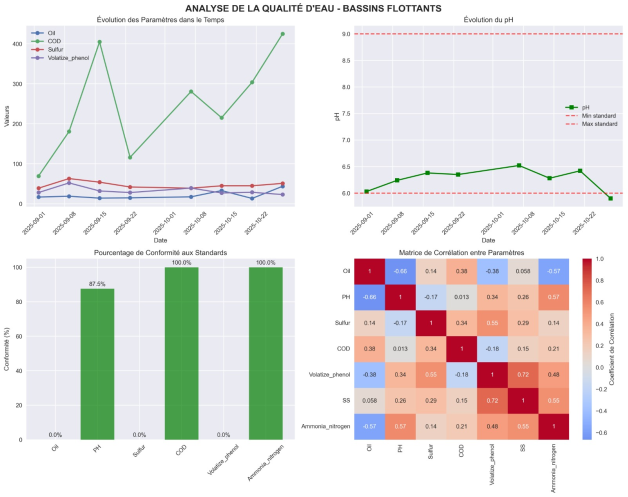
Figure 2. Analysis of the water quality of the floating basin.
A significant reduction in pollutant load was observed, with an average decrease of 85% in COD and 92% in hydrocarbons. The stabilization of the pH within the optimal range of 6-9 and the notable improvement in compliance with standards demonstrate the effectiveness of the implemented physicochemical processes. The change in correlation patterns between parameters suggests a substantial transformation of the pollutant matrix during this stage.
3.1.3. Secondary Treatment Performance
The performance of the secondary treatment, evaluated using the CI-107 station, confirms the effectiveness of the biological processes. Residual concentrations of COD (average 45.2 mg/L) and volatile phenols (average 0.15 mg/L) remain well below regulatory limits. The low interday variability and the absence of significant correlations between parameters indicate a stable and well-controlled process, capable of adapting to variations in input load.
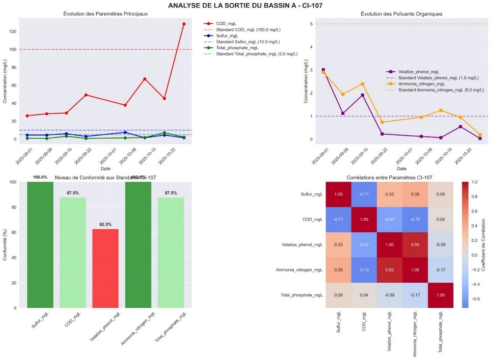
Figure 3. Grouping of results on treatment performance related to the analysis of the outlet of basin A-C1-107.
3.1.4. Detailed Analysis of Station CI-103, Representative of the Final Effluent Quality
The detailed analysis of station CI-103, representative of the final effluent quality, demonstrates the overall excellence of the treatment system. Over the 61 days of monitoring, compliance with standards exceeded 95% for all critical parameters, with perfect performance (100%) for COD, TSS, cyanide, and ammonia nitrogen.
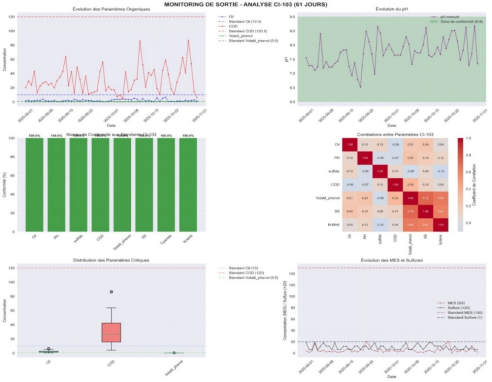
Figure 4. Analysis results relating to compliance with standards.
The preceding figures thus inform us of the result established over the two months. The remarkable temporal stability, illustrated by the small amplitude of the variations and the absence of marked seasonal trends, attests to the robustness of the method.
3.1.5. Integrated System Assessment
The integrated system evaluation reveals exceptional removal rates: 93% for COD, 98.8% for hydrocarbons, and 99.4% for volatile phenols. These performance levels exceed the standards typically reported in the literature for similar systems. Multivariate statistical analysis highlights the progressive disconnection of parameters throughout the treatment process, indicating complete degradation of complex pollutant matrices .
However, several points warrant attention. Occasional pH excursions outside the optimal range, while not having a measurable impact on treatment efficiency, could indicate opportunities for optimizing the neutralization system. Similarly, residual peaks of volatile phenols, although within acceptable limits, suggest the persistence of recalcitrant compounds requiring further attention.
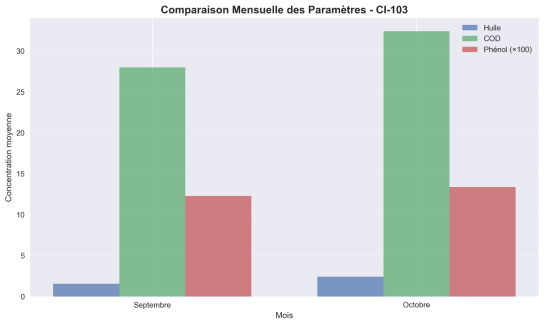
Figure 5. Monthly comparison of C1-103 parameters.
The performance comparison between September and October reveals no significant degradation, demonstrating the process's long-term sustainability. The absence of cyanide detection throughout the study period confirms the effectiveness of the implemented oxidation treatments and the consistent quality of the inputs.
From an operational standpoint, these results validate the current technological choices and operating parameters. The repeatability of performance over an extended period provides a strong argument for maintaining existing operational strategies.
3.2. Heavy Metal Analysis Results
Figure 6 reveals that, based on the results, the lead concentration levels observed at the discharge site were extremely low. The presence of metals at detectable levels in the environment does not necessarily indicate pollution .
There is a close and complex relationship between the physicochemical properties of heavy metals, temperature, and pH, which affect the state of the metals . The biological, physical, and chemical effects of these particles depend on their size, concentration, and composition, with size being the most influential parameter on the environment. Ambient air contains numerous elements such as lead, among others, with concentrations increasing in smaller particles . Lead can be found in various forms: metallic, inorganic, and organic . Lead toxicity varies depending on its concentration in the environment, its specific form, soil characteristics, and the plant species involved. Chromium toxicity depends largely on its form and concentration. Hexavalent chromium (Cr (VI)) is highly toxic, capable of causing kidney cell necrosis, hemorrhagic gastroenteritis, and fatal liver failure at doses as low as 100–300 mg. Conversely, trivalent chromium (Cr (III)) is an essential trace element at low doses for regulating carbohydrate metabolism. Strict management of exposure, particularly to hexavalent chromium, is therefore crucial .
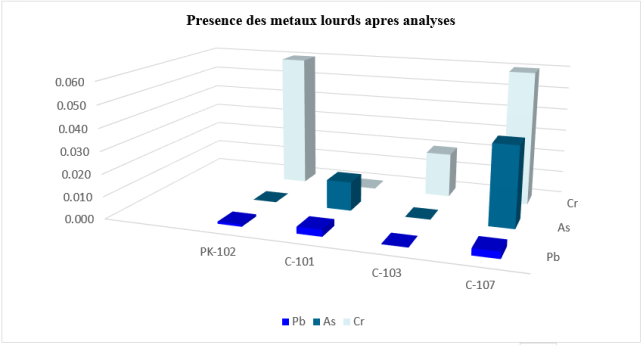
Figure 6. Presence of heavy metals after wastewater analysis.
Regarding the measured pH, it is stable and varies, indicating a slightly alkaline environment, typical of domestic and industrial wastewater . This pH stability at alkaline values is beneficial because it reduces the mobility of heavy metals, thus decreasing their negative environmental impact. However, the study by Li et al. showed that heavy metal concentrations varied significantly between a pH of 10 and a pH of 6. At pH 8, little or no release of metals such as copper, lead, and chromium was observed, with concentrations .
Finally, chromium concentrations ranged from 0.10 mg/L in March to 0.20 mg/L in June, remaining below the permitted limit of 0.5 mg/L. These results are consistent with studies showing similar seasonal variations, often due to industrial discharges .
3.3. Correlation Results Between Parameters
This is a symmetric Pearson correlation matrix (7×7) showing the linear relationships between seven physicochemical parameters in an industrial wastewater sample.
Values range from -1 (perfect negative correlation) to +1 (perfect positive correlation).
The diagonal is 1 because each variable is perfectly correlated with itself.
The high and moderate positive correlations between oil/pH, sulfur/COD/volatile phenol/SS/ammonia nitrogen suggest potential common sources from industrial activities, as well as similar patterns in the interpretation of each parameter we studied in the results . During the analysis of variance of the representative characteristics of the elements present in the wastewater that we annualized, it is preferable that their quality approach 1 . We observe in our case that ours is equal to 1.
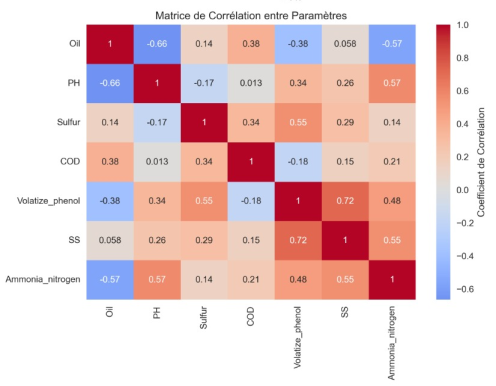
Figure 7. Correlation matrix between parameters.
If we examine this specific case, it appears that:
Regarding strong correlations (|r| > 0.7), we have pH and ammonia nitrogen with r = 0.97.
When the correlation is very strong and therefore positive, this suggests that an increase in pH is almost always accompanied by an increase in ammonia nitrogen content.
This is explained by the fact that ammonia (NH₃) is the basic form of ammonia nitrogen; the higher the pH, the greater the proportion of NH₃ (relative to NH₄⁺). In some effluents, the presence of ammonia can also raise the pH.
The case of volatize phenol and SS with r = 0.72 shows a strong positive correlation. Volatile phenols are often associated with suspended solids (SS) in industrial wastewater, as they can be adsorbed onto solid particles or originate from the same pollution sources (e.g., chemical industries).
Next, we have a response for sulfur and volatize phenol with an r = 0.55. In this case, the correlation is moderate, but we also note that sulfur and COD have an r = 0.34, and sulfur and ammonia nitrogen have a weak r = 0.14.
This can only indicate a common industrial origin (e.g., refinery, petrochemical industry) where sulfur and phenols coexist, which is the case in our research.
3.4. Significant Negative Correlations
In the parameters Oil and pH with an r = -0.66, we can see that as oil content increases, pH tends to decrease. Oils can sometimes contribute free fatty acids or promote acidifying microbial processes.
For the parameter Oil and Ammonia_nitrogen with an r = -0.57, the relationship is moderately negative. Oil may inhibit the release or measurement of ammonia nitrogen, or it may originate from different sources in the industrial process.
We also observe a lack of strong correlation with COD.
COD (Chemical Oxygen Demand) does not show a high correlation with any other parameter (max |r| = 0.38 with Oil). This suggests that chemical oxygen demand is influenced by many factors not measured here, or that its variability is independent of these seven parameters in this dataset.
4. Conclusion
Our work focuses on the physicochemical and bacteriological analysis of wastewater from an oil refinery before and after treatment, using two main indicators: the Water Quality Index (WQI) and the Inorganic Pollution Index (IPO).
The central issue is the high pollutant load of petroleum effluents, containing hydrocarbons, heavy metals, phenols, sulfides, and nitrogen compounds, which threaten ecosystems and public health if discharged without adequate treatment.
The study aims to evaluate the effectiveness of industrial wastewater treatment by analyzing physicochemical and bacteriological parameters and to determine the level of inorganic pollution using the WQI and IPO. It also aims to propose technologies adapted to the Chadian context for treating petroleum effluents.
The methodology described in the document outlines an experimental laboratory approach with sampling spread over 61 days at four monitoring stations.
Among the parameters analyzed were:
- Suspended solids (SS)
- Chemical oxygen demand (COD)
- Hydrocarbons (oils)
- Volatile phenols
- Sulfides
- Ammonia nitrogen
- Heavy metals (Pb, As, Cr)
- pH
These parameters were analyzed using the following instruments:
- DR-2800 and DR-6000 spectrophotometers
- Inductively coupled plasma atomic absorption spectrometer (ICP)
- Colorimetric methods (Palintest for arsenic)
The pH and ammonia parameters are almost redundant in the correlation program. It would be possible to consider using only one of the two for statistical models, particularly when causality needs to be investigated. We also observed that the strong correlation between Volatize_phenol and SS can guide treatment: settling or filtration could also reduce phenols.
The strong anti-correlation between Oil and pH may reflect a buffering effect or specific chemical reactions in the effluent. In summary, the study of the different matrices primarily reveals a strong pH-ammonia coupling and links between phenols, suspended solids, and sulfur, typical of certain complex industrial effluents. Oil exhibits a behavior that is rather inverse to pH and ammonia.
In summary, the study demonstrates the effectiveness of a multi-stage treatment system for petroleum wastewater, with performance exceeding local and international standards. The IQE and IPO indices prove to be relevant tools for environmental monitoring.
Abbreviations

EQI

Water Quality Index

IPO

Inorganic Pollution Index

Acknowledgments
At the end of this work I would like to thank the AfricLab Laboratory.
Author Contributions
Haroun Ali Adannou: Conceptualization, Funding acquisition, Methodology, Resources, Writing – original draft, Writing – review & editing
Salwa Fadoul Ahmat: Methodology
Hassan Souleymane Mahamat: Methodology
Ahmed Mohammed Mohagir: Supervision
Conflicts of Interest
The authors declare no conflicts of interest.
References
[1] REJSEK, F. (2002). Water Analysis: Regulatory and Technical Aspects. Science and Technology. Scéren (CRDP Aquitaine). Technical Biology Collection. Environmental Science and Technology, 360 pages.
[2] Nuamah, D. O. B. (2017). Heavy Metal Source Identification and Analysis Using Multivariate Statistical Methods in Soils from Akuse Area, South-Eastern Ghana. 5(8).
[3] Sun, L. H. (2012). Statistical Analysis of Heavy Metals in Bottom Sediments from the Tuo River in Suzhou City, China and its Implications for Source Identification. Advanced Materials Research, 1621–1624.
[4] Adannou, H. A., Ibrahim, M. A., Goni, S., Hassane, A. I., KAMANE, N. K., Ali, A. M., & III, S. N. (2021). Influence of Solar Radiation on Questionable Gasolines Sold in N’Djamena: ASTM D86 Distillation Analysis and Standardized Tests Related to Atmospheric Pollution and Corrosion. American Journal of Environmental Protection, 9(1), 1-12.
[5] Zerari, N. (2020). Bibliographic synthesis of heavy metals and their trapping by adsorption on clays. Master's thesis in Hydraulics, pp. 1–66. Mohamed Khider University -Biskra-.
[6] Haroun Ali Adannou, Ntamack Samuel, Ndiassé FALL, Mahamat Annour Béchir and Simon Ngos III (B): (2024) State of atmospheric pollution between vulnerabilities and criticalities from 2007 to 2022 and a projection in 2030 focused on the proliferation of gasoline sales in the city of N'Djamena
[7] Haroun Ali Adannou, Podo Mahamat Matar, Tchang Banda Constantin, Achta Hamid Saleh, Simon Ngos III (A): (2024) Evaluation and Determination of the Physical Properties of Gasoline and the Presence of Fine Particles in the Ten Districts of the City of N'djamena: American Journal of Environmental Protection 2024, Vol. 13, No. 5, pp. 122-137
[8] Tchadanaye New Mahamat, Noumi Guy Bertrand, Paloumi Yabe. Pollution of the Chari River in the Slaughterhouse Farcha (N'djamena) in Chad. American Journal of Environmental Protection. Vol. 5, No. 1, 2016, pp. 11-19.
[9] Kwon, M. J., Lee, J. Y., Lee, J. Y., Hwang, Y. H., Jeon, S. kyung, Jeon, S. kyung, Yang, J.-S., Yun, S. T., Lee, S., & Lee, S. (2017). Spatial distribution, mineralogy, and weathering of heavy metals in soils along zinc-concentrate ground transportation routes: implication for assessing heavy metal sources. Environmental Earth Sciences, 76(23), 802.
[10] Boukary Sawadogo (2018). Treatment of industrial wastewater by membrane processes under a Sahelian climate: the case of brewery wastewater in Burkina Faso. Doctoral thesis. University of Montpellier (UM).
[11] Bartolini, M. G., & Muckel, S. (2022). Pollution, Ecological Risk and Source Identification of Heavy Metals in Sediments from the Huafei River in the Eastern Suburbs of Kaifeng, China. International Journal of Environmental Research and Public Health, 19(18), 11259.
[12] Zhou, J., Ma, D., Pan, J., Nie, W., & Wu, K. (2008). Application of multivariate statistical approach to identify heavy metal sources in sediment and waters: a case study in Yangzhong, China. Environmental Earth Sciences, 54(2), 373–380.
[13] JAMES C. W., MATTHEW S., ROBERT P. G., BARBARA S. S. Toxic chemicals and trace metals from urban and rural Louisiana lakes: recent historical profiles ans toxicological significance. Environment science technology, 1995, 29, 8: 1436-1445.
[14] AURELIE D. Characterization of the risks induced by agricultural activities on aquatic ecosystems. Doctoral thesis. ENGREF of Montpellier, 2004, 239p.
[15] BINNING K and BAIRD D Survey of heavy metals in the sediments of the Swartkops River Estuary, Port Elizabeth, South Africa. Water SA, 2001, 27(4): 461-466.
[16] Zhao, Y., Zhao, S., Shi, X., Lu, J., Cui, Z., Yu, H.,... & Li, X. (2024). Influence of environmental factors on changes in the speciation of Pb and Cr in sediments of Wuliangsuhai Lake, during the ice-covered period. Environmental Geochemistry and Health, 46(4), 116.
[17] Omar, Y. (2015). Bioaccumulation of some heavy metals (Pb, Zn and Cu) of road origin by means of a moss (Bryum argenteum Hedw) in the city of Tiaret (Algeria): pollution classes and mapping. Doctoral thesis in environmental science, pp. 1-168. Djillali Liabes University of Sidi Bel Abbes.
[18] Chahid, A. (2016). Quantification of trace metals (cadmium, lead, and total mercury) in certain fishery products landed in the Essaouira-Dakhla area: Health risk assessment, pp. 1–191.
[19] Neggaz, F. (2020). Chromium adsorption by a hydroxyapatite based on the test of the sea urchin Paracentrotus lividus (Lamarck 1816). Master's thesis in Marine and Continental Hydrobiology, pp. 1–99. Abdelhamid Ibn Badis University - Mos-taganem -.
[20] Haroun Ali Adannou., Kamane, N. K., Prosper, S. K., Ngarbaroum, D., Constant, A. N., Ali, A.-H. M. and Ngos III, S. (2020). The Environmental Impact of Polycyclic Aromatic Hydrocarbons: Mechanism of Extraction by Bio-Surfactant in a Microwave. Natural Resources, 11, 576-589.
[21] Li, H., Shi, A., Li, M., & Zhang, X. (2013). Effect of pH, temperature, dissolved oxygen, and flow rate of overlying water on heavy metals release from storm sewer sediments. Journal of Chemistry, p. 5.
[22] Salah, E. A. M., Turki, A. M., & Mahal, S. N. (2015). Chemometric evaluation of the heavy metals in urban soil of Fallujah city, Iraq. Journal of Environmental Protection, 6(11), 1279–1292.
[23] Simou, A., Mrabet, A., Abdelfattah, B., Bougrine, O., Khaddor, M., & Allali, N. (2024). Distribution, Ecological, and Health Risk Assessment of Heavy Metals in the Surface Seawater Along the Littoral of Tangier Bay (Southwestern Mediterranean Sea).
[24] Tiabou, A. F., Takem-Agbor, A. A., Yiika, L. P., Mengu, E. E., Kachoueiyan, F., & Agyingi, C. M. (2024). Distribution, source apportionment and ecological risk assessment of heavy metals in Limbe River sediments, Atlantic Coast, Cameroon Volcanic Line. Discover Water, 4(1).
[25] Berramdane Rania and Brahmi Sanae.(2024) Interaction between pH, temperature and heavy metals in wastewater from the city of Biskra (Chaâbet Roba).
Cite This Article
  • APA Style

    Adannou, H. A., Ahmat, S. F., Mahamat, H. S., Mahamat, A. A., Mohagir, A. M. (2026). Physico-chemical and Bacteriological Evaluation, Based on the Water Quality Index (AQI) and the Inorganic Pollution Index (IPO) of Wastewater from an Oil Refinery. Modern Chemistry, 14(1), 9-21. https://doi.org/10.11648/j.mc.20261401.12

    Copy | Download

    ACS Style

    Adannou, H. A.; Ahmat, S. F.; Mahamat, H. S.; Mahamat, A. A.; Mohagir, A. M. Physico-chemical and Bacteriological Evaluation, Based on the Water Quality Index (AQI) and the Inorganic Pollution Index (IPO) of Wastewater from an Oil Refinery. Mod. Chem. 2026, 14(1), 9-21. doi: 10.11648/j.mc.20261401.12

    Copy | Download

    AMA Style

    Adannou HA, Ahmat SF, Mahamat HS, Mahamat AA, Mohagir AM. Physico-chemical and Bacteriological Evaluation, Based on the Water Quality Index (AQI) and the Inorganic Pollution Index (IPO) of Wastewater from an Oil Refinery. Mod Chem. 2026;14(1):9-21. doi: 10.11648/j.mc.20261401.12

    Copy | Download

  • @article{10.11648/j.mc.20261401.12,
      author = {Haroun Ali Adannou and Salwa Fadoul Ahmat and Hassan Souleymane Mahamat and Aboubakar Ali Mahamat and Ahmed Mohammed Mohagir},
      title = {Physico-chemical and Bacteriological Evaluation, Based on the Water Quality Index (AQI) and the Inorganic Pollution Index (IPO) of Wastewater from an Oil Refinery},
      journal = {Modern Chemistry},
      volume = {14},
      number = {1},
      pages = {9-21},
      doi = {10.11648/j.mc.20261401.12},
      url = {https://doi.org/10.11648/j.mc.20261401.12},
      eprint = {https://article.sciencepublishinggroup.com/pdf/10.11648.j.mc.20261401.12},
      abstract = {Refinery wastewater contains a complex pollutant load (hydrocarbons, phenols, heavy metals, sulfides) that requires advanced treatment before discharge. This study evaluates the effectiveness of a treatment system by analyzing physicochemical and bacteriological parameters based on the Water Quality Index (WQI) and the Inorganic Pollution Index (IPO). The methodology employed allowed for 61 days of monitoring at four treatment plant stations. The parameters analyzed included COD, TSS, hydrocarbons, volatile phenols, sulfides, ammonia nitrogen, heavy metals (Pb, As, Cr), and pH. The methods used combined UV spectrophotometry, ICP, and colorimetric tests. The primary treatment reduced COD by 85% and hydrocarbons by 92%. Secondary treatment maintained residual COD at 45.2 mg/L and phenols at 0.15 mg/L. At the outlet, regulatory compliance exceeded 95% for all parameters, with removal rates of 93% (COD), 98.8% (hydrocarbons), and 99.4% (phenols). The IPO and IQE indices confirmed a significant improvement in water quality after treatment. The performance demonstrates the effectiveness of a combined physicochemical and biological approach. Some variations in inlet pH and sulfide levels indicate the need for appropriate pretreatment. The use of the IQE/IPO indices facilitates environmental monitoring and decision-making. The treatment system studied is effective in meeting petroleum wastewater discharge standards. Targeted optimizations, particularly regarding pH regulation and sulfide monitoring, could further improve its performance. This study provides a methodological framework applicable in similar contexts, particularly in the Sahel region.},
     year = {2026}
    }
    

    Copy | Download

  • TY  - JOUR
    T1  - Physico-chemical and Bacteriological Evaluation, Based on the Water Quality Index (AQI) and the Inorganic Pollution Index (IPO) of Wastewater from an Oil Refinery
    AU  - Haroun Ali Adannou
    AU  - Salwa Fadoul Ahmat
    AU  - Hassan Souleymane Mahamat
    AU  - Aboubakar Ali Mahamat
    AU  - Ahmed Mohammed Mohagir
    Y1  - 2026/01/27
    PY  - 2026
    N1  - https://doi.org/10.11648/j.mc.20261401.12
    DO  - 10.11648/j.mc.20261401.12
    T2  - Modern Chemistry
    JF  - Modern Chemistry
    JO  - Modern Chemistry
    SP  - 9
    EP  - 21
    PB  - Science Publishing Group
    SN  - 2329-180X
    UR  - https://doi.org/10.11648/j.mc.20261401.12
    AB  - Refinery wastewater contains a complex pollutant load (hydrocarbons, phenols, heavy metals, sulfides) that requires advanced treatment before discharge. This study evaluates the effectiveness of a treatment system by analyzing physicochemical and bacteriological parameters based on the Water Quality Index (WQI) and the Inorganic Pollution Index (IPO). The methodology employed allowed for 61 days of monitoring at four treatment plant stations. The parameters analyzed included COD, TSS, hydrocarbons, volatile phenols, sulfides, ammonia nitrogen, heavy metals (Pb, As, Cr), and pH. The methods used combined UV spectrophotometry, ICP, and colorimetric tests. The primary treatment reduced COD by 85% and hydrocarbons by 92%. Secondary treatment maintained residual COD at 45.2 mg/L and phenols at 0.15 mg/L. At the outlet, regulatory compliance exceeded 95% for all parameters, with removal rates of 93% (COD), 98.8% (hydrocarbons), and 99.4% (phenols). The IPO and IQE indices confirmed a significant improvement in water quality after treatment. The performance demonstrates the effectiveness of a combined physicochemical and biological approach. Some variations in inlet pH and sulfide levels indicate the need for appropriate pretreatment. The use of the IQE/IPO indices facilitates environmental monitoring and decision-making. The treatment system studied is effective in meeting petroleum wastewater discharge standards. Targeted optimizations, particularly regarding pH regulation and sulfide monitoring, could further improve its performance. This study provides a methodological framework applicable in similar contexts, particularly in the Sahel region.
    VL  - 14
    IS  - 1
    ER  - 

    Copy | Download

Author Information
  • Department of Physics and Chemistry, Higher Teacher Training College of N'djamena, N'djamena, Chad;African Laboratory for Sustainable Development Research, N'djamena, Chad

  • Department of Chemistry, University of N'Djamena, N'djamena, Chad

  • Department of Physics and Chemistry, Higher Teacher Training College of N'djamena, N'djamena, Chad

  • Department of Physics and Chemistry, Higher Teacher Training College of N'djamena, N'djamena, Chad;Department of Organic Chemistry, University of Yaoundé, Yaoundé, Cameroon

  • Department of Chemistry, University of N'Djamena, N'djamena, Chad