Tef [Eragrostis tef (Zucc.) Trotter L.] is a most important cereal crop in Ethiopia in terms of production, consumption and cash. The study was carried out to investigate grain yield stability and genotype by environment interaction for 18 genotypes conducted in the potential high land areas of Western Oromia, Ethiopia for two consecutive years (2020 to 2021) using Randomized Complete Block Experimental Design with three replications. The study of variance for grain yield using the AMMI model indicated highly significant variation for genotypes, environment, and genotype-environment interactions. Environment accounted for 18.7% of the variance in grain yield, 17.9% for genotypes, and 61.5% for genotypes. The first IPCA component accounted for 47.9% of the interaction effect and revealed the two models were fit. Genotypes G15, G10, G4, G1, and G3 had the lowest AMMI stability value (ASV), indicating stability; genotypes G16, G14, G9, G7, G2, and G5 had the highest ASV value, indicating instability. From over all analysis genotype G1 and G3, showed a high mean grain yield, lowest GSI, ASV and stable compared to other genotypes in the study. As a result, G1 and G3 were identified as the best genotypes for future breeding programs and potential release in Western Oromia, Ethiopia's highlands.
| Published in | Plant (Volume 12, Issue 3) |
| DOI | 10.11648/j.plant.20241203.11 |
| Page(s) | 37-47 |
| Creative Commons |
This is an Open Access article, distributed under the terms of the Creative Commons Attribution 4.0 International License (http://creativecommons.org/licenses/by/4.0/), which permits unrestricted use, distribution and reproduction in any medium or format, provided the original work is properly cited. |
| Copyright |
Copyright © The Author(s), 2024. Published by Science Publishing Group |
AMMI, ASV, Genotypes, Stability, Tef
Districts | Soil Parameters | Result | Soil Status | Remark | Climate Data | |
|---|---|---|---|---|---|---|
Temperature (°C) | Rainfall (mm) | |||||
Horo (Shambu) | pH (H2O) | 5.38-5.63 | Strong Acid to Moderate | 10.78-22.32 | 1566 | |
%OC | 3.08-4.46 | high | ||||
%OM | 3.93-6.09 | Moderate to high | ||||
%TN | 0.20-0.37 | Moderate to high | ||||
avaP | 3.73-4.68 | Low | Bray II Method | |||
Chaliya (Gedo) | pH(H2O) | 4.49-5.18 | Very strong acid to strong Acid | 11-28 | 900-1400 | |
%OC | 2.2-3.88 | Moderate to High | ||||
%OM | 3.80-6.69 | Moderate to high | ||||
%TN | 0.19-0.32 | Moderate to high | ||||
avaP | 3.75-5.92 | Low | Bray II Method | |||
Jimma Arjo (Arjo) | pH(H2O) | 4.45-5.98 | Very strong acid to Moderate acid | 16.8-36.5 | 1200-2200 | |
%OC | 1.17-2.11 | Low to Moderate | ||||
%OM | 2.02-3.63 | Low to Moderate | ||||
%TN | 0.1-0.18 | Low to Moderate | ||||
avaP | 2.74-3.93 | Low | Bray II Method | |||
No. | Entry code | Genotypes code |
|---|---|---|
1 | G1 | BK-01-1817 |
2 | G2 | BK-01-0217 |
3 | G3 | BK-01-0917 |
4 | G4 | BK-01-1017 |
5 | G5 | BK-01-0317 |
6 | G6 | BK-01-0617 |
7 | G7 | BK-01-7617 |
8 | G8 | BK-01-7717 |
9 | G9 | BK-01-3817 |
10 | G10 | BK-01-1617 |
11 | G11 | BK-01-4717 |
12 | G12 | BK-01-7217 |
13 | G13 | BK-01-2717 |
14 | G14 | BK-01-2917 |
15 | G15 | BK-01-3017 |
16 | G16 | BK-01-2417 |
17 | Check | Dursi |
18 | Check | Local |
Environments | |||||||
|---|---|---|---|---|---|---|---|
Row Labels | Arjo 2020 | Arjo 2021 | Gedo 2020 | Gedo 2021 | Shambu 2020 | Shambu 2021 | Grand Total |
G1 | 2.56 | 2.57 | 2.48 | 2.50 | 2.58 | 2.62 | 2.55 |
G10 | 2.07 | 1.26 | 1.40 | 1.99 | 2.14 | 1.88 | 1.79 |
G11 | 2.18 | 1.20 | 1.39 | 2.11 | 1.89 | 2.02 | 1.80 |
G12 | 1.71 | 1.20 | 1.35 | 1.47 | 1.46 | 1.92 | 1.52 |
G13 | 1.60 | 1.17 | 1.23 | 1.74 | 1.61 | 1.77 | 1.52 |
G14 | 2.04 | 1.90 | 1.90 | 2.34 | 1.94 | 2.37 | 2.08 |
G15 | 2.38 | 2.14 | 2.32 | 2.11 | 2.19 | 2.20 | 2.22 |
G16 | 2.33 | 1.84 | 2.15 | 2.64 | 2.24 | 2.35 | 2.26 |
G17 | 1.99 | 2.06 | 2.03 | 2.04 | 2.03 | 2.02 | 2.03 |
G18 | 1.78 | 1.72 | 1.63 | 1.91 | 1.82 | 1.81 | 1.78 |
G2 | 2.06 | 1.19 | 1.07 | 1.54 | 1.57 | 2.02 | 1.58 |
G3 | 2.47 | 2.54 | 2.49 | 2.60 | 2.56 | 2.52 | 2.53 |
G4 | 1.99 | 1.24 | 1.31 | 1.91 | 1.67 | 1.69 | 1.64 |
G5 | 2.00 | 1.23 | 1.55 | 1.75 | 1.29 | 2.25 | 1.68 |
G6 | 2.11 | 1.28 | 1.18 | 1.85 | 1.47 | 1.82 | 1.62 |
G7 | 1.63 | 1.23 | 1.06 | 1.24 | 1.38 | 1.77 | 1.39 |
G8 | 2.31 | 1.79 | 1.27 | 2.28 | 1.85 | 2.02 | 1.92 |
G9 | 1.93 | 1.44 | 2.16 | 2.00 | 2.02 | 2.14 | 1.95 |
Grand Total | 2.06 | 1.61 | 1.67 | 2.00 | 1.87 | 2.07 | 1.88 |
Source of variation | Df | Sum Sq | Mean Sq | F value | Pr (>F) | Proportion (%) | Accumulated |
|---|---|---|---|---|---|---|---|
ENV | 5 | 10.90 | 2.18 | 22.87 | 0.00 | 18.68 | |
REP(ENV) | 12 | 1.14 | 0.10 | 2.19 | 0.01 | 2.4 | |
GEN | 17 | 35.91 | 2.11 | 48.53 | 0.00 | 61.5 | |
GEN: ENV | 85 | 10.46 | 0.12 | 2.83 | 0.00 | 17.9 | |
PC1 | 21 | 5.01 | 0.24 | 5.48 | 0.00 | 47.9 | 47.9 |
PC2 | 19 | 2.16 | 0.11 | 2.62 | 0.00 | 20.7 | 68.6 |
PC3 | 17 | 1.75 | 0.10 | 2.37 | 0.00 | 16.8 | 85.3 |
PC4 | 15 | 1.02 | 0.07 | 1.56 | 0.09 | 9.7 | 95 |
PC5 | 13 | 0.52 | 0.04 | 0.92 | 0.53 | 5 | 100 |
Residuals | 204 | 8.88 | 0.04 | ||||
Total | 408 | 77.76 | 0.19 |
GEN | Mean R | Mean R | ASI | ASI_R | GSI | ASV | ASV R | WAAS | WAAS R |
|---|---|---|---|---|---|---|---|---|---|
G1 | 2.55 | 1 | 0.16 | 13 | 14 | 0.78 | 13 | 0.22 | 10 |
G10 | 1.79 | 10 | 0.12 | 9 | 19 | 0.59 | 9 | 0.23 | 11 |
G11 | 1.80 | 9 | 0.18 | 15 | 24 | 0.88 | 15 | 0.28 | 16 |
G12 | 1.52 | 17 | 0.06 | 5 | 22 | 0.30 | 5 | 0.08 | 3 |
G13 | 1.52 | 16 | 0.03 | 1 | 17 | 0.16 | 1 | 0.07 | 2 |
G14 | 2.08 | 5 | 0.05 | 3 | 8 | 0.24 | 3 | 0.07 | 1 |
G15 | 2.22 | 4 | 0.17 | 14 | 18 | 0.82 | 14 | 0.22 | 9 |
G16 | 2.26 | 3 | 0.03 | 2 | 5 | 0.16 | 2 | 0.10 | 4 |
G17 | 2.03 | 6 | 0.20 | 18 | 24 | 0.97 | 18 | 0.27 | 15 |
G18 | 1.78 | 11 | 0.12 | 8 | 19 | 0.59 | 8 | 0.19 | 7 |
G2 | 1.58 | 15 | 0.19 | 16 | 31 | 0.90 | 16 | 0.29 | 17 |
G3 | 2.53 | 2 | 0.19 | 17 | 19 | 0.79 | 14 | 0.26 | 13 |
G4 | 1.64 | 13 | 0.10 | 6 | 19 | 0.48 | 6 | 0.16 | 6 |
G5 | 1.68 | 12 | 0.15 | 10 | 22 | 0.72 | 10 | 0.25 | 12 |
G6 | 1.62 | 14 | 0.15 | 11 | 25 | 0.74 | 11 | 0.21 | 8 |
G7 | 1.39 | 18 | 0.05 | 4 | 22 | 0.26 | 4 | 0.13 | 5 |
G8 | 1.92 | 8 | 0.16 | 12 | 20 | 0.76 | 12 | 0.31 | 18 |
G9 | 1.95 | 7 | 0.12 | 7 | 14 | 0.56 | 7 | 0.27 | 14 |
AEA | Average Environmental Average |
AMMI | Additive Main Effects and Multiplicative Interaction |
AOE | Average Ordinate Environment |
ASV | AMMI Stability Value |
G x E | Genotype by Environment |
GEI | Genotype by Environment Interaction |
GSI | Genotype Selection Index |
MET | Multi-Environmental Trials |
WAAS | Weighted Average of Absolute Scores |
| [1] | Minten, B., Tamru, S., Engida, E. and Kuma, T., 2013. Ethiopia’s value chains on the move: The case of teff. Ethiopia Strategy Support Program II Working Paper, 52, pp. 1-26. |
| [2] | Belete, T., Mathewos, T. and Daba, G., 2020. Correlation of yield and yield related traits of Tef (Eragrostis tef (Zucc.) Trotter) varieties in Ethiopia. Journal of Genetic and Environment Conservation, 8(3), pp. 35-39. |
| [3] | Chanyalew, S., Kebede, W., Fikre, T., Genet, Y., Jifar, H., Demissie, M., Tolossa, K., Tadesse, M., Tadele, Z. and Assefa, K., 2021. Tef breeding manual. Ethiopian Institute of Agricultural Research, Debre Zeit Agricultural Research Center, National Tef Research Program, Debre Zeit, Ethiopia. |
| [4] | Yazachew, G., Ch, S., Tsion, F., Worku, K., Kidist, T., Mengistu, D., Kebebew, A. and Habte, J., 2021. Genotype by Environment Interaction and Grain Yield Stability Analysis of Advanced TEF Genotypes for High Potential TEF Growing Areas of Ethiopia. J Adv Plant Sci, 3, p. 204. |
| [5] | Li, P., He, W. and Wu, G., 2021. Composition of amino acids in foodstuffs for humans and animals. Amino acids in nutrition and health: amino acids in gene expression, metabolic regulation, and exercising performance, pp. 189-210. |
| [6] | Barretto, R., Buenavista, R. M., Rivera, J. L., Wang, S., Prasad, P. V. and Siliveru, K., 2021. Teff (Eragrostis tef) processing, utilization and future opportunities: a review. International Journal of Food Science & Technology, 56(7), pp. 3125-3137. |
| [7] | Yan, W., Hunt, L., Sheng, Q. and Szlavnics, Z. 2000. Cultivar evaluation and mega-environment investigation based on the GGE-biplot. Crop Science., 40: 597– 605 |
| [8] | Tsenov, N., Gubatov, T. and Yanchev, I., 2023. The impact of genotype, environment, and genotype× environment interaction on wheat grain yield and quality. Rastenievdni Nauki, 60(3). |
| [9] | Taleghani, D., Rajabi, A., Saremirad, A. and Fasahat, P., 2023. Stability analysis and selection of sugar beet (Beta vulgaris L.) genotypes using AMMI, BLUP, GGE biplot and MTSI. Scientific reports, 13(1), p. 10019. |
| [10] | Abate, M., 2020. Genotype by environment interaction and yield stability analysis of open pollinated maize varieties using AMMI model in Afar Regional State, Ethiopia. Journal of Plant breeding and crop science, 12(1), pp. 8-15. |
| [11] | Alves, F. C., Galli, G., Matias, F. I., Vidotti, M. S., Morosini, J. S. and Fritsche-Neto, R., 2021. Impact of the complexity of genotype by environment and dominance modeling on the predictive accuracy of maize hybrids in multi-environment prediction models. Euphytica, 217, pp. 1-17. |
| [12] | Kolawole, A. O. and Olayinka, A. F., 2022. Phenotypic performance of new pro-vitamin A maize (L.) hybrids using three selection indices. Agriculture (Pol'nohospodárstvo), 68(1), pp. 1-12. |
| [13] | Senguttuvel, P., Sravanraju, N., Jaldhani, V., Divya, B., Beulah, P., Nagaraju, P., Manasa, Y., Prasad, A. H., Brajendra, P., Gireesh, C. and Anantha, M. S., 2021. Evaluation of genotype by environment interaction and adaptability in lowland irrigated rice hybrids for grain yield under high temperature. Scientific reports, 11(1), p. 15825. |
| [14] | Bekana, G., 2023. Genotype X Environment Interactions and Yield Stability of Tef (Eragrostis tef) Genotypes Grown in Central Parts of Ethiopia. American Journal of BioScience, 11(4), pp. 104-110. |
| [15] | Yali, W., 2022. Review on effect of genotype x environment interaction and yield stability among sorghum (Sorghum bicolor (L.) Moench.) genotypes. Int J Genetics Genom, 10(1), pp. 12-20. |
| [16] | Bayable, M., Tsunekawa, A., Haregeweyn, N., Alemayehu, G., Tsuji, W., Tsubo, M., Adgo, E., Tassew, A., Ishii, T., Asaregew, F. and Masunaga, T., 2021. Yield potential and variability of teff (Eragrostis tef (zucc.) trotter) germplasms under intensive and conventional management conditions. Agronomy, 11(2), p. 220. |
| [17] | Belay, N., 2022. Genotype-by-environment interaction of maize testcross hybrids evaluated for grain yield using GGE biplots. |
| [18] | Bedru, N., Matiwos, T., Birhan, T. and Belete, T., 2024. Performance Evaluation of Different Sorghum Genotypes (Sorghum bicolour (L.) Moench) Using GGE Bi-plot Stability Analysis. International Journal of Genetics, 12(2), pp. 19-30. |
| [19] | Olivoto, T. and Lúcio, A. D. C., 2020. metan: An R package for multi-environment trial analysis. Methods in Ecology and Evolution, 11(6), pp. 783-789. |
| [20] | Pour-Aboughadareh, A., Khalili, M., Poczai, P. and Olivoto, T., 2022. Stability indices to deciphering the genotype-by-environment interaction (GEI) effect: An applicable review for use in plant breeding programs. Plants, 11(3), p. 414. |
| [21] | Ghazy, M. I., Abdelrahman, M., El-Agoury, R. Y., El-Hefnawy, T. M., El-Naem, S. A., Daher, E. M. and Rehan, M., 2023. Exploring Genetics by Environment Interactions in Some Rice Genotypes across Varied Environmental Conditions. Plants, 13(1), p. 74. |
| [22] | Rubiales, D., Moral, A. and Flores, F., 2022. Performance of winter-sown chickpea breeding lines with contrasting levels of resistance to Ascochyta blight. Agronomy, 12(9), p. 2194. |
| [23] | Al-Sayaydeh, R., Shtaya, M. J., Qubbaj, T., Al-Rifaee, M. K., Alabdallah, M. A., Migdadi, O., Gammoh, I. A. and Al-Abdallat, A. M., 2023. Performance and stability analysis of selected durum wheat genotypes differing in their kernel characteristics. Plants, 12(14), p. 2664. |
| [24] | Yue, H., Olivoto, T., Bu, J., Li, J., Wei, J., Xie, J., Chen, S., Peng, H., Nardino, M. and Jiang, X., 2022. Multi-trait selection for mean performance and stability of maize hybrids in mega-environments delineated using envirotyping techniques. Frontiers in Plant Science, 13, p. 1030521. |
| [25] | Alemayhu Balcha (2020). Additive Main Effects and Multiplicative Interaction and Other Stability Analyses of Tef [Eragrostis tef (Zucc.) Trotter] Grain Yield. Am J Plant Sci 11: 793-802. |
| [26] | Oliveira, I. C. M., Guilhen, J. H. S., de Oliveira Ribeiro, P. C., Gezan, S. A., Schaffert, R. E., Simeone, M. L. F., Damasceno, C. M. B., de Souza Carneiro, J. E., Carneiro, P. C. S., da Costa Parrella, R. A. and Pastina, M. M., 2020. Genotype-by-environment interaction and yield stability analysis of biomass sorghum hybrids using factor analytic models and environmental covariates. Field Crops Research, 257, p. 107929. |
| [27] | Enyew, M., Feyissa, T., Geleta, M., Tesfaye, K., Hammenhag, C. and Carlsson, A. S., 2021. Genotype by environment interaction, correlation, AMMI, GGE biplot and cluster analysis for grain yield and other agronomic traits in sorghum (Sorghum bicolor L. Moench). Plos one, 16(10), p.e0258211. |
| [28] | Singamsetti, A., Shahi, J. P., Zaidi, P. H., Seetharam, K., Vinayan, M. T., Kumar, M., Singla, S., Shikha, K. and Madankar, K., 2021. Genotype× environment interaction and selection of maize (Zea mays L.) hybrids across moisture regimes. Field Crops Research, 270, p. 108224. |
| [29] | Gupta, V., Kumar, M., Singh, V., Chaudhary, L., Yashveer, S., Sheoran, R., Dalal, M. S., Nain, A., Lamba, K., Gangadharaiah, N. and Sharma, R., 2022. Genotype by environment interaction analysis for grain yield of wheat (Triticum aestivum (L.) em. Thell) genotypes. Agriculture, 12(7), p. 1002. |
| [30] | Crossa, J., H. G. Gauch and R. W. Zobel 1990. Additive main effects and multiplicative interaction analysis of two international maize cultivar trials. Crop Sci., 30: 493-500 |
| [31] | Zobel, R. W., Wright, M. J. & Gauch, H. G. 1988. Statistical analysis of a yield trial. Agronomy journal, 80, 388-393. |
| [32] | Balcha, A. A. and Abdisa, G., 2022. Analysis on current trends and challenges that determine sustainable growth of small and medium enterprises (smes) during covid-19 in ethiopia. A case of oromia regional state, ambo town. Academy of Entrepreneurship Journal, 28(5). |
| [33] | Jiwuba, L., Danquah, A., Asante, I., Blay, E., Onyeka, J., Danquah, E. and Egesi, C., 2020. Genotype by environment interaction on resistance to cassava green mite associated traits and effects on yield performance of cassava genotypes in Nigeria. Frontiers in Plant Science, 11, p. 572200. S. E. |
| [34] | Mwale, S. E., Shimelis, H., Nkhata, W., Sefasi, A., Fandika, I. and Mashilo, J., 2022. Genotype-by-Environment interaction in tepary bean (Phaseolus acutifolius A. Gray) for seed yield. Agronomy, 13(1), p. 12. |
| [35] | Al-Naggar, A. M. M., Shafik, M. M. and Musa, R. Y. M., 2020. Ammi and gge biplot analyses for yield stability of nineteen maize genotypes under different nitrogen and irrigation levels. Plant Arch, 20(2), pp. 4431-4443. |
| [36] | Hassani, M., Mahmoudi, S. B., Saremirad, A. and Taleghani, D., 2023. Genotype by environment and genotype by yield* trait interactions in sugar beet: analyzing yield stability and determining key traits association. Scientific Reports, 13(1), p. 23111. |
| [37] | Worede, F., Mamo, M., Assefa, S., Gebremariam, T. and Beze, Y., 2020. Yield stability and adaptability of lowland sorghum (Sorghum bicolor (L.) Moench) in moisture-deficit areas of Northeast Ethiopia. Cogent Food & Agriculture, 6(1), p. 1736865. |
| [38] | Gerrano, A. S., Jansen van Rensburg, W. S., Mathew, I., Shayanowako, A. I., Bairu, M. W., Venter, S. L., Swart, W., Mofokeng, A., Mellem, J. and Labuschagne, M., 2020. Genotype and genotype× environment interaction effects on the grain yield performance of cowpea genotypes in dryland farming system in South Africa. Euphytica, 216, pp. 1-11. |
| [39] | Lal, R. K., Chanotiya, C. S. and Mishra, A., 2022. Mega-environment investigation based on the GGE biplot and genotype selection for high essential oil yield in vetiver grass (Chrysopogon zizanioides L. Roberty). Acta Ecologica Sinica, 42(5), pp. 542-552. |
| [40] | Yan, W. and Tinker, N. A., 2006. Biplot analysis of multi-environment trial data: Principles and applications. Canadian journal of plant science, 86(3), pp. 623-645. |
| [41] | Yan, W., 2001. GGEbiplot—A Windows application for graphical analysis of multienvironment trial data and other types of two-way data. Agronomy journal, 93(5), pp. 1111-1118. |
| [42] | Yan, Y., Gu, P., Zheng, S., Zheng, M., Pang, H. and Xue, H., 2016. Facile synthesis of an accordion-like Ni-MOF superstructure for high-performance flexible supercapacitors. Journal of Materials Chemistry A, 4(48), pp. 19078-19085. |
| [43] | Frutos, E., Galindo, M. P. and Leiva, V., 2014. An interactive biplot implementation in R for modeling genotype-by-environment interaction. Stochastic Environmental Research and Risk Assessment, 28, pp. 1629-1641. |
| [44] | Getahun, A. A., 2020. Challenges and opportunities of information and communication technologies for dissemination of agricultural information in Ethiopia. International Journal of Agricultural Extension, 8(1), pp. 57-65. |
| [45] | Sedhom, S. A., El-Badawy, M. E. M., Hosary, A. A. E., Abd El-Latif, M. S., Rady, A. M., Moustafa, M. M., Mohamed, S. A., Badr, O. A., Abo-Marzoka, S. A., Baiumy, K. A. and El-Nahas, M. M., 2021. Molecular markers and GGE biplot analysis for selecting higher-yield and drought-tolerant maize hybrids. Agronomy Journal, 113(5), pp. 3871-3885. |
| [46] | Yan, W., Kang, M. S., Ma, B., Woods, S. and Cornelius, P. L., 2007. GGE biplot vs. AMMI analysis of genotype-by-environment data. Crop science, 47(2), pp. 643-653. |
| [47] | Yan, W., Pageau, D., Frégeau-Reid, J. and Durand, J., 2011. Assessing the representativeness and repeatability of test locations for genotype evaluation. Crop Science, 51(4), pp. 1603-1610. |
APA Style
Chemeda, G., Bakala, N. (2024). Genotype by Environment Interaction and Stability Analysis for Grain Yield in White Seeded Tef [Eragrostis tef (zucc.)Trotter] Genotypes in Western Oromia, Ethiopia. Plant, 12(3), 37-47. https://doi.org/10.11648/j.plant.20241203.11
ACS Style
Chemeda, G.; Bakala, N. Genotype by Environment Interaction and Stability Analysis for Grain Yield in White Seeded Tef [Eragrostis tef (zucc.)Trotter] Genotypes in Western Oromia, Ethiopia. Plant. 2024, 12(3), 37-47. doi: 10.11648/j.plant.20241203.11
AMA Style
Chemeda G, Bakala N. Genotype by Environment Interaction and Stability Analysis for Grain Yield in White Seeded Tef [Eragrostis tef (zucc.)Trotter] Genotypes in Western Oromia, Ethiopia. Plant. 2024;12(3):37-47. doi: 10.11648/j.plant.20241203.11
@article{10.11648/j.plant.20241203.11,
  author = {Girma Chemeda and Natol Bakala},
  title = {Genotype by Environment Interaction and Stability Analysis for Grain Yield in White Seeded Tef [Eragrostis tef (zucc.)Trotter] Genotypes in Western Oromia, Ethiopia
},
  journal = {Plant},
  volume = {12},
  number = {3},
  pages = {37-47},
  doi = {10.11648/j.plant.20241203.11},
  url = {https://doi.org/10.11648/j.plant.20241203.11},
  eprint = {https://article.sciencepublishinggroup.com/pdf/10.11648.j.plant.20241203.11},
  abstract = {Tef [Eragrostis tef (Zucc.) Trotter L.] is a most important cereal crop in Ethiopia in terms of production, consumption and cash. The study was carried out to investigate grain yield stability and genotype by environment interaction for 18 genotypes conducted in the potential high land areas of Western Oromia, Ethiopia for two consecutive years (2020 to 2021) using Randomized Complete Block Experimental Design with three replications. The study of variance for grain yield using the AMMI model indicated highly significant variation for genotypes, environment, and genotype-environment interactions. Environment accounted for 18.7% of the variance in grain yield, 17.9% for genotypes, and 61.5% for genotypes. The first IPCA component accounted for 47.9% of the interaction effect and revealed the two models were fit. Genotypes G15, G10, G4, G1, and G3 had the lowest AMMI stability value (ASV), indicating stability; genotypes G16, G14, G9, G7, G2, and G5 had the highest ASV value, indicating instability. From over all analysis genotype G1 and G3, showed a high mean grain yield, lowest GSI, ASV and stable compared to other genotypes in the study. As a result, G1 and G3 were identified as the best genotypes for future breeding programs and potential release in Western Oromia, Ethiopia's highlands.
},
 year = {2024}
}
TY  - JOUR
T1  - Genotype by Environment Interaction and Stability Analysis for Grain Yield in White Seeded Tef [Eragrostis tef (zucc.)Trotter] Genotypes in Western Oromia, Ethiopia

AU  - Girma Chemeda
AU  - Natol Bakala
Y1  - 2024/07/29
PY  - 2024
N1  - https://doi.org/10.11648/j.plant.20241203.11
DO  - 10.11648/j.plant.20241203.11
T2  - Plant
JF  - Plant
JO  - Plant
SP  - 37
EP  - 47
PB  - Science Publishing Group
SN  - 2331-0677
UR  - https://doi.org/10.11648/j.plant.20241203.11
AB  - Tef [Eragrostis tef (Zucc.) Trotter L.] is a most important cereal crop in Ethiopia in terms of production, consumption and cash. The study was carried out to investigate grain yield stability and genotype by environment interaction for 18 genotypes conducted in the potential high land areas of Western Oromia, Ethiopia for two consecutive years (2020 to 2021) using Randomized Complete Block Experimental Design with three replications. The study of variance for grain yield using the AMMI model indicated highly significant variation for genotypes, environment, and genotype-environment interactions. Environment accounted for 18.7% of the variance in grain yield, 17.9% for genotypes, and 61.5% for genotypes. The first IPCA component accounted for 47.9% of the interaction effect and revealed the two models were fit. Genotypes G15, G10, G4, G1, and G3 had the lowest AMMI stability value (ASV), indicating stability; genotypes G16, G14, G9, G7, G2, and G5 had the highest ASV value, indicating instability. From over all analysis genotype G1 and G3, showed a high mean grain yield, lowest GSI, ASV and stable compared to other genotypes in the study. As a result, G1 and G3 were identified as the best genotypes for future breeding programs and potential release in Western Oromia, Ethiopia's highlands.

VL  - 12
IS  - 3
ER  -
Oromia Agricultural Research Institute, Bako Agricultural Research Centre, Bako, Ethiopia
Oromia Agricultural Research Institute, Bako Agricultural Research Centre, Bako, Ethiopia
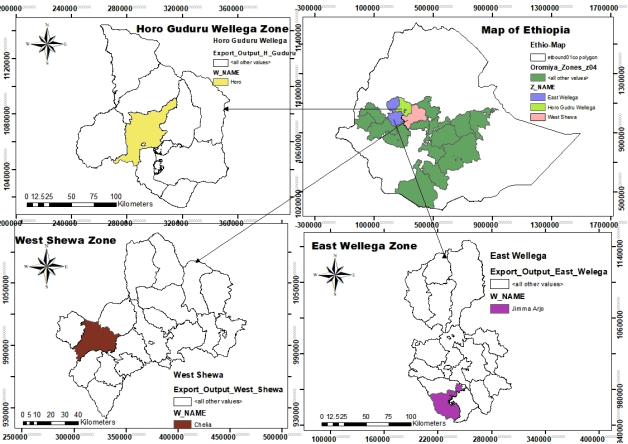
Figure 1. Geographical location of map of selected districts of western Oromia.
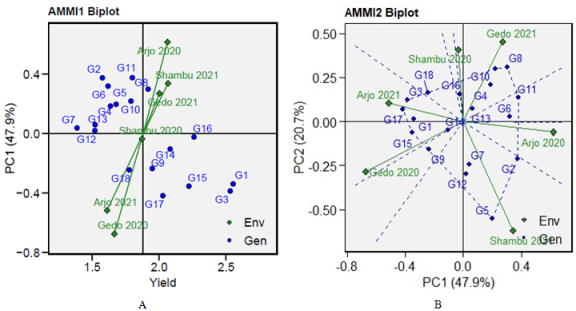
Figure 2. (A) The “AMMI1” biplot displays the main effect (Grain Yield) and IPC1 effect values explaining the relationship among tested white tef genotypes and environments. (B) The “AMMI2” biplot displays the main axes of G+GEI effect (IPCA1 and IPCA2) values for the tested genotypes and environments.
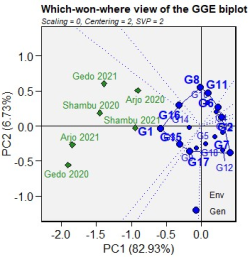
Figure 3. The which-won-where view of the GGE scatter bi-plot showing white seeded tef genotypes with best performance in each environment and mega environments (MGEs) for grain yield.
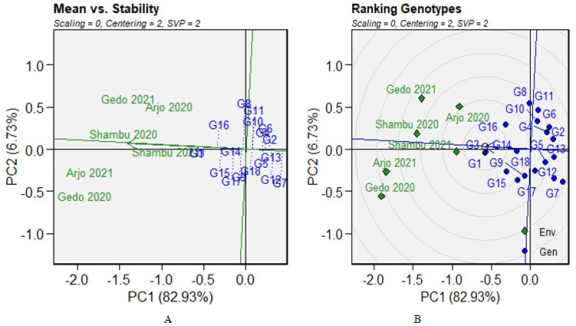
Figure 4. (A) The “mean versus stability” model describing the interaction effect of the tested tef genotypes evaluated across six environments. (B) The “ranking genotypes” model of biplot to assess the ideal genotype. The tested genotypes are 18 (G1:G34 in blue color) grown in four locations in the two consecutive years.
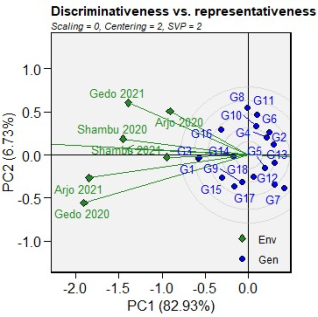
Figure 5. The “discriminating power vs. representativeness” view of the GGE biplot based on 18 tef genotypes tested at five test environments.
Information

