Research Article | | Peer-Reviewed

Use of Geo-Information Technologies in Predicting Urban Growth Trends; An Integrated Simulation Approach: The Case Study of Limuru Central Ward

Received: 22 August 2024     Accepted: 26 November 2024     Published: 13 December 2024
Views:       Downloads:
Abstract

Urban areas exhibit different growth patterns spanning from linear development, transit-oriented development, concentric zonal development to multi-nuclei development patterns. In the world we live in today, main urban areas present themselves as Central Business Districts (CBDs), that double up as mixed use commercial and residential areas, which serve most of the population who live in and around them. Ideally, the CBD sites – for most cities around the world, were identified in advance, making it easier for the local authorities to demarcate and plan for sustainable development. Most, if not all jobs, are in these urban areas, making these employment areas urban growth hotspots. Changes in economic processes and evolution of transport networks are the foundation of urban growth and expansion, in that, there is a shift from functional specialization of the CBD to economic specialization of the surrounding urban areas, as in the case of Rhine Main Region in Germany. In Kenya, most of the known urban areas, like Limuru Town, emerged as traditional markets in the 1900’s and grew to modern urban areas and municipalities. Urban growth in Limuru was propelled by the existence of modern infrastructure, reduced land rates, presence of government facilities, security, water and employment from the nearby tea farms and factories. However, urban growth has been accompanied by rapid land use changes and sporicidal growth of informal settlements. As a result, urban areas growing in Limuru Central Ward, are deprived of basic infrastructure, public purpose facilities, land use harmonization and spatial synergies. This study therefore attempts to explore the use of GIS and Remote sensing technologies in observing past and present urban growth trends, that pave the way for predicting sustainable urban planning. The findings from this study are expected to contribute to the knowledge of simulating how urban centers can be planned in the present to cater for the future needs of the growing population. Predicting urban growth trends introduces more practical ways of spatial planning and policy development in developing countries, through spatial analysis and modelling using GIS and Remote Sensing technologies.

Published in Urban and Regional Planning (Volume 9, Issue 4)
DOI 10.11648/j.urp.20240904.13
Page(s) 146-161
Creative Commons

This is an Open Access article, distributed under the terms of the Creative Commons Attribution 4.0 International License (http://creativecommons.org/licenses/by/4.0/), which permits unrestricted use, distribution and reproduction in any medium or format, provided the original work is properly cited.

Copyright

Copyright © The Author(s), 2024. Published by Science Publishing Group

Keywords

Urban Areas, Simulation, Prediction, Urban Development

1. Introduction
Urban growth is the continuous spatial expansion of urban areas with respect to changing times, resulting in evolved urban spatial structures. The three major urban growth types are; infilling growth, edge expansion and spontaneous growth. Some of the urban growth accelerating factors are; immigration, commercialization, industrialization and availability of public purpose facilities and security. The more prevalent these factors are in each urban area; the more urban growth is observed .
Globally, Europe has been the central focus of multiple urban development studies especially due to the existence of economic vibrant cities and increasing globalization. In Europe, major population concentrations and vibrant businesses are in core cities, where else their linkage to second tier cities or sub centers give them a continuous supply of human capital. This helps them boost their competitiveness with other regions on a global scale.
Germany, which is at the heart of Europe, has exhibited major changes in its urban system since the 20th century. Today, Germany has three metropolitan regions – Berlin, Munich and Rhine Main, which have core cities and primary hubs of economic development, making urban agglomerations more attractive to investors than the suburban areas and some core centers. The hinterlands with time have grown to become residential and employment areas, since firms and industries relocate to exclusive planned zones within their vicinity, to avoid the high land rents they are subjected to in the core urban areas. The shift of these firms and industries to the hinterlands, spurred growth of secondary employment centers, that later evolved to fully functional employment sub centers. Hence, these sub centers with time gained their independence from the main city .
Developing African countries have been growing steadily since the beginning of the 20th century, only to realize their exponential growth in the 21st century. For a country like Ethiopia, Addis Ababa is its largest city or in other terms, its primate city, surrounded by smaller urban centers. The size of the capital is attributed to the rising rural - urban migrations. Addis Ababa is riddled with concentration of human activities in the core region, as it gives its residents the hope of employment and better standards of living, where-else the urban periphery lacks a stable employment environment, proper infrastructure and social amenities. Being the primate city or capital, it is home to most of the administrative functions and therefore lacks the ability to serve the whole threshold population equally and efficiently . Projects like the “Design of Sustainable Urban Transport Solutions for Addis Ababa (SUSTRAIN): Implementation of Bus Rapid Transit (BRT)”, have contributed to the city’s evolving urban spatial structure, as it has progressively linked the capital and its surrounding towns, hence uplifting the regions overall urban status .
In Kenya, we have the Nairobi Metropolitan Region (NMR), which comprises of Nairobi City, Kiambu, Kajiado, Machakos and Murang’a Counties. Growth in Nairobi City County has resulted in urban sprawl within the adjacent counties, prompting planning of the Nairobi Metropolitan Region. The growth trajectory shows that most of the people are moving from Nairobi towards Kiambu County, especially in dormitory towns like Kiambu, Juja and Limuru. However, Kiambu county, unlike Nairobi City County, has fertile hinterlands that surround the majority of its urban areas, thus prompting the need to protect these food reserves from the effects of urbanization. Urbanization of this magnitude has restructured the urban development of Kiambu and it’s for that reason, this study focuses its investigation on predicting urban growth trends, especially in Limuru Central Ward within Kiambu County .
Studies have been conducted to show the impact of urbanization on their intermediate environment. One such study was conducted in Iran . An integrated urban growth prediction model was used to come up with three scenarios for predicting future urbanization trends in Gorgan, Iran. This study employed SLEUTH to come up with three urban growth scenarios - historical, managed and aesthetically sound scenarios; and GIS and machine learning to test the viability of these scenarios on simulating future urban growth of the study area. As a result, the study came up with an objective approach of modelling ways to preserve the aesthetic values of the landscapes, while encouraging compact urban growth and better urban management.
This research focused on one of the most urbanized sections of Limuru Sub - County, in particular, Limuru Central Ward which has; the Limuru Central Business District, upcoming multi story commercial buildings, major transport corridors; and boarders Kiambethu Tea Farm, Misri Informal settlement, Ngubi Forest, Manguo Swamp and other water bodies. In 1969, the CBD site was demarcated in advance making it easier for the local authorities to locate and plan for its use, and yet, we observe commercial activities growing away from the planned CBD and withing residential areas.
The specific objectives of this research were; to investigate the factors that drive urban development in small and medium urban centers in developing countries like Kenya, to study urban development trends in small and medium urban centers such as Limuru Central Ward, and to explore the potential use of Geo-Information Technologies in simulating, predicting and monitoring urban growth patterns in rapidly urbanizing areas of developing countries.
This study has revealed that it is possible for urbanization to take place in areas away from the main administrative centers. It is for that reason that simulating the future urban trends was necessary to pinpoint the potential areas of growth and urban expansion. Based on the main objective and the study objectives, the study achieved an array of results. From this study we have seen that in future, the urban footprint is likely to increase near existing urban areas, along transport networks and near institutions such as schools. The urban footprint may likely adopt a mix or urban growth models – such us the multi nuclei and sector models, however, majority of the urban area may most likely be located within proximity to the transport network and thus require setting up of new transport network especially in the inaccessible parts of the region.
It was therefore paramount for this study to employ GIS and Remote Sensing techniques to simulate urban growth patterns, as opposed to conventional theoretical analysis which project urban development in non-statistical methods.
2. Materials and Methods
2.1. Study Area
Kenya has 47 counties. Our study area is located within Kiambu County. Kiambu County consists of 12 constituencies or sub-counties. Figure 1 shows where Limuru Sub County is located within Kiambu County.
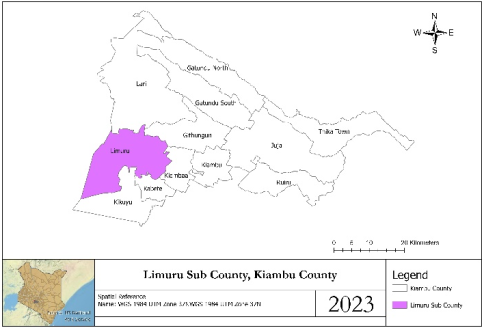
Figure 1. Limuru Sub County in Kiambu County.
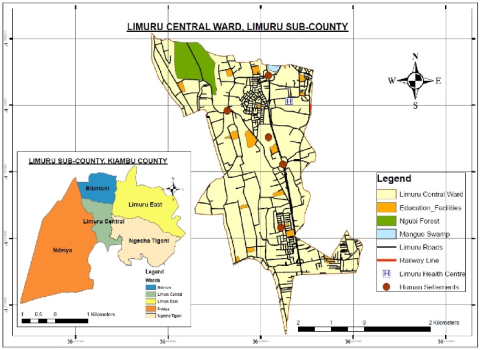
Figure 2. Limuru Central Ward in Limuru Sub-County.
Limuru Sub County has a total of 5 Wards. The study area covers the growing urban areas within Limuru Central Ward. The study area is approximately 22.23 km2. Limuru Town, which is the most urbanized area in Limuru Central Ward, is about 35.1 Km from the Nairobi CBD and is on an elevation of 2,257 m. It is situated at 237715.18 m East and 9877534.99 m South (UTM 37 S). Figure 2 shows the location of Limuru Central Ward within Limuru Sub County.
2.2. Data Collection
The data was sourced using both primary and secondary methods. The data included; The Limuru Topo Sheet 148/1, 30-m resolution Landsat images sourced from the US Geological Survey Website – (Landsat-7 Enhanced Thematic Mapper Plus (ETM+) – for the year 1999, 2003, Landsat-5 Thematic Mapper (TM) product – – for the year 2009 and Landsat-8 Operational Land Imager (OLI) – for the year 2014, 2019, 2023), and shapefiles.
The primary data was mainly used to develop the base map of the study area. The secondary data was used to develop LULC change and prediction maps, land surface temperature maps and compute -built index and derive spatial characteristics of the study area.
2.3. Methodology
The methodology shown in Figure 3 below, was divided into three stages; The raster process, the vector process, and the integrated simulation process. The raster process involved downloading Landsat images for the years; 1999, 2003, 2009, 2014, 2019 and 2023. All these images had undergone some atmospheric corrections processes, such as geometric and radiometric corrections, before they were classified using the supervised classification method in ArcGIS. The vector processes included, updating, digitizing, sorting and cleaning the shapefiles , and clipping to the shapefiles to the study areas’ extent. Thereafter a GIS database was created to store all the vector data needed in the study. Clipping the study area, enabled clipping the processed raster images and prepared the base map.
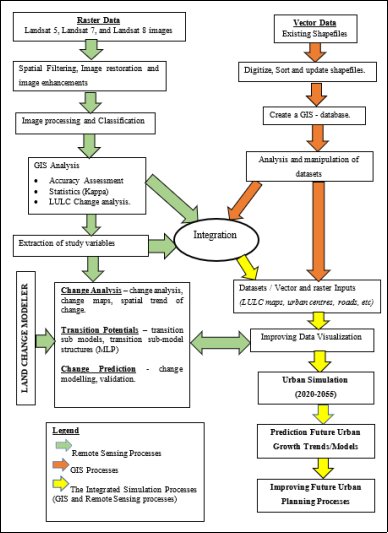
Figure 3. The Methodology.
The integrated processes included computing accuracy assessment, Kappa, and LULC Change analysis on the classified images, which helped in producing statistical information of the study area. The vector datasets which were analyzed, were later used to generate the inputs, required by the Land Change Modeler for prediction, simulation and monitoring.
3. Results
In other studies, urban prediction has been done using SLEUTH in QGIS while others have utilized CA_MARKOV in Terraset or IDRISI software. Some of these previous studies include; Predicting the future urban growth and it's impacts on the surrounding environment using urban simulation models: Case study of Ibb city – Yemen and Modelling and Predicting Urban Growth of Nairobi City Using Cellular Automata with Geographical Information Systems by .
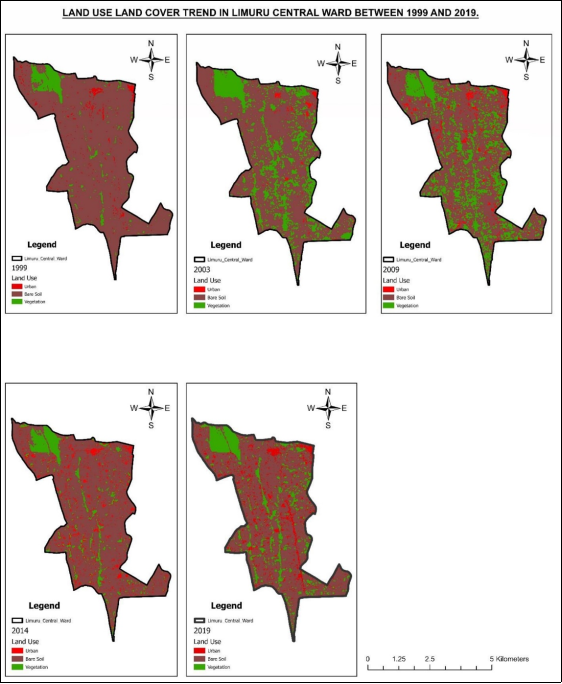
Figure 4. LULC Trends in Limuru Central Ward (1999 - 2019).
In this study, Landsat images were classified into three major land uses; Urban (Built Up Area), Bare Soil and Vegetation. This was done to ensure that the output generated in ArcGIS was processed smoothly from inception to prediction, since all the inputs were required to be within the same processing range. The method of classification used was the Maximum Likelihood Supervised classification in ArcGIS Pro of Landsat images of the years, 1999, 2003, 2009, 2014 and 2019, shown in Figure 4 and the results of the classification, are summarized in Table 1 below. The accuracy assessment during classification ranged from 75% to above 90%.
Table 1. LULC Values in Limuru Central Ward (1999 - 2019).

Land Use

Class Value

1999

2003

2009

2014

2019

Urban/Built-up

20

2%

3%

5%

8%

9%

Bare Soil

30

91%

72%

68%

83%

75%

Vegetation

40

7%

26%

28%

10%

15%

3.1. Modelling Results of the Land Change Modeler (LCM)
The LCM was used to analyze the classified images of the study area to derive the past and present urban growth trends and to predict and simulate the future urban growth trends. Prior to modelling, GIS analysis was performed to extract spatial and statistical information. The classified raster images in ArcGIS Pro, were imported in IDRISI, for further processing. The LCM process requires only two classified images; hence this study used the 1999 and 2019 Maximum Likelihood Supervised Classified Raster Images.
3.1.1. Gains and Losses Between 1999 and 2019 (in km2)
In this study, it is evident that; undeveloped areas near urban centers are susceptible to land changes and the magnitude of change that occurs on bare land is useful in determining whether people value farm production or urban growth. Figure 5 shows that between 1999 and 2019, the Built up and vegetative areas significantly increased in Limuru Central Ward, while the space occupied by bare soil decreased.
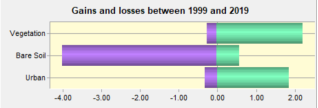
Figure 5. Gains and Losses between 1999 and 2019 (in km2).
In Figure 6, the built-up area and the vegetation had a positive increase in Limuru Central Ward, while Bare soil decreased over time to accommodate the growth of the other two major land uses.
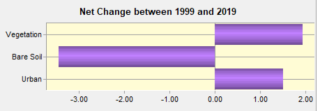
Figure 6. Net Change between 1999 and 2019 (in km2).
In Figure 7, urban areas increased when Bare Land decreased, while there was little decrease in Vegetation cover as a response to the steady increase of the Built-up areas (Urban).
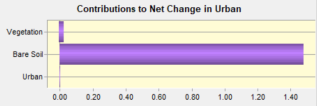
Figure 7. Contribution to Net Change in Urban (in km2).
In Figure 8, there was an overall decrease in Bare soil with the steady increase of the Built-up areas and Vegetation.
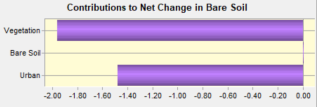
Figure 8. Contributions to Net Change in Bare Soil (in km2).
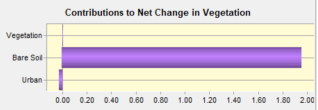
Figure 9. Contribution to Net Change in Vegetation (in km2).
In Figure 9, Urban/Built up areas increased when Bare Land decreased, while there was no observable decrease in the Urban areas/Built areas when Vegetation increased.
3.1.2. Production of Change Maps)
This research mapped spatial changes within a threshold of more than 1 km2 and ignored transitions that were less than 0.3 km2. This threshold was used to identify major significant land use changes in Limuru Central Ward.
Figure 10 shows that the highest transition potential recorded in the study area between 1999 to 2019, represent land use land cover changes from bare soil to urban, from urban to bare soil in some areas and from bare soil to vegetation. Land use changes from bare soil to urban give way to development of clusters of urban developments, changes from urban to bare soil, paved way for future farming and areas for future urban development, while changes from bare soil to vegetation pave way to farming and preservation of forested areas.
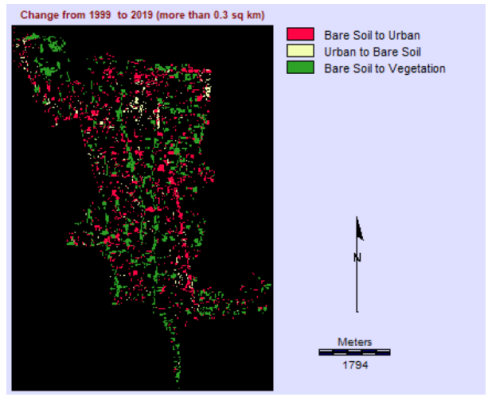
Figure 10. Land Use Changes between 1999 and 2019 (more than 0.3 km2).
3.1.3. Transition Potential Maps
Transition potential maps describe the probability that a transition may occur in the modelled landscape and will be used in predicting future change in Limuru Central Ward. Transition potential modelling employed Multi-layer Perception (MLP) neural network which is a machine learning tool. Once calibrated it was used to predict future scenarios. By default, each transition is a separate sub-model, but multiple transitions can be grouped into a single sub-model if it is considered that they all result from the same underlying driving forces. The transition sub-models were grouped into a single sub model and the variable transformation utilities was used to create transitional variables.
Only MLP can be used to model multiple transitions in one sub-model, hence producing more accurate results in this study. In general, as the number of transitions that are grouped into one sub-model increases, the task becomes more and more difficult for MLP to solve. This can easily be gauged from the validation accuracy report that the MLP provides.
3.1.4. Transition Variables
MLP creates a multivariate function that is trained to predict transition based on the values of the driver variables. On the Variable Transformation Utility Panel (VTUP), the MLP option does not require the variables to be linearly related, but transformation can sometimes make the task easier for it to solve in cases of strong non-linearities, thus yielding a higher accuracy. For all model types, logistic regression, MLP and SimWeight, variables must either be converted into a set of Boolean (dummy) variables or transformed using the evidence likelihood transformation option (which is highly recommended).
The Change Analysis tab was used to create Boolean maps of areas that have gone through the transition being modelled. Static and dynamic variables were determined at each time step of the prediction stage of the model, dense vegetation within the study areas that’s not Ngubi forest, is dynamic because with the increase in the built areas, there is evidence of encroachment and hence a reduction of the vegetation cover due to encroachment.
The driver variables were; slope, DEM, and distance from main urban centers, roads, schools, Ngubi forest, Manguo swamp. The MLP neural network has been extensively enhanced to offer an automatic model that requires no user intervention. The transition variables in Figure 11 below, were used as inputs for the transition model, to compute the simulation and prediction maps.
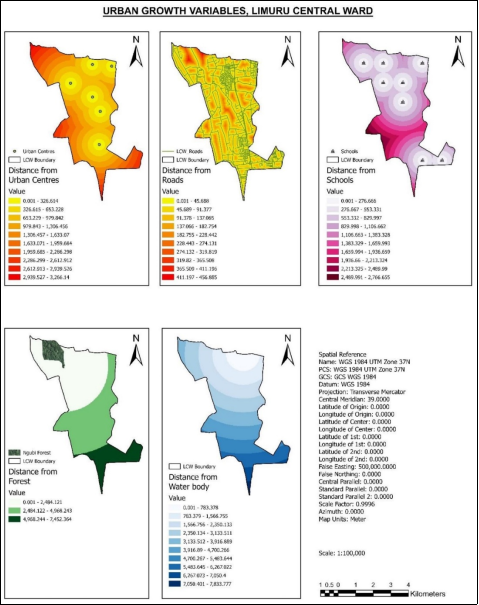
Figure 11. LCM Transition Variables, Urban Growth Variables.
3.2. Prediction and Simulation – Accuracy Rate of the Transition Sub Model
The transition variables in Figure 11 above, were used as inputs for the transition model, to compute the simulation and prediction maps.
The MLP Neural Network simulated the growth of the study area at an accuracy rate of 77.93%. The transition variables were interchangeably prioritized within the model, to give two alternate future scenarios of Limuru Central Ward, between 2020 and 2055 at intervals of three years. This epoch was applied to capture the validation map, to validate the current growth scenario (supervised classification) in the study area as compared to the prediction results of the LCM.
Land use changes from 2020 to 2055. Briefly, the rapidly changing land use are summarized as; Urban - (positive change), Vegetation (positive, negative and no change) and Bare Soil (negative, positive and negative changes). As seen in Figure 12 below, the nature of growth between 2020 and 2055 is characterized with the following;
1. Urban/Built up areas may have the greatest gains while vegetation has the least losses per area.
2. Urban/Built up areas has the greatest net change while bare soil has the least net changes.
3. Bare soil contributes to the greatest net change in the Urban/Built-up areas while vegetation contributes to the least net changes in the built-up area.
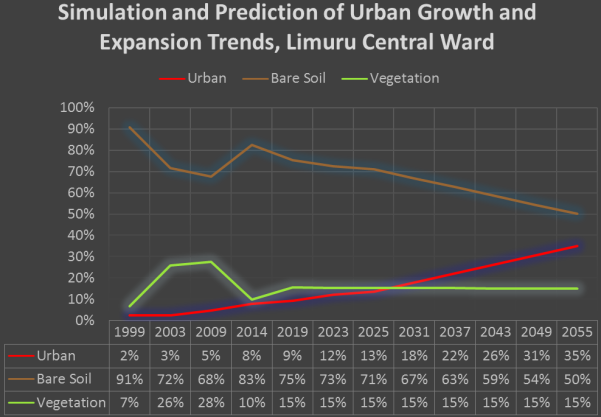
Figure 12. Simulation and Prediction of Urban Growth and Expansion Trends3.2.2. Model Validation.
Model Validation was done to show how the result of the predicted map compares to the classified LULC 2023 map. Figure 13 (a) shows the classified Landsat 8 image for the study area in 2023, while Figure 13 (b) shows the predicted LULC map generated by the LCM model, for the Limuru Central Ward in 2023.
The study maintained three main classes, to give more accurate results in the study area. The urban area is more pronounced in the predicted map because the map has captured roads as part of the urban development. Hence one can see the area under urban development represented as vertical and horizontal lines in the predicted map. The model maintained its accuracy and has shown that the prediction technique used was a suitable choice for simulation and prediction of the LULC changes, not only for our study area, but other study areas in future as well.
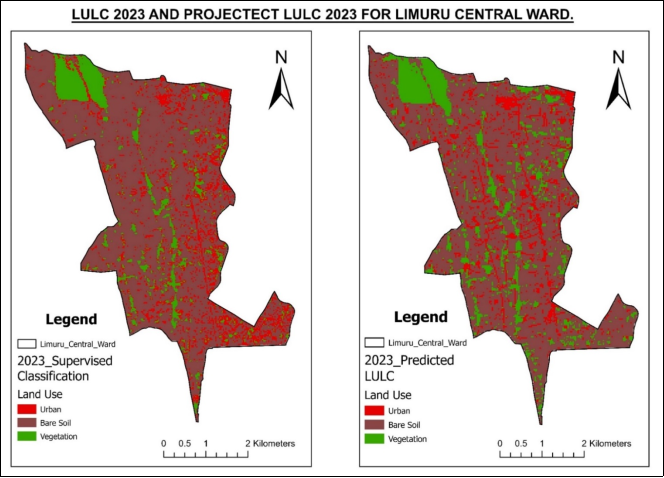
Figure 13. LULC 2023 and Projected LULC 2023 (Simulation 1) Limuru Central Ward3.2.3. Future Urbanization Trends of Limuru Central Ward (2020 – 2055).
In this study, it is important to note that both Simulation 1 (Figure 14) and Simulation 2 (Figure 15) have indicated similar percentages of Urban development throughout the prediction period, while showing different percentages of bare soil and vegetation. Future urbanization in the study area can be attributed to; Rapid land use change to accommodate more built-up spaces, sporadically growth of clustered development or dense built-up areas, need to expand infrastructure in newly developed areas and decrease in land occupied by bare soil and vegetation.
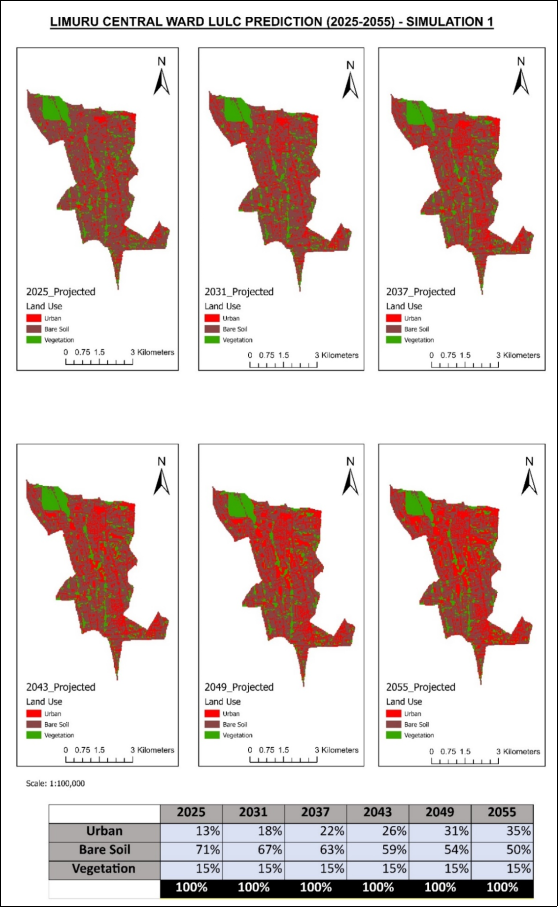
Figure 14. Limuru Central Ward LULC Prediction (2025 - 2055) Simulation 1.
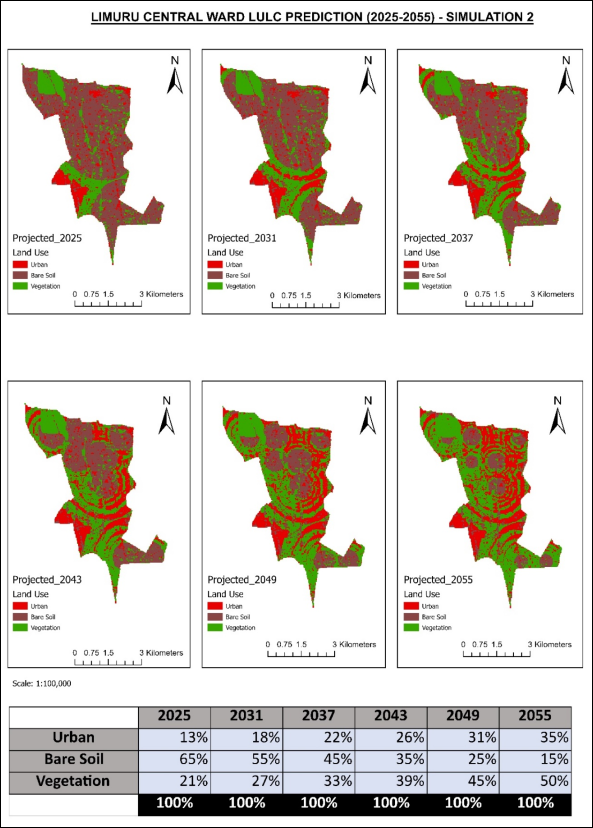
Figure 15. Limuru Central Ward LULC Prediction (2025 - 2055) Simulation 2 The more diverse a simulation is, the more flexible it is to change and grow to accommodate people’s future needs. In reference to this study, the preferred future scenario of the Limuru Central Ward is one that’ll be sustainable and one that’ll allow for seamless urban planning while encouraging interconnectivity of different clusters of development.
4. Discussion
The ecological models of the major cities in the world are represented spatially as the outcome of how different land uses interchangeably grow over time. Some of the known urban growth theories, which are spatially represented as urban growth models, include the; Concentric Zone Theory (coined by Ernst Burges in 1925), Sector Theory (coined by Homer Hoyt in 1939), Multi Nuclei Theory (coined by Chauncy Harris and Edward Ulman in 1945), Green Urbanism (coined by Steffen Lehmann in 1990), and Transport Oriented Development (TOD) (emerged in the late 1990’s) .
This section has summarized the discussion on the two simulated scenarios of the study area between 2020 and 2055. The conclusion is that Simulation 1, seen in Figure 16, shows more flexibility to accommodate several outcomes of urban development as compared to Simulation 2, seen in Figure 17.
Based on the discussions under chapter four, especially the maps generated, and facts collated and discussed, the preferred future scenario, Simulation 1, allows the future urban development of Limuru Central Ward;
1. To accommodate a multitude of people’s spatial needs,
2. To explore better urban planning and promote urban development along already established transport routes,
3. To promote sustainable urban development near densely vegetated areas such as Ngubi Forest to the North-Eastern side of the study area; and most importantly;
4. To gradually expand urban infrastructure in future urban hotspots along the urban periphery, without putting pressure on arable or bare land in Limuru Central Ward.
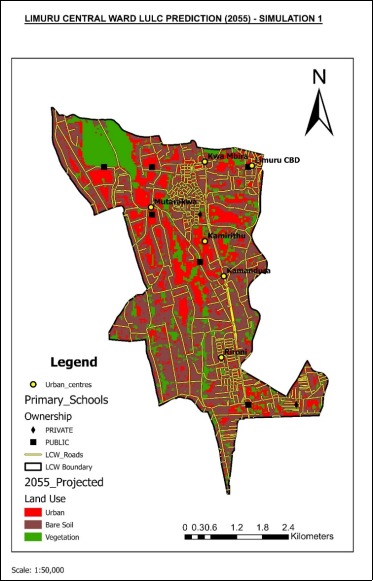
Figure 16. Limuru Central Ward LULC Prediction (2055) -Simulation 1.
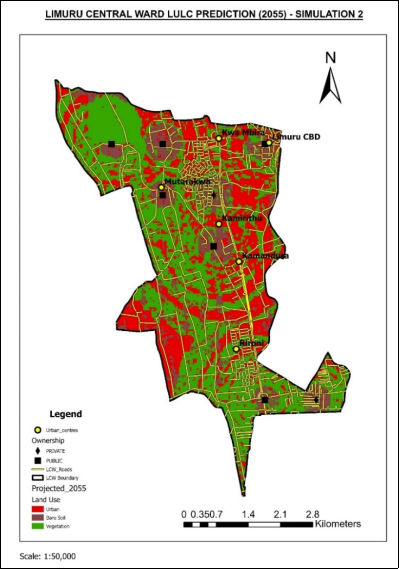
Figure 17. Limuru Central Ward LULC Prediction (2055) -Simulation 2.
5. Conclusions
From analyzing the trend analysis between 1999 and 2019 in the study area, it is evident that urbanization has encouraged widespread development of built-up areas further away from the main Limuru town center. With urban development restricted towards environmentally protected areas and farmlands, built up areas have emerged in the periphery, near existing built-up areas and along transport routes.
Predicted widespread urban development in the study area will encourage growth of urban areas within the region. It is for that reason that simulating the future urban trends was necessary to pinpoint the potential areas of growth and urban expansion. The urban or built-up area in Limuru Central Ward is seen steadily increasing from 2% in 1999, to 9% in 2019, to 31% in 2049 and finally to 35% in 2055. Unlike the built-up area, bare soil and vegetation have increased and decreased interchangeably. Eventually, bare soil has decreased from the initial 91% in 1999 to 50 % in 2055, while vegetation has increased from 7% in 1999 to 15% in 2055.
From the predicted maps it is observed that in future, the urban footprint is likely to increase near existing urban areas, along transport networks and near existing built-up areas such as schools. The urban footprint may likely adopt a mix of urban growth models – such us the multi nuclei and sector models, however, majority of the urban area may most likely be located within proximity to the transport network – transport-oriented development.
Abbreviations

CBD

Central Business District

SUSTRAIN

Sustainable Urban Transport Solutions for Addis Ababa

BRT

Bus Rapid Transit

NMR

Nairobi Metropolitan Region

GIS

Geographic Information System

UTM

Universal Transverse Mercator

ETM

Enhanced Thematic Mapper Plus

TM

Thematic Mapper

OLI

Operational Land Imager

LULC

Land Use Land Cover

LCM

Land Change Modeler

MLP

Multi-layer Perception

VTUP

Variable Transformation Utility Panel

DEM

Digital Elevation Map

TOD

Transport Oriented Development

Acknowledgments
I give all thanks to God, for the health and strength that has carried me throughout my academic journey. Paramount to my success, is the support I received from the JKUAT lecturers and technicians. But most especially, my supervisor Dr. Andrew Thiaine Imwati, who has overseen my work and made better of my ideas. Every comment Dr. Andrew Thiaine Imwati gave was a step closer to achieving commendable outputs. I would also like to thank Dr. Mark Boitt for giving me insightful ways on how to tackle my work. Third, I would like to acknowledge Gloria Chelele, Wencelaus Simiyu, Albert Kamau, my employers, Mr. Morris Waswa, Sarah Mideva, and Mr. Charles Muriuki for their support. Last but not least, I would like to thank my parents James Gichuki and Mercy Gichuki for their moral and financial support. May God bless you all.
Author Contributions
Ivy Njeri Gichuki: Conceptualization, Writing – original draft, Formal Analysis, Investigation, Methodology, Project administration, Resources and Visualization
Andrew Thiaine Imwati: Supervision, Conceptualization, Writing – review & editing, Resources
Data Availability Statement
The data supporting the outcome of this research work has been reported in this manuscript.
Conflict of Interest
The authors declare no conflicts of interest.
References
[1] Al-Darwish, Y., Ayad, H., Taha, D., & Saadallah, D. (2018). Predicting the future urban growth and it’s impacts on the surrounding environment using urban simulation models: Case study of Ibb city – Yemen. Alexandria Engineering Journal, 57(4), 2887–2895.
[2] Badiane, A., Yachan, A., Tebbal, F., Augustinus, C., Halfani, M., Kiwala, L., Moreno, E., Tuts, R., Gebede, G., & Mboup, G. (2014). Participatory Slum Upgrading Programme in the African, Caribbean and Pacific Countries.
[3] BAKER, B. H., MITCHELL, J. G., & WILLIAMS, L. A. J. (1988). Stratigraphy, geochronology and volcano-tectonic evolution of the Kedong–Naivasha–Kinangop region, Gregory Rift Valley, Kenya. Journal of the Geological Society, 145(1), 107–116.
[4] Clark Labs. (2018). IDRISI GIS Analysis.
[5] CREAF. (2016). GIS and remote sensing methodologies and applications | CREAF. http://www.creaf.cat/earth-observation/gis-and-remote-sensing-methodologies-and-applications
[6] Department of the Interior U. S. Geological Survey (USGS). (2018). Landsat Surface Temperatute (ST) Product Guide.
[7] Dinda, S., Das Chatterjee, N., & Ghosh, S. (2021). An integrated simulation approach to the assessment of urban growth pattern and loss in urban green space in Kolkata, India: A GIS-based analysis. Ecological Indicators, 121, 107178.
[8] FAO. (n.d.). Geographical information systems and remote sensing in inland fisheries and aquaculture. Retrieved 9 August 2021, from
[9] Growe, A. (2012). Emerging polycentric city-regions in Germany. Regionalisation of economic activities in metropolitan regions. Erdkunde, 66(4), 295–311.
[10] Güneralp, B., Lwasa, S., Masundire, H., Parnell, S., & Seto, K. C. (2018). Urbanization in Africa: Challenges and opportunities for conservation. Environmental Research Letters, 13(1), 015002.
[11] Hawkins, R., Ang, J., Crispi, G., Siegel, Y., Abdullahi, S., Ambwere, S., & Mcgill, R. (2018). Urban Planning for city leaders a handbook for Kenya Urban Planning for City Leaders: A Handbook for Kenya UN-Habitat Support to Sustainable Urban Development in Kenya. In ISBN.
[12] Independent Electoral and Boundaries Commission (IEBC). (2012). THE REVISED PRELIMINARY REPORT OF THE PROPOSED BOUNDARIES OF CONSTITUENCIES AND WARDS VOLUME 1.
[13] Interim Independent Boundaries Review Commission (IIBRC). (2010). The Report of the Interim Independent Boundaries Review Commission (IIBRC) Delimitation of Constituencies and Recommendations on Local Authority Electoral Units and Administrative Boundaries for Districts and Other Units.
[14] JICA. (2018). Republic of Kenya Nairobi City County Government REPUBLIC OF KENYA THE PROJECT ON DETAILED PLANNING OF INTEGRATED TRANSPORT SYSTEM AND LOOP LINE IN THE NAIROBI URBAN CORE FINAL REPORT.
[15] Landsat Missions (USGS). (n.d.). Landsat Known Issues | U.S. Geological Survey. Retrieved 4 December 2022, from
[16] Majeed, F. A., & Abaas, Z. R. (2023). Applications of ecological theory in the urban environment. AIP Conference Proceedings, 2651.
[17] Mundia, C. N., & Aniya, M. (2007). Modeling and predicting urban growth of Nairobi City using cellular automata with geographical information systems. Geographical Review of Japan, 80(12), 279–290.
[18] Nairobi Urban Study Group. (1973). Nairobi- Metropolitan Growth Strategy: Volume 1- Main Report.
[19] Nong, D. H., Lepczyk, C. A., Miura, T., & Fox, J. M. (2018). Quantifying urban growth patterns in Hanoi using landscape expansion modes and time series spatial metrics. PLoS ONE, 13(5).
[20] Repo1t, R., & Vitian, K. (1975). Appraisal of a Not for Public Use FILE COPY Document of the International Bank for Reconstruction and Development International Development Association.
[21] Saeidi, S., Mirkarimi, S. H., Mohammadzadeh, M., Salmanmahiny, A., & Arrowsmith, C. (2017). Designing an integrated urban growth prediction model: a scenario-based approach for preserving scenic landscapes. 33(12), 1381–1397.
[22] Saggerson, E. R. (1991). GEOLOGY OF THE NAIROBI AREA.
[23] Survey of Kenya. (n.d.). Kenya Counties Map. Retrieved 12 January 2023, from
[24] Tredinnick, K. (2014). Urban Growth Models of Urban Development.
[25] UN. (2018). World Urbanization Prospects The 2018 Revision.
[26] UN HABITAT. (2017). Country Programme for Ethiopia 2016-2020.
[27] Wang, R., Hou, H., Murayama, Y., & Derdouri, A. (2020). Spatiotemporal Analysis of Land Use/Cover Patterns and Their Relationship with Land Surface Temperature in Nanjing, China. Remote Sensing, 12(3), 440.
[28] Yen, B. T. H., Feng, C. M., & Lee, T. C. (2023). Transit-oriented development strategy in Taiwan: An application of land value capture. Asian Transport Studies, 9, 100094.
Cite This Article
  • APA Style

    Gichuki, I. N., Imwati, A. T. (2024). Use of Geo-Information Technologies in Predicting Urban Growth Trends; An Integrated Simulation Approach: The Case Study of Limuru Central Ward. Urban and Regional Planning, 9(4), 146-161. https://doi.org/10.11648/j.urp.20240904.13

    Copy | Download

    ACS Style

    Gichuki, I. N.; Imwati, A. T. Use of Geo-Information Technologies in Predicting Urban Growth Trends; An Integrated Simulation Approach: The Case Study of Limuru Central Ward. Urban Reg. Plan. 2024, 9(4), 146-161. doi: 10.11648/j.urp.20240904.13

    Copy | Download

    AMA Style

    Gichuki IN, Imwati AT. Use of Geo-Information Technologies in Predicting Urban Growth Trends; An Integrated Simulation Approach: The Case Study of Limuru Central Ward. Urban Reg Plan. 2024;9(4):146-161. doi: 10.11648/j.urp.20240904.13

    Copy | Download

  • @article{10.11648/j.urp.20240904.13,
      author = {Ivy Njeri Gichuki and Andrew Thiaine Imwati},
      title = {Use of Geo-Information Technologies in Predicting Urban Growth Trends; An Integrated Simulation Approach: The Case Study of Limuru Central Ward
    },
      journal = {Urban and Regional Planning},
      volume = {9},
      number = {4},
      pages = {146-161},
      doi = {10.11648/j.urp.20240904.13},
      url = {https://doi.org/10.11648/j.urp.20240904.13},
      eprint = {https://article.sciencepublishinggroup.com/pdf/10.11648.j.urp.20240904.13},
      abstract = {Urban areas exhibit different growth patterns spanning from linear development, transit-oriented development, concentric zonal development to multi-nuclei development patterns. In the world we live in today, main urban areas present themselves as Central Business Districts (CBDs), that double up as mixed use commercial and residential areas, which serve most of the population who live in and around them. Ideally, the CBD sites – for most cities around the world, were identified in advance, making it easier for the local authorities to demarcate and plan for sustainable development. Most, if not all jobs, are in these urban areas, making these employment areas urban growth hotspots. Changes in economic processes and evolution of transport networks are the foundation of urban growth and expansion, in that, there is a shift from functional specialization of the CBD to economic specialization of the surrounding urban areas, as in the case of Rhine Main Region in Germany. In Kenya, most of the known urban areas, like Limuru Town, emerged as traditional markets in the 1900’s and grew to modern urban areas and municipalities. Urban growth in Limuru was propelled by the existence of modern infrastructure, reduced land rates, presence of government facilities, security, water and employment from the nearby tea farms and factories. However, urban growth has been accompanied by rapid land use changes and sporicidal growth of informal settlements. As a result, urban areas growing in Limuru Central Ward, are deprived of basic infrastructure, public purpose facilities, land use harmonization and spatial synergies. This study therefore attempts to explore the use of GIS and Remote sensing technologies in observing past and present urban growth trends, that pave the way for predicting sustainable urban planning. The findings from this study are expected to contribute to the knowledge of simulating how urban centers can be planned in the present to cater for the future needs of the growing population. Predicting urban growth trends introduces more practical ways of spatial planning and policy development in developing countries, through spatial analysis and modelling using GIS and Remote Sensing technologies.
    },
     year = {2024}
    }
    

    Copy | Download

  • TY  - JOUR
    T1  - Use of Geo-Information Technologies in Predicting Urban Growth Trends; An Integrated Simulation Approach: The Case Study of Limuru Central Ward
    
    AU  - Ivy Njeri Gichuki
    AU  - Andrew Thiaine Imwati
    Y1  - 2024/12/13
    PY  - 2024
    N1  - https://doi.org/10.11648/j.urp.20240904.13
    DO  - 10.11648/j.urp.20240904.13
    T2  - Urban and Regional Planning
    JF  - Urban and Regional Planning
    JO  - Urban and Regional Planning
    SP  - 146
    EP  - 161
    PB  - Science Publishing Group
    SN  - 2575-1697
    UR  - https://doi.org/10.11648/j.urp.20240904.13
    AB  - Urban areas exhibit different growth patterns spanning from linear development, transit-oriented development, concentric zonal development to multi-nuclei development patterns. In the world we live in today, main urban areas present themselves as Central Business Districts (CBDs), that double up as mixed use commercial and residential areas, which serve most of the population who live in and around them. Ideally, the CBD sites – for most cities around the world, were identified in advance, making it easier for the local authorities to demarcate and plan for sustainable development. Most, if not all jobs, are in these urban areas, making these employment areas urban growth hotspots. Changes in economic processes and evolution of transport networks are the foundation of urban growth and expansion, in that, there is a shift from functional specialization of the CBD to economic specialization of the surrounding urban areas, as in the case of Rhine Main Region in Germany. In Kenya, most of the known urban areas, like Limuru Town, emerged as traditional markets in the 1900’s and grew to modern urban areas and municipalities. Urban growth in Limuru was propelled by the existence of modern infrastructure, reduced land rates, presence of government facilities, security, water and employment from the nearby tea farms and factories. However, urban growth has been accompanied by rapid land use changes and sporicidal growth of informal settlements. As a result, urban areas growing in Limuru Central Ward, are deprived of basic infrastructure, public purpose facilities, land use harmonization and spatial synergies. This study therefore attempts to explore the use of GIS and Remote sensing technologies in observing past and present urban growth trends, that pave the way for predicting sustainable urban planning. The findings from this study are expected to contribute to the knowledge of simulating how urban centers can be planned in the present to cater for the future needs of the growing population. Predicting urban growth trends introduces more practical ways of spatial planning and policy development in developing countries, through spatial analysis and modelling using GIS and Remote Sensing technologies.
    
    VL  - 9
    IS  - 4
    ER  - 

    Copy | Download

Author Information
  • Department, of Geomatic Engineering and Geospatial Information Systems, Jomo Kenyatta University of Agriculture and Technology, Kiambu, Kenya

    Biography: Ivy Njeri Gichuki is a Physical Planner and a Geographic Information System (GIS) Analyst. She holds a Bachelor of Arts in Urban and Regional Planning from the University of Nairobi and is currently pursuing an MSc in Geospatial Information Systems and Remote Sensing at the Jomo Kenyatta University of Agriculture and Technology (JKUAT). With a background in local, county, regional, and national physical planning and GIS analysis experience, Ivy has worked on a wide range of projects. Her expertise includes project management, data collection, urban and regional planning, community development, research, sectoral surveys, conducting public participation. workshops, and comprehensive GIS and Remote Sensing work.

    Research Fields: Urban and Regional Planning, Transport Development, Urban Growth, Geographic Information System, Remote Sensing, Public Participation.

  • Department, of Geomatic Engineering and Geospatial Information Systems, Jomo Kenyatta University of Agriculture and Technology, Kiambu, Kenya

    Biography: Andrew Thiaine Imwati is an MSc Geographic Information System and Remote sensing Lecturer at the Jomo Kenyatta University of Agriculture and Technology (JKUAT), Faculty of Engineering, Geomatic Engineering and Geospatial Information Systems (GEGIS) department, in Kenya. He is an expert in Geo-science and educational applications. He holds a Doctor of Philosophy Degree in Urban and Regional Planning, From the University of Nairobi.

    Research Fields: Survey, Urban and Regional Planning, Transport Development, Urban Growth, Geographic Information System.