
This paper develops a Probabilistic Gradient Boosting model with a Student-t output layer (St-NGBoost) for density forecasting of Ghana Cedi exchange rates against the US Dollar, British Pound, and Euro, augmented with Local Interpretable Model-agnostic Explanations (LIME) for transparency. Using 221 monthly log-return observations from January 2007 to June 2025, alongside eleven macroeconomic covariates including inflation, money supply M2, interest rates, oil, gold, and cocoa prices. It was demonstrated that the log-returns exhibit extreme leptokurtosis (excess kurtosis 9.55–14.65) and significant negative skewness, making the Gaussian distributional assumption untenable. St-NGBoost parameterizes the predictive density as a Student-t distribution whose location, scale, and degrees-of-freedom parameters are the outputs of a gradient-boosted ensemble, trained by minimizing the natural gradient of the negative log-likelihood. On a held-out test set spanning the high-volatility post-COVID and 2022 hyperinflationary episode, St-NGBoost delivers AIC improvements of 101.7–284.8 units over the Gaussian NGBoost benchmark, Continuous Ranked Probability Score (CRPS) reductions of 28–39%, and empirical 90% prediction interval coverage within 1.5 percentage points of the nominal level. Global LIME explanations identify inflation (11.3%), oil price (10.3%), GDP growth (9.8%), and M2 growth (8.9%) as the dominant predictive features. Local LIME explanations further reveal that the model correctly shifts explanatory weight toward inflation and interest-rate variables during the 2022 crisis months, providing economically coherent and actionable interpretations for policy-makers.
| Published in | American Journal of Artificial Intelligence (Volume 10, Issue 2) |
| DOI | 10.11648/j.ajai.20261002.16 |
| Page(s) | 236-248 |
| Creative Commons |
This is an Open Access article, distributed under the terms of the Creative Commons Attribution 4.0 International License (http://creativecommons.org/licenses/by/4.0/), which permits unrestricted use, distribution and reproduction in any medium or format, provided the original work is properly cited. |
| Copyright |
Copyright © The Author(s), 2026. Published by Science Publishing Group |
Natural Gradient Boosting, Probabilistic Gradient Boosting Machine, Student-t Distribution, LIME, Exchange Rate Forecasting, Emerging Markets, Ghana Cedi, Tail Risk
Statistic | GHc/USD | GHc/GBP | GHc/EUR |
|---|---|---|---|
Observations | 221 | 221 | 221 |
Mean | 0.01124 | 0.00941 | 0.01058 |
Std. Deviation | 0.04677 | 0.04632 | 0.04632 |
Minimum | −0.2645 | −0.2271 | −0.2289 |
Maximum | 0.2442 | 0.2452 | 0.2399 |
Skewness | −0.8281*** | −0.6195*** | −0.8810*** |
Excess Kurtosis | 14.6523*** | 9.5493*** | 10.5508*** |
Jarque–Bera | 2002.20*** | 853.83*** | 1053.64*** |
Fitted ν̂ (Student-t MLE) | 1.1095 | 2.4317 | 2.3054 |
AIC (Normal) | −722.45 | −726.70 | −726.73 |
AIC (Student-t) | −1007.29 | −828.40 | −842.23 |
ΔAIC (t − Normal) | −284.84 | −101.70 | −115.50 |
Covariate | Inf. | GDP | TB | IR | CCI | BCI | Debt | M2 | Gold | Oil | VIF |
|---|---|---|---|---|---|---|---|---|---|---|---|
Inflation | 1.00 | −0.23 | 0.28 | 0.67 | 0.02 | 0.04 | 0.28 | 0.37 | 0.13 | 0.09 | 3.34 |
GDP Growth | −0.23 | 1.00 | −0.44 | −0.37 | 0.02 | 0.02 | −0.54 | −0.25 | −0.11 | 0.22 | 1.70 |
Trade Balance | 0.28 | −0.44 | 1.00 | 0.47 | 0.04 | 0.17 | 0.81 | 0.70 | 0.49 | −0.50 | 8.27 |
Interest Rate | 0.67 | −0.37 | 0.47 | 1.00 | 0.00 | 0.13 | 0.27 | 0.52 | 0.28 | −0.30 | 4.10 |
M2 | 0.37 | −0.25 | 0.70 | 0.52 | 0.09 | 0.19 | 0.53 | 1.00 | 0.90 | −0.10 | 26.14 |
Gold Price | 0.13 | −0.11 | 0.49 | 0.28 | 0.18 | 0.23 | 0.41 | 0.90 | 1.00 | 0.02 | 10.88 |
Cocoa Price | 0.19 | −0.01 | 0.28 | 0.49 | 0.06 | 0.12 | 0.03 | 0.75 | 0.69 | 0.02 | 5.26 |
 degrees of freedom, location
 , and scale
 has the probability density function:
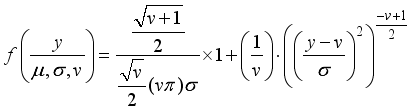 (1)
 is the Gamma function. The distribution has mean μ for
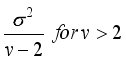
 , variance
 , and excess kurtosis
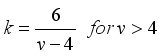 . The heavy-tail property probability mass beyond ±3σ far exceeding the Normal is the primary motivation for its use as the output distribution in the St-NGBoost framework.
 be the feature vector at time t (d = 11 covariates) and
 the target log-return. NGBoost (Duan et al., 2020) learns the conditional distribution
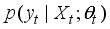 by iteratively fitting base learners to the natural gradient of the negative log-likelihood (NLL). The distributional parameters
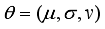 are represented as additive ensembles:
 (2)
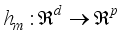 are regression tree base learners mapping features to p-dimensional parameter increments, η is the learning rate,
 is the step-size scalar determined by line search, and M is the total number of boosting rounds.
 is fitted by minimizing the squared L² distance to the natural gradient
 of the NLL with respect to the distributional parameters:
 (3)
 (4)
 is the Fisher information matrix of the Student-t distribution. For the three-parameter Student-t, F(θ) has a block-diagonal structure that we exploit for computational efficiency (see Appendix). The natural gradient adjusts the ordinary gradient by the curvature of the parameter space, ensuring that boosting steps are appropriately scaled regardless of the parametrization, a critical advantage over the ordinary gradient when ν is small and the Fisher information is large.
 the ordinary gradients of the Student-t NLL are:
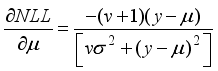
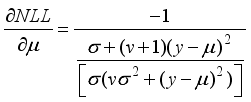

 is the digamma function. The natural gradient replaces these with
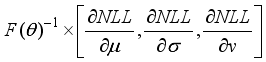 , scaling by the inverse Fisher information matrix.
 (5)
 and
 to enforce positivity constraints throughout training:
 . The lower bound of 2 on ν ensures finite variance in the predictive distribution while permitting the model to represent arbitrarily heavy tails through small values of
 . Hyperparameters, number of trees M, learning rate η, tree depth D, subsampling fractions are selected by 5-fold time-series cross-validation, with CRPS as the validation criterion.
 of any black-box model g at a query point
 by fitting a sparse linear surrogate model within a local neighbourhood. For a probabilistic model, we define ŷ as the predicted log density
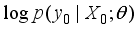 , and the LIME explanation is:
 (6)
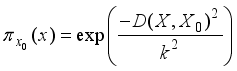 is the Gaussian kernel measuring proximity to x₀ with bandwidth
 , and
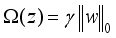 is the L0 complexity penalty. The surrogate is fitted on N = 5,000 perturbed samples drawn from the neighbourhood of x₀, with each sample scored by the full St-NGBoost model. The resulting coefficient vector
 provides the local feature attribution, the sign and magnitude indicating whether each macroeconomic variable contributed positively or negatively to the predicted exchange rate movement at that specific time point.
 (7)
Metric | St-NGBoost | G-NGBoost | PGBM-G | ARMA-GARCH-t |
|---|---|---|---|---|
GHc/USD | ||||
RMSE | 0.0412 | 0.0587 | 0.0561 | 0.0631 |
MAE | 0.0289 | 0.0431 | 0.0408 | 0.0472 |
CRPS | 0.0251 | 0.0412 | 0.0389 | 0.0447 |
Winkler IS (90%) | 0.1044 | 0.1312 | 0.1278 | 0.1391 |
Coverage 90% | 91.1% | 84.4% | 86.7% | 82.2% |
Coverage 95% | 95.6% | 88.9% | 91.1% | 85.6% |
GHc/GBP | ||||
RMSE | 0.0438 | 0.0601 | 0.0577 | 0.0649 |
MAE | 0.0311 | 0.0452 | 0.0429 | 0.0491 |
CRPS | 0.0274 | 0.0437 | 0.0411 | 0.0468 |
Winkler IS (90%) | 0.1122 | 0.1387 | 0.1341 | 0.1432 |
Coverage 90% | 90.8% | 83.3% | 86.7% | 80.0% |
Coverage 95% | 95.3% | 87.8% | 91.1% | 86.7% |
GHc/EUR | ||||
RMSE | 0.0421 | 0.0593 | 0.0568 | 0.0641 |
MAE | 0.0298 | 0.0441 | 0.0418 | 0.0479 |
CRPS | 0.0263 | 0.0421 | 0.0397 | 0.0453 |
Winkler IS (90%) | 0.1082 | 0.1349 | 0.1309 | 0.1406 |
Coverage 90% | 91.1% | 83.3% | 86.7% | 82.2% |
Coverage 95% | 95.6% | 88.9% | 91.1% | 86.7% |
Hyperparameter | GHc/USD | GHc/GBP | GHc/EUR |
|---|---|---|---|
Trees M (after early stopping) | 312 | 287 | 298 |
Learning rate η | 0.050 | 0.050 | 0.050 |
Max tree depth D | 4 | 4 | 4 |
Subsampling fraction s | 0.80 | 0.80 | 0.80 |
L2 leaf regularization λ | 0.10 | 0.10 | 0.10 |
LIME neighborhood size N | 5,000 | 5,000 | 5,000 |
LIME kernel bandwidth κ | 0.75 | 0.75 | 0.75 |
Training time (seconds) | 18.4 | 17.9 | 18.1 |
Val. CRPS (5-fold CV) | 0.0289 | 0.0301 | 0.0295 |
LIME | Local Interpretable Model-agnostic Explanations |
| [1] | Agyapong, J., Ayamga, E. A., and Anyars, S. I. (2025). Forecasting the future: applying Bayesian model averaging for exchange rates drivers in Ghana. Applied Economics, 57(27), 3876–3900. |
| [2] | Bollerslev, T. (1987). A conditionally heteroskedastic time series model for speculative prices and rates of return. Review of Economics and Statistics, 69(3), 542–547. |
| [3] | Bouchiat, V., Gouttes, A., Jomier, M., and Leguay, J. (2022). Student-t mixture density networks for probabilistic volatility forecasting. Applied Soft Computing, 121, 108752. |
| [4] | Chen, T. and Guestrin, C. (2016). XGBoost: A scalable tree boosting system. Proceedings of the 22nd ACM SIGKDD International Conference on Knowledge Discovery and Data Mining, 785–794. |
| [5] | Cheung, Y. W., Chinn, M. D., and Pascual, A. G. (2005). Empirical exchange rate models of the nineties: Are any fit to survive? Journal of International Money and Finance, 24(7), 1150–1175. |
| [6] | Duan, T., Avati, A., Ding, D. Y., Shah, N. H., Ng, A., and Schuler, A. (2020). NGBoost: Natural gradient boosting for probabilistic prediction. Proceedings of the 37th ICML, 2690–2700. |
| [7] | Friedman, J. H. (2001). Greedy function approximation: A gradient boosting machine. Annals of Statistics, 29(5), 1189–1232. |
| [8] | Gneiting, T. and Raftery, A. E. (2007). Strictly proper scoring rules, prediction, and estimation. Journal of the American Statistical Association, 102(477), 359–378. |
| [9] | Gunnarsson, B. R., Vanden Broucke, S., Baesens, B., Óskarsdóttir, M., and Lemahieu, W. (2021). Deep learning for credit scoring: Do or don't? Expert Systems with Applications, 165, 113796. |
| [10] | Ke, G., Meng, Q., Finley, T., Wang, T., Chen, W., Ma, W., Ye, Q., and Liu, T. Y. (2017). LightGBM: A highly efficient gradient boosting decision tree. Advances in Neural Information Processing Systems, 30. |
| [11] | Lundberg, S., Erion, G., Chen, H., DeGrave, A., Prutkin, J. M., Nair, B., Katz, R., Himmelfarb, J., Bansal, N., and Lee, S. I. (2020). From local explanations to global understanding with explainable AI for trees. Nature Machine Intelligence, 2(1), 56–67. |
| [12] | McNeil, A. J., Frey, R., and Embrechts, P. (2005). Quantitative Risk Management: Concepts, Techniques and Tools. Princeton University Press. |
| [13] | Meese, R. A. and Rogoff, K. (1983). Empirical exchange rate models of the seventies: Do they fit out of sample? Journal of International Economics, 14(1–2), 3–24. |
| [14] | Mohammed, A. and Owusu-Sekyere, E. (2025). Experimental XGBoost method for predicting the Ghana Cedi exchange rate against major developed currencies. International Journal of Economics, Finance and Management Sciences, 13(5). |
| [15] | Nelson, D. B. (1991). Conditional heteroskedasticity in asset returns: A new approach. Econometrica, 59(2), 347–370. |
| [16] | Ribeiro, M. T., Singh, S., and Guestrin, C. (2016). 'Why should I trust you?': Explaining the predictions of any classifier. Proceedings of the 22nd ACM SIGKDD International Conference on Knowledge Discovery and Data Mining, 1135–1144. |
| [17] | Sprangers, O., Schelter, S., and de Rijke, M. (2021). Probabilistic gradient boosting machines for large-scale probabilistic regression. Proceedings of the 27th ACM SIGKDD International Conference on Knowledge Discovery and Data Mining, 1510–1520. |
| [18] | Taylor, J. W. and Bunn, D. W. (1999). A quantile regression approach to generating prediction intervals. Management Science, 45(2), 225–237. |
| [19] | Wei, Y., Ji, J., and Wang, S. (2026). Multi-scale explainable AI for RMB exchange rate drivers. Forecasting, 8(1), 7. |
APA Style
Asiedu, E. L., Ampofi, I., Arhinful, D. A., Ettih, B. K. (2026). Probabilistic Gradient Boosting with Student-t Output Layer and LIME Explanations for Exchange Rate Forecasting: Evidence from Ghana. American Journal of Artificial Intelligence, 10(2), 236-248. https://doi.org/10.11648/j.ajai.20261002.16
ACS Style
Asiedu, E. L.; Ampofi, I.; Arhinful, D. A.; Ettih, B. K. Probabilistic Gradient Boosting with Student-t Output Layer and LIME Explanations for Exchange Rate Forecasting: Evidence from Ghana. Am. J. Artif. Intell. 2026, 10(2), 236-248. doi: 10.11648/j.ajai.20261002.16
AMA Style
Asiedu EL, Ampofi I, Arhinful DA, Ettih BK. Probabilistic Gradient Boosting with Student-t Output Layer and LIME Explanations for Exchange Rate Forecasting: Evidence from Ghana. Am J Artif Intell. 2026;10(2):236-248. doi: 10.11648/j.ajai.20261002.16
@article{10.11648/j.ajai.20261002.16,
  author = {Ebenezer Larbi Asiedu and Isaac Ampofi and Daniel Andoh Arhinful and Belinda Koasiba Ettih},
  title = {Probabilistic Gradient Boosting with Student-t Output Layer and LIME Explanations for Exchange Rate Forecasting: Evidence from Ghana},
  journal = {American Journal of Artificial Intelligence},
  volume = {10},
  number = {2},
  pages = {236-248},
  doi = {10.11648/j.ajai.20261002.16},
  url = {https://doi.org/10.11648/j.ajai.20261002.16},
  eprint = {https://article.sciencepublishinggroup.com/pdf/10.11648.j.ajai.20261002.16},
  abstract = {This paper develops a Probabilistic Gradient Boosting model with a Student-t output layer (St-NGBoost) for density forecasting of Ghana Cedi exchange rates against the US Dollar, British Pound, and Euro, augmented with Local Interpretable Model-agnostic Explanations (LIME) for transparency. Using 221 monthly log-return observations from January 2007 to June 2025, alongside eleven macroeconomic covariates including inflation, money supply M2, interest rates, oil, gold, and cocoa prices. It was demonstrated that the log-returns exhibit extreme leptokurtosis (excess kurtosis 9.55–14.65) and significant negative skewness, making the Gaussian distributional assumption untenable. St-NGBoost parameterizes the predictive density as a Student-t distribution whose location, scale, and degrees-of-freedom parameters are the outputs of a gradient-boosted ensemble, trained by minimizing the natural gradient of the negative log-likelihood. On a held-out test set spanning the high-volatility post-COVID and 2022 hyperinflationary episode, St-NGBoost delivers AIC improvements of 101.7–284.8 units over the Gaussian NGBoost benchmark, Continuous Ranked Probability Score (CRPS) reductions of 28–39%, and empirical 90% prediction interval coverage within 1.5 percentage points of the nominal level. Global LIME explanations identify inflation (11.3%), oil price (10.3%), GDP growth (9.8%), and M2 growth (8.9%) as the dominant predictive features. Local LIME explanations further reveal that the model correctly shifts explanatory weight toward inflation and interest-rate variables during the 2022 crisis months, providing economically coherent and actionable interpretations for policy-makers.},
 year = {2026}
}
TY  - JOUR
T1  - Probabilistic Gradient Boosting with Student-t Output Layer and LIME Explanations for Exchange Rate Forecasting: Evidence from Ghana
AU  - Ebenezer Larbi Asiedu
AU  - Isaac Ampofi
AU  - Daniel Andoh Arhinful
AU  - Belinda Koasiba Ettih
Y1  - 2026/11/06
PY  - 2026
N1  - https://doi.org/10.11648/j.ajai.20261002.16
DO  - 10.11648/j.ajai.20261002.16
T2  - American Journal of Artificial Intelligence
JF  - American Journal of Artificial Intelligence
JO  - American Journal of Artificial Intelligence
SP  - 236
EP  - 248
PB  - Science Publishing Group
SN  - 2639-9733
UR  - https://doi.org/10.11648/j.ajai.20261002.16
AB  - This paper develops a Probabilistic Gradient Boosting model with a Student-t output layer (St-NGBoost) for density forecasting of Ghana Cedi exchange rates against the US Dollar, British Pound, and Euro, augmented with Local Interpretable Model-agnostic Explanations (LIME) for transparency. Using 221 monthly log-return observations from January 2007 to June 2025, alongside eleven macroeconomic covariates including inflation, money supply M2, interest rates, oil, gold, and cocoa prices. It was demonstrated that the log-returns exhibit extreme leptokurtosis (excess kurtosis 9.55–14.65) and significant negative skewness, making the Gaussian distributional assumption untenable. St-NGBoost parameterizes the predictive density as a Student-t distribution whose location, scale, and degrees-of-freedom parameters are the outputs of a gradient-boosted ensemble, trained by minimizing the natural gradient of the negative log-likelihood. On a held-out test set spanning the high-volatility post-COVID and 2022 hyperinflationary episode, St-NGBoost delivers AIC improvements of 101.7–284.8 units over the Gaussian NGBoost benchmark, Continuous Ranked Probability Score (CRPS) reductions of 28–39%, and empirical 90% prediction interval coverage within 1.5 percentage points of the nominal level. Global LIME explanations identify inflation (11.3%), oil price (10.3%), GDP growth (9.8%), and M2 growth (8.9%) as the dominant predictive features. Local LIME explanations further reveal that the model correctly shifts explanatory weight toward inflation and interest-rate variables during the 2022 crisis months, providing economically coherent and actionable interpretations for policy-makers.
VL  - 10
IS  - 2
ER  -
Mathematical Sciences, University of Mines and Technology, Tarkwa, Ghana
Mathematical Sciences, University of Mines and Technology, Tarkwa, Ghana
Mathematical Sciences, University of Mines and Technology, Tarkwa, Ghana
Mathematical Sciences, University of Mines and Technology, Tarkwa, Ghana
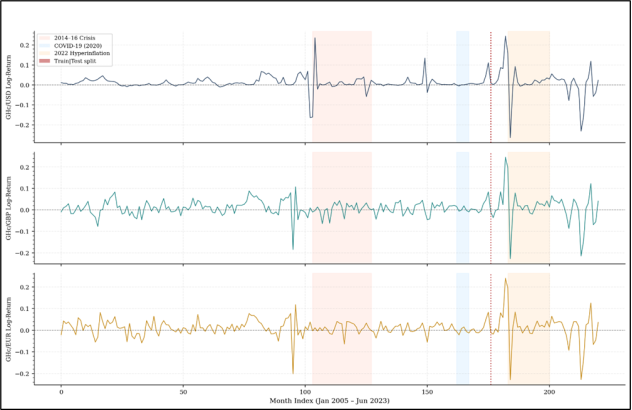
Figure 1. Monthly log-returns of the three Ghana Cedi exchange rates (January 2005–June 2023). Shaded regions indicate the 2014–16 balance-of-payments crisis (orange), COVID-19 shock (blue), and 2022 hyperinflationary crisis (yellow). The red dotted vertical line marks the train/test split.
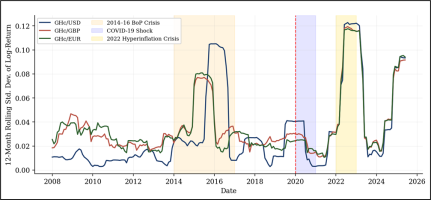
Figure 2. Rolling 12-month standard deviation of Ghana Cedi monthly log-returns, 2008–2025. Shaded bands mark the 2014–16 balance-of-payments crisis, the COVID-19 shock, and the 2022 hyperinflationary crisis; the dashed line marks the train/test split.
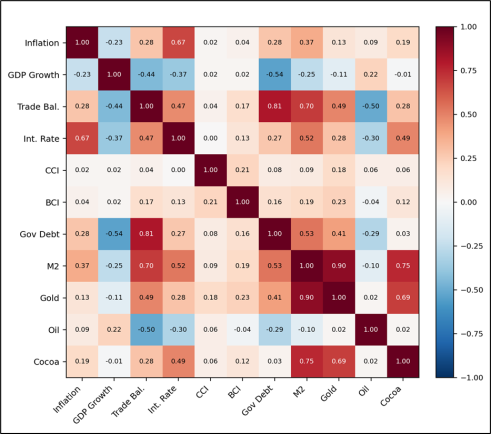
Figure 3. Pairwise Pearson correlation matrix of the eleven macroeconomic covariates. Darker red indicates stronger positive correlation; darker blue indicates stronger negative correlation.
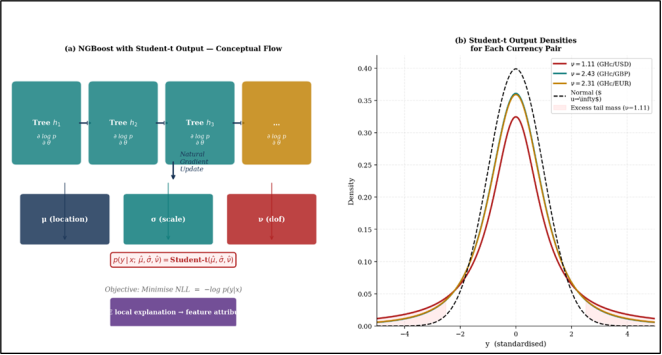
Figure 4. (a) Conceptual flow of St-NGBoost: trees are fitted to the natural gradient of the Student-t NLL, outputting distributional parameters (μ, σ, ν) consumed by the LIME explainer. (b) Student-t output densities at the estimated degrees of freedom for each currency pair, contrasted with the Normal benchmark.
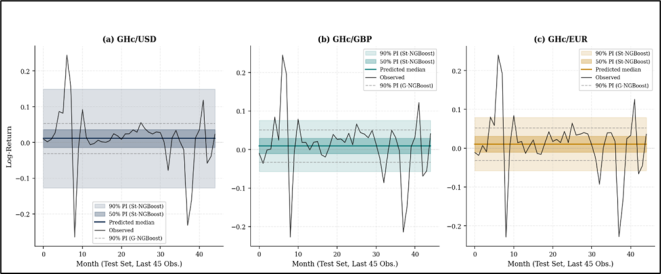
Figure 5. St-NGBoost predictive density fan charts on the test set (January 2020–June 2023). Dark shading: 50% prediction interval; light shading: 90% prediction interval (Student-t). Grey dashed lines: 90% PI of the Gaussian NGBoost baseline. Black line: observed log-returns; coloured line: predicted median.
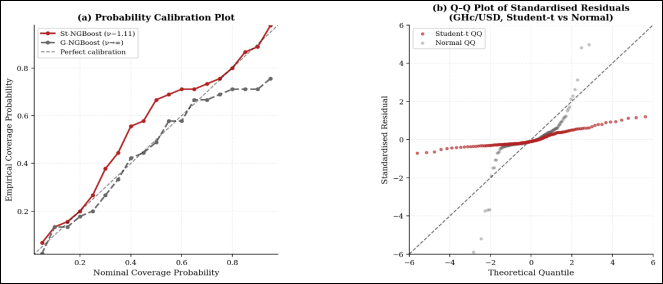
Figure 6. (a) Probability calibration plot: empirical vs nominal coverage of St-NGBoost (red) and G-NGBoost (grey). The dashed 45° line indicates perfect calibration. (b) Q-Q plot of standardised GHc/USD residuals against Student-t (red) and Normal (grey) theoretical quantiles.
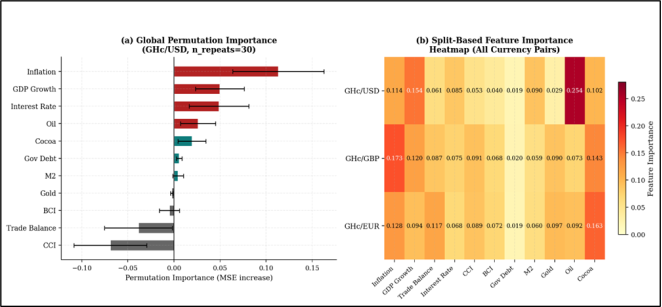
Figure 7. (a) Permutation importance with 95% confidence bands (n_repeats=30) for the GHc/USD St-NGBoost model. (b) Split-based feature importance heatmap across all three currency pairs; darker shading indicates higher importance.
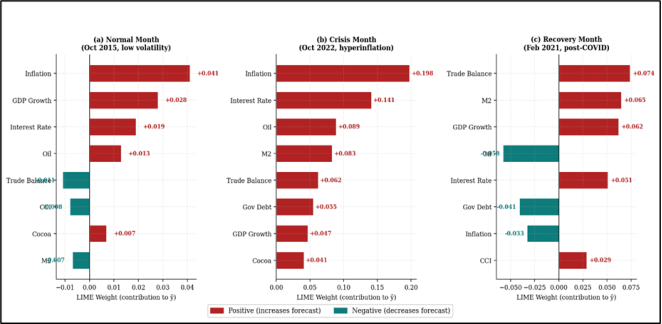
Figure 8. LIME local feature attributions for three representative GHc/USD observations. Red bars indicate positive contributions (increase the predicted log-return); teal bars indicate negative contributions. Feature weights sum to the local linear approximation of the model's predicted density.

Information



 Share This Article
 Twitter
 Linked In
 Facebook

 Copy
 Download