Research Article | | Peer-Reviewed

Species-Dependent Variations in the Physicochemical Properties of Bio-chips: Implications for Quality Control and Processing Optimization of Cassava

Received: 15 September 2025     Accepted: 30 September 2025     Published: 14 October 2025
Views:       Downloads:
Abstract

The systematic analysis of edible biochips provides accurate and reproducible data that supports quality assurance, safety assessment, and optimization; for utilization in food and industrial processing applications. Despite their wide deployment, limited studies have comprehensively compared the physicochemical properties of different cassava varieties using standardized analytical methods. This study focuses on the investigation of the species-dependent variations in the physicochemical properties of cassava chips. Game-Changer, Obasanjo-II, Poundable, Hope, and Baba-70 denoted as samples A, B, C, D and E respectively were oven-and-sun dried under controlled conditions. Moisture, cyanide, and physicochemical properties were modeled using Response Surface Methodology (RSM), Principal Component Analysis (PCA), Radar plots and Analysis of Variance (ANOVA) for optimization. The investigation covered percentage composition of fresh and dried samples, vitamins-minerals contents, principal components, correlations matrix, nutrients radar, hydrogen cyanide (HCN) content, moisture content and fundamental chemical attributes affecting the structural integrity of the chips. Sample D exhibited the highest initial moisture content while Sample E recorded the lowest, indicating a species-dependent variation in moisture retention. Minimal cyanide content within acceptable range was achieved, which demonstrates effective detoxification under controlled conditions. Species and temperature exerted a stronger influence than time; and observation identified specie as the most critical factor. PCA revealed complex nutrient trade-offs among minerals and vitamins, while RSM indicated that balanced control of drying time and temperature, rather than extreme settings, ensures optimal moisture reduction and processing efficiency. These findings underscore the hypercritical role of species selection in post-harvest cassava processing and provide baseline data for predicting drying behavior, ensuring product safety, and optimizing processing parameters for food and industrial applications.

Published in American Journal of Applied Scientific Research (Volume 11, Issue 4)
DOI 10.11648/j.ajasr.20251104.11
Page(s) 176-192
Creative Commons

This is an Open Access article, distributed under the terms of the Creative Commons Attribution 4.0 International License (http://creativecommons.org/licenses/by/4.0/), which permits unrestricted use, distribution and reproduction in any medium or format, provided the original work is properly cited.

Copyright

Copyright © The Author(s), 2025. Published by Science Publishing Group

Keywords

Cassava Chips, Physicochemical Characterization, Cassava Varieties, Moisture and Hydrogen Cyanide Contents, Post-Harvest Processing

1. Introduction
Manihot esculenta Crantz (cassava) is a major staple food, particularly in tropical regions, where it contributes to food security and agricultural gross domestic product . Valued for its carbohydrate-rich roots, cassava supports over 800 million people globally and provides raw materials for flour, starch, ethanol, and animal feed. However, its high moisture content and cyanogenic glucosides, mainly linamarin and lotaustralin, render it highly perishable and potentially toxic, necessitating effective postharvest processing . Drying of cassava remains a preferred preservation method for extending its shelf life and reducing cyanide levels .
Cassava exhibits high variability across cultivars, with significant differences in morphology, yield potential, and cyanide content . The studies of Spittstoesser and Tunya; which corroborated Huaman and Spooner noted that while improved varieties such as samples A, B, C, D and E have been developed for higher yield and resistance, little is known about their physicochemical properties which obviously determine processing suitability . Factors such as moisture dynamics, starch composition, and cyanide reduction during drying are critical but underexplored in these cultivars .
Existing studies have highlighted cassava’s ecological adaptability, nutritional profile, and cyanide detoxification pathways . Yet, a clear information void persists in linking varietal physicochemical profiles with optimal drying strategies for safe, high-quality cassava chips. This study addresses that gap by characterizing key properties such as moisture content, cyanide levels, and related quality indicators across five improved cassava varieties using standardized Association of Analytical Chemists (AOAC) methods. The novelty lies in providing comparative data to guide variety-specific processing protocols to ensure product safety, nutritional retention, and shelf life stability.
2. Materials and Methods
Raw Materials: Five cassava (Manihot esculenta Crantz) varieties A, B, C, D and E were used for this study. All roots were sourced fresh, certified good after being inspected for defects, and processed within twenty hours of harvest.
Samples Preparation: Roots were washed thoroughly, peeled, and sliced into uniform chips of 5 × 3 × 1 cm using a stainless-steel slicer. For each variety, chips were divided into three independent batches of biological replicates (R). Each batch provided subsamples for oven and sun drying and for fresh R-samples analyses. After slicing, a representative portion of fresh chips from each batch was retained and analyzed for baseline physicochemical properties including cyanide content.
Drying Procedures
i. Oven Drying: An electric laboratory dry oven (DHG-9101-1SA) was used. For each variety and replication, chips were spread in a single layer on perforated trays and dried at target temperatures within the range 70–110°C. Tray positions were rotated periodically to reduce positional bias. Samples were removed and weighed at intervals of 30 minutes until no further weight loss was observed; which implies that constant weight has been achieved. Final dried samples were cooled in a desiccator and stored in airtight containers prior to analysis.
ii. Sun Drying: Sun drying was performed on clean concrete slabs exposed to direct sunlight daily between 10:00 am and 5:00 pm for five consecutive days. Chips were arranged in a single layer and turned every two hours to promote even drying. Ambient temperature, relative humidity and wind speed were recorded using portable instruments at 10:00 am, 1:00 am and 4:00 pm each drying day. Weight measurements of representative subsamples were taken at 2-hour intervals during drying hours and once each evening to monitor moisture loss. Dried samples were stored as in drying procedure (i).
Moisture Content and Drying Rates: Moisture content (%) was determined by the gravimetric weight-loss method in which initial and time-point masses were recorded using an analytical balance and moisture content at each time point was calculated relative to initial fresh mass. Drying rate (the grams of water lost per gram of dry matter per hour) was calculated from successive weight measurements as the change in moisture content divided by the elapsed time between measurements. Equilibrium and final moisture content was taken as the constant weight was attained for three consecutive measurements.
Cyanide Determination: Total cyanide in fresh and dried chip samples was quantified using a modified alkaline picrate procedure. For each sample, a representative subsample was homogenized and extracted under alkaline conditions according to the modified protocol. Extracts were reacted with picrate reagent under controlled temperature and time; color development was measured spectrophotometrically against reagent blanks and a calibration curve prepared from cyanide standards. All cyanide determinations were performed in triplicate and results expressed as mg HCN per kg sample (dry weight basis for dried samples).
Physiochemical Analysis: Physicochemical parameters such as ash, crude fiber, crude fat, crude protein and carbohydrate by difference were determined on dried material using standard laboratory methods. All analyses were performed at least in duplicate. Glassware and instruments were calibrated prior to use; reagent blanks and quality control standards were run with each batch of samples to ensure analytical accuracy and precision.
Analytical Methods
Statistical analysis was performed using Design-Expert (v.13) and XLSTAT. Response Surface Methodology (RSM) was applied to fit a quadratic model for optimizing drying parameters as expressed in Equation (1) thus:
= β0+ β1X1+ β2X2+ β11X12+ β22X22+ β12X1X2+ ε(1)
where Y is the response variable of moisture content, cyanide concentration, X1 and X2 are independent process factors of temperature and time, β terms are regression coefficients, and ε is the random error term.
Principal Component Analysis (PCA) was employed to identify the main contributing physicochemical factors among cassava varieties. Radar charts were generated to visually compare species-dependent variations in moisture content, cyanide levels, and quality attributes. ANOVA was conducted to determine the significance of model terms and treatment effects.
3. Results and Discussions
3.1. Samples Characterization Data
The data obtained from laboratory characterizations of five different varieties of the Samples (A-E) used in this study are as displayed in Table 1 while figure 1 displays the standard analytical characterization of fresh and dried cassava chips.
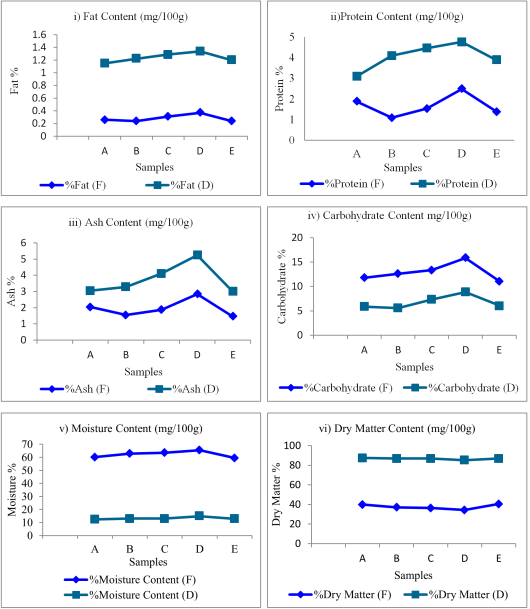
Figure 1. Plots of Standard Analytical Characterization of Cassava Chips (Fresh and Dried).
Table 1. Proximate Composition of the Fresh & Dried Samples in Percentage.

Sample

%Protein (F)

%Protein (D)

%Fat (F)

%Fat (D)

%Crude Fiber (F)

%Crude Fiber (D)

%Ash (F)

%Ash (D)

%Carbohydrate (F)

%Carbohydrate (D)

%Moisture Content (F)

%Moisture Content (D)

%Dry Matter (F)

%Dry Matter (D)

A

1.87

3.10

0.26

1.15

3.96

7.99

2.05

3.05

11.80

5.87

60.14

12.45

39.86

87.55

B

1.09

4.09

0.24

1.22

3.15

9.46

1.56

3.29

12.59

5.59

62.85

12.98

37.15

87.02

C

1.54

4.46

0.31

1.29

4.26

11.26

1.87

4.12

13.35

7.35

63.54

13.14

36.46

86.86

D

2.48

4.76

0.37

1.34

5.24

12.24

2.85

5.24

15.84

8.86

65.53

14.83

34.47

85.17

E

1.38

3.88

0.24

1.20

3.67

9.15

1.45

2.99

11.08

6.08

59.58

12.95

40.42

87.05

3.2. Proximate Composition of Fresh vs. Dried Samples
The graphical characterization in figure 1 presents a standard analytical comparison of key physicochemical properties between fresh and dried cassava chip samples across varieties A–E as displayed on figure 1. Percentage composition and characterization of fresh and dried chips of samples A – E are further shown on figure 2.
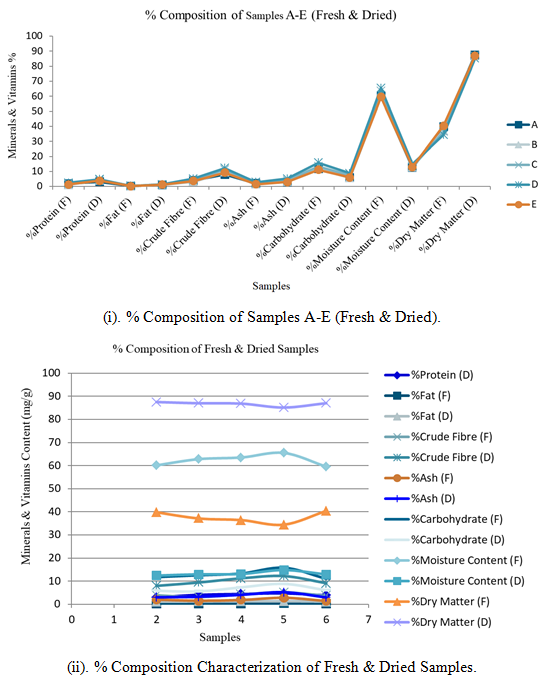
Figure 2. Combined Composition Characterization of Samples A-E.
3.2.1. Dry Matter and Moisture Content
Fresh samples were observed to possess high moisture content in the range of 59.58% to 65.53% which is typical of raw cassava roots and the drying process reduced moisture content to 12.45–14.83%; thus, significantly increasing dry matter from approximately 35–40% to between 85–87%. The reduction of moisture improves shelf life and storage, which are very relevant requirements in cassava processing .
3.2.2. Protein, Fat, Crude Fiber, Ash, and Carbohydrate
From table 1 and figure 2, all components increased after drying, due to concentration effects from moisture loss. The protein increased from between 1.09 – 2.48% to 3.10 – 4.76%.; Crude fiber increased remarkably in Sample D from 5.24% to 12.24%) and Ash content nearly doubled or more, showing mineral concentration. These imply that drying enhances the nutritional density of cassava chips, especially the protein and fiber content. The observation aligns with processing goals for improved food and feed use.
Table 2. Fresh Samples.

Nutrient (mg/g)

Sample A

Sample B

Sample C

Sample D

Sample E

Calcium (Ca)

13.04

15.02

17.05

9.06

12.09

Magnesium (Mg)

15.3

10.8

14.45

9.85

9.79

Potassium (K)

125

86

80

81

83

Sodium (Na)

13.776

13.49

11.88

9.87

9.45

Phosphorus (P)

28

42

17

22.6

56.5

Vitamin A (Vit. A)

1.75

1.69

1.28

1.09

1.05

Vitamin C (Vit. C)

30.89

35.25

25.45

42.97

31.78

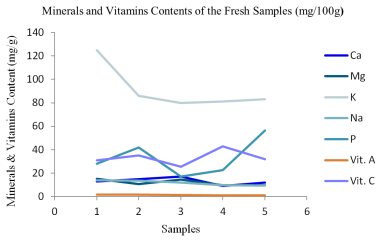
Figure 3. Minerals and Vitamins Contents of the Fresh Samples (mg/100g).
Table 3. Dried Samples.

Nutrient (mg/g)

Sample A

Sample B

Sample C

Sample D

Sample E

Ca

39.04

37.02

35.05

27.06

18.04

Mg

26.33

29.89

30.37

15.85

14.68

K

196

174

191

86

198

Na

14.75

14.47

13.85

14.8

11.22

P

129

139

89.15

213.6

144.5

Vit. A

7.78

7.75

5.29

7.09

5.05

Vit. C

50.89

41.25

30.38

52.95

51.78

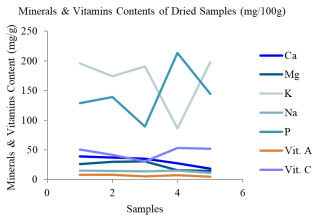
Figure 4. Minerals & Vitamins Contents of Dried Samples (mg/100g).
3.2.3. Mineral and Vitamin Compositions (Displayed on Tables 2 and 3)
i. Mineral Composition of Ca, Mg, K, Na and P: Based on Tables 2 and 3, the drying process concentrated mineral content in all varieties of cassava chips. Ca, Mg, and P increase significantly after drying, alluding that drying practice condenses chemical properties in biochips. To illustrate this, it can be seen from Figures 3 and 4 that, Ca in Sample A on the first day increased from 13.04 mg/g to 39.04 mg/g, P in Sample D on the fourth day increased from 22.60 mg/g to 213.60 mg/g which is nearly 10x increase and Potassium (K), which is essential for electrolyte balance, remained high across all samples, especially in dried forms as can be clearly observed in Sample E = 198 mg/g. These findings support the work of Mohidin et.al., that the health relevance of Cassava chips further buttresses the staple food as a good source of dietary minerals, especially when dried . Ca, Mg, P and K vitamins may support bone health and cardiovascular functions.
ii. Vit. A and Vit. C Contents: Vit. A increased significantly in dried samples. In table 3, Samples reflect an upward surge of Vit. A from 1.75 mg/g to 7.78 mg/g. Vit. C also increased, contrary to expectations, possibly due to reduced water activity and/or less oxidative degradation under specific drying conditions. Popova reported that vit. C is usually heat-sensitive . The increase here might indicate minimal degradation or efficient drying protocols such as low temperature drying. It can be deduced here that the relevance of the drying process optimization has improved levels of vitamins A and C which suggests that cassava chips, when processed correctly, may contribute to addressing micronutrient deficiencies.
3.3. Principal Components Analysis (PCA): Mineral & Vitamin Comparison
The plots on figures 5-11 are the visual analytical charts for vitamin and mineral content in cassava samples (fresh and dried), including PCA and radar plots. The line charts on figures 3 and 4 compares individual nutrient concentrations across samples. Vitamin A and C are well retained and improved in dried samples, suggesting that mild drying conditions preserved or even enhanced vitamin content. Sample D stands out with the highest dried Vit. C volume of 52.95 mg/100g) and Phosphorus volume of 213.6 mg/100g, making it nutritionally dense. This insight holds verifiable knowledge that controlled drying of cassava chips enhances nutritional value by reducing moisture while retaining or increasing key vitamins and minerals.
3.4. Principal Component Analysis of Fresh Samples of Mineral and Vitamins Contents in (mg/100g)
The PCA plots (scree, score, loading and biplot) of dataset on table 2 are displayed on figure 5.
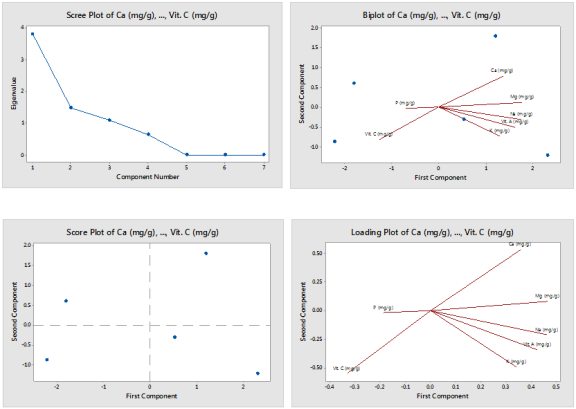
Figure 5. Mineral and Vitamins Contents of the Fresh Samples in (mg/100g).
Table 4. Eigenanalysis of the Correlation Matrix of Fresh Samples.

Component

Eigenvalue

Proportion

Cumulative

PC1

3.8028

0.543 (54.3%)

0.543 (54.3%)

PC2

1.4754

0.211 (21.1%)

0.754 (75.4%)

PC3

1.0845

0.155 (15.5%)

0.909 (90.9%)

PC4

0.6373

0.091 (9.1%)

1.000 (100%)

PC5

0.0000

0.000 (0.0%)

1.000 (100%)

PC6

0.000

0.000 (0.0%)

1.000 (100%)

PC7

-0.0000

-0.000 (-0.0%)

1.000 (100%)

3.4.1. Eigenanalysis of the Correlation Matrix (Variance) of Fresh Samples
Tables 4 and 5 display how much of the total variability in the dataset of the fresh sample of cassava chips is captured by each principal component (PC). The variance is explained thus:
a) Significant Components: The first three principal components (PC1, PC2, and PC3) collectively explain a very high proportion of the total variance: 54.3%+21.1%+15.5% = 90.9%. This indicates that the vast majority of the variability in the mineral and vitamin content of fresh cassava chips can be effectively summarized by these three components.
b) Dominance of PC1: PC1 alone accounts for over half of the total variance (54.3%), making it the most important dimension of variation in the fresh cassava chip data.
c) Reduced Dimensionality: Given that over 90% of the variance is captured by the first three components, the original 7 variables can be effectively represented in a 3-dimensional space for analysis without significant loss of information.
d) Minor Components: PC4 explains a small but notable 9.1% of the variance, bringing the cumulative total to 100%. Components PC5, PC6, and PC7 have eigenvalues of approximately zero, meaning they explain virtually no additional variance and can be disregarded for practical interpretation.
Table 5. Eigenvectors for Fresh Samples.

Nutrients (Variables)

PC1

PC2

PC3

PC4

PC5

PC6

PC7

Ca (mg/g)

0.356

0.531

0.184

0.320

-0.529

-0.387

-0.160

Mg (mg/g)

0.465

0.081

-0.303

-0.326

-0.408

0.628

0.133

K (mg/g)

0.341

-0.493

0.044

-0.555

-0.164

-0.546

-0.074

Na (mg/g)

0.463

-0.213

0.145

0.388

0.210

-0.062

0.722

P (mg/g)

-0.186

-0.021

0.875

-0.239

0.223

0.261

0.153

Vit. A (mg/g)

0.426

-0.345

0.249

0.327

0.208

0.288

0.636

Vit. C (mg/g)

-0.332

-0.551

-0.151

0.412

-0.624

0.042

0.045

3.4.2. Eigenvectors (Loadings)
The eigenvectors (loadings) indicate how each original variable contributes to the formation of each principal component; in that, a larger absolute value indicates a stronger contribution while positive values indicate a direct relationship and negative values indicate an inverse relationship.
a) Principal component 1 (PC1): In this analysis, the percentage variability is 54.3% with Mg, Na, Vitamin A, Ca and K having strong positive loadings of 0.654, 0.463, 0.426, 0.356 and 0.341 respectively. Vitamin C has a strong negative loading of -0.332. As reflected on table 4, PC1 analysis presents a general "mineral and Vit. A richness" characteristics factor of the cassava chips. The samples with high levels of Mg, Na, Vit. A, Ca and K exhibit a high score on PC1. Conversely, samples with high Vit. C tend to have a lower PC1 score. This characterization component suggests that most minerals and Vit. A tend to co-vary positively, while Vit. C shows an inverse relationship with this group; reflecting a fundamental nutritional profile or differences between varieties.
b) Principal Component 2 (PC2): The outcome of this analysis presents a 21.1% of variance. Ca exhibits a strong positive loading of 0.531 while Vit. C, K and Vit. A possess strong negative loading of -0.551, -0.493 and -0.345 respectively. PC2 sharply differentiates samples based on Ca content versus Vit. C, K, and Vit. A. A high score on PC2 would indicate high Ca levels but low levels of Vit. C, K, and Vit. A. This component highlights variations in mineral absorption or synthesis pathways and; or species-dependent genetic differences that lead to this specific nutrient balance.
c) Principal Component 3 (PC3): Here the variance is 15.5%. P became overwhelmingly very dominant in PC3 with a strong positive loading of 0.875 while Magnesium was characterized by a strong negative loading of -0.303. This component primarily captures variation related to Phosphorus content in the fresh cassava chips. As PC3 increases, Phosphorus levels are high. Magnesium shows a moderate inverse relationship; probably pointing to differences in soil phosphate availability or specific physiological processes within the cassava plant related to phosphorus accumulation.
d) Principal Component 4 (PC4): PC3 with a 9.1% variance characterized Vit. C, Na, Vit. A and Ca as having strong positive loadings of 0.412, 0.388, 0.327 and 0.320 respectively while K and Mg are characterized with strong negative loadings of -0.555 and -0.326 respectively. Although PC4 explains a smaller proportion of variance, however, the analysis highlights another contrast reflecting high levels of Vitamin C, Sodium, Vitamin A, and Calcium against high levels of Potassium and Magnesium. This component might capture subtler variations or specific genetic traits that influence these nutrient balances.
e) Principal Components PC5, PC6, PC7: These components explain negligible variance which are effectively zero numerically. Their specific loadings are not meaningful for practical interpretation, as they do not represent significant underlying patterns in the dataset.
3.5. Principal Component Analysis of Dried Samples of Mineral and Vitamins Contents in (mg/100g)
The PCA plots (scree, score, loading and biplot) of dataset on Table 3 are displayed on figure 6.
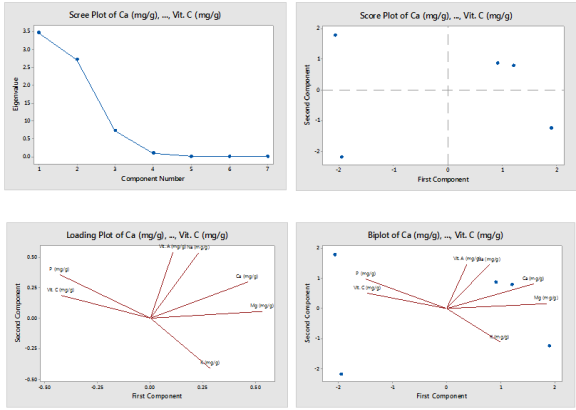
Figure 6. Mineral and Vitamins Contents of the Dried Samples in (mg/100g).
Table 6. Eigenanalysis of the Correlation Matrix of Dried Samples.

Component

Eigenvalue

Proportion

Cumulative

PC1

3.4725

0.496 (49.6%)

0.496 (49.6%)

PC2

2.7165

0.388 (38.8%)

0.884 (88.4%)

PC3

0.7236

0.103 (10.3%)

0.988 (98.8%)

PC4

0.0874

0.012 (1.2%)

1.000 (100%)

PC5

0.0000

0.0000 (0.0%)

1.000 (100%)

PC6

0.0000

0.0000 (0.0%)

1.000 (100%)

PC7

-0.0000

-0.000 (-0.0%)

1.000 (100%)

Table 7. Eigenvectors for Dried Samples.

Variable

PC1

PC2

PC3

PC4

PC5

PC6

PC7

Ca (mg/g)

0.462

0.298

0.117

-0.305

-0.041

0.720

-0.267

Mg (mg/g)

0.531

0.056

-0.040

0.364

-0.528

-0.381

-0.397

K (mg/g)

0.284

-0.410

0.605

-0.005

-0.277

0.075

0.551

Na (mg/g)

0.227

0.534

-0.181

-0.501

-0.120

-0.384

0.466

P (mg/g)

-0.428

0.355

-0.116

0.343

-0.603

0.355

0.264

Vit. A (mg/g)

0.108

0.542

0.437

0.522

0.461

-0.075

0.114

Vit. C (mg/g)

-0.421

0.188

0.618

-0.365

-0.230

-0.228

-0.410

3.5.1. Eigenanalysis of the Correlation Matrix (Variance) of Dried Samples
This explains how much of the total variability in the dataset is captured by each principal component (PC).
a) Significant Components: The first two principal components (PC1 and PC2) collectively explain a very high proportion of the total variance: 49.6%+38.8% = 88.4%. This indicates that most of the variability in the mineral and vitamin content of dried cassava chips can be effectively summarized by these two components.
b) Reduced Dimensionality: With 88.4% of the variance captured by just two components, it suggests that the original 7 variables can be effectively represented in a 2-dimensional space without losing much information.
c) PC3's Contribution: PC3 contributes an additional 10.3% of the variance, bringing the cumulative total to 98.8%. Including PC3 would explain almost all the variability in the data.
d) Minor Components: PC4 explains only 1.2% of the variance. Components PC5, PC6, and PC7 have eigenvalues of approximately zero (or negative due to computational precision with very small numbers), meaning they explain virtually no additional variance. This confirms that the meaningful dimensions for analysis are primarily PC1, PC2, and potentially PC3.
3.5.2. Eigenvectors (Loadings)
From table 7, the eigenvectors (loadings) indicate how each original variable contributes to the formation of each principal component. A larger absolute value indicates a stronger contribution. Positive values indicate a direct relationship, while negative values indicate an inverse relationship.
a) Principal Component 1: Having a variance of 49.6%, Mg and Ca are characterized with strong positive loadings of 0.531 and 0.462 respectively while P and Vit. C exhibited strong negative loadings of -0.428 and -0.421 respectively. PC1 primarily represents a dimension where Magnesium and Calcium levels tend to be high, while Phosphorus and Vitamin C levels tend to be low, and vice versa. This could indicate a general "mineral content" factor contrasting with certain vitamin levels, reflecting processing effects where some nutrients are retained or lost.
b) Principal Component 2: PC2 of dried sample displays 38.8% variability with strong positive loadings of Vit. A and Na being 0.542 and 0.534 respectively. K shows a strong negative loading of -0.410. This demonstrates that PC2 is mainly driven by Vitamin A and Na moving in the same direction, and K moving in the opposite direction. The analysis of the second component might represent a "vitamin and sodium content" axis, or possibly differentiates between varieties or processing methods that affect these specific nutrients differently. For instance, a high PC2 score would mean high Vit. A and Na, but low K.
c) Principal Component 3: Here the variance reaches 10.3% having Vit. C and K with strong positive loadings of 0.618 and 0.605 which largely captures variation related to Vit. C and K. These two variables tend to increase or decrease together along this component. Since PC1 and PC2 explain most of the variance, PC3 provides additional, albeit smaller, discriminatory power, possibly highlighting specific aspects of processing or variety that primarily impact these two nutrients.
d) Principal Component 4: In PC4, the variance is 1.2%. Vit. A, Mg and P held strong positive loadings of 0.522, 0.364 and 0.343 respectively while Na Vit. C and Ca exhibited strong negative loadings of -0.501, -0.365 and -0.305 respectively. The implication is that PC4 differentiates between high Vit. A, Mg, and P vs. high Na, Vit. C, and Ca. This component might be indicative of very subtle differences or minor underlying factors.
e) Components PC5, PC6, PC7: These components explain negligible variance (effectively zero). Their specific loadings are of little practical interpretative value for understanding the major patterns in the data, as they represent noise or very minor, uncorrelated variations. For example, PC5 shows strong negative loadings for P (-0.603) and Mg (-0.528), and a positive loading for Vit. A (0.461), but since its eigenvalue is zero, this "component" doesn't explain any meaningful variance.
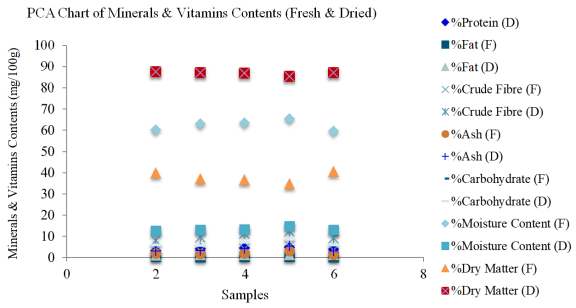
Figure 7. Combined PCA Chart of Proximate Composition of Vitamins and Minerals (Fresh & Dried) Samples.
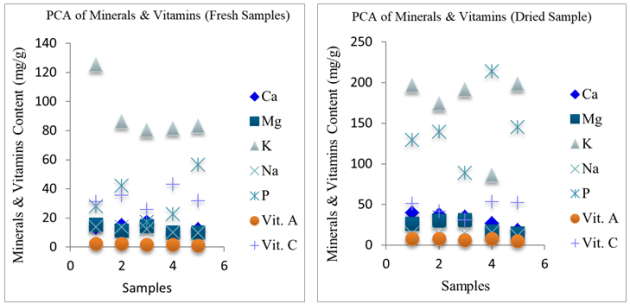
Figure 8. Separate PCA Charts of Minerals & Vitamins (Dried Sample).
PCA displayed on figures 7 and 8 reduces complex nutritional data into two dimensions (Fresh and Dried for visualization. Fresh and dried samples are clearly separated, indicating strong influence of drying on nutrient profiles. The dried samples cluster more tightly, suggesting more consistent nutrient concentration after processing.
Samples of D and E of the fresh and dried cassava chips show separation along PC1, indicating distinct mineral and vitamin profiles. PCA confirms that processing method of drying is the main factor influencing the variation in physicochemical properties.
The Radar Charts of Fresh dried and that of both fresh and dried samples are as displayed on figures 9, 10 and 11.
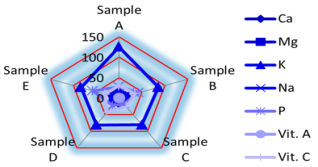
Figure 9. Radar Chart of Fresh Samples.
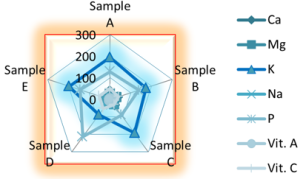
Figure 10. Radar Chart of Dried Samples.
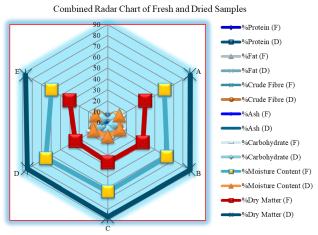
Figure 11. Radar Chart of Fresh and Dried Samples.
The plot on figure 9 shows the chart of the normalized nutrient profile of each fresh sample. Sample B exhibits a balanced distribution of minerals and vitamins with peaks in P, Vit A, and Vit C. Sample D shows a strong vitamin C but is weaker in Ca and P. Radar plots helped to identify the strengths and weaknesses in nutrient composition per sample for selective breeding or product development. From figure 10, Sample D has the largest area, reflecting superior nutrient density across most vitamins and minerals. Sample C has high K and Mg, while Sample E leads in K and Vit. C. These dried profiles confirm Sample D as best overall for health-oriented applications such as snacks or supplement.
3.5.3. Variety-Specific Observations
Sample D of the dried samples show the highest overall nutritional quality; of which protein, fibre, phosphorus and vitamin C have nutritional qualities of 4.76%, 12.24%, 213.60 mg/g and 52.95 mg/g respectively. Notably, Sample C has the highest dried fibre content (11.26%) and relatively high potassium when compared to sample A.
3.6. Hydrogen Cyanide (HCN) Content
The observations from this characterization study corroborates that cyanide content in cassava chips determines the concentration of cyanogenic glycosides, mainly linamarin and lotaustralin, which can release toxic HCN when cassava is processed or consumed. Cassava contains cyanide as a natural defense compound and high cyanide levels can cause acute poisoning or chronic health issues if not reduced during processing. In , the World Health Organization recommends a maximum safe level of 10 mg HCN/kg in cassava flour. Species E in the dataset on table 8 have lower natural cyanide levels, indicating that longer drying time and lower temperature help reduce cyanide more effectively. The dataset further shows that efficient drying helps leach or break down cyanogenic compounds. Figure 9 shows the plot of cyanide versus cassava species in which sample E has least cyanide content.
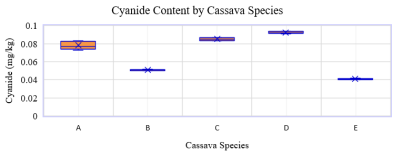
Figure 12. Cyanide Content of Species (Samples) of Cassava Chips.
Table 8 indicates that Sample E has the lowest cyanide levels, with a tight cluster around 0.04 mg/kg. Sample D shows the highest cyanide content, with values close to the upper acceptable limit of approximately 0.093 mg/kg. Samples B and C have moderate levels of cyanide contents while Sample A trends higher than E but lower than D in terms of cyanide contents. This visualization confirms that cassava species represented in the different samples play a critical role in cyanide content, especially when paired with controlled time and temperature. The ultimate goal and optimization criteria for the different species of cassava chips used in this study is to minimize cyanide content using constraints of time (20–70), temperature (0–100°C), cassava Species (Samples A to E) to achieve a cyanide acceptable range between 0.01336 and 0.09959 mg/kg; and the results obtained collaborate recent studies by .
Table 8. Summary of Key Observations.

Rank

Time (Min)

Temp. (°C)

Samples (Species)

Cyanide (mg/kg)

Desirability

1

43.55

30.00

E

0.03988

0.692 (Selected)

2

34.70

30.00

E

0.04031

0.687

3 -5

42 - 47

30.00

B

0.05030 – 0.0505

0.57

6 – 7

37

100.00

A

0.07047

0.34

8 – 9

43

30.00

C

0.08100

0.22

10 – 11

34

30.00

A

0.08400

0.18

12 - 14

45 - 47

100.00

C

0.08600

0.16

15

45 - 47

100.00

D

0.09262

0.08

16

42.91

30.00

D

0.09363

0.07

a) Cyanide Minimization Trends: Figure 9 and table 8 illustrate that Species E consistently shows lowest cyanide levels in the range of 0.039 and 0.040 mg/kg, especially at lower temperatures (30°C). The optimal combination for healthy chips production for species E is achieved at 43.55 min drying time, 30°C drying temperature, 0.03988 mg/kg cyanide content and 0.692 desirability. This is within the range specified by .
b) Effect of Temperature: Lower temperature (30°C) is strongly associated with lower cyanide content while higher temperatures (100°C), especially with Species A–D, tend to increase cyanide content up to 0.093 mg/kg, possibly due to reduced volatilization of HCN at higher moisture retention, starch gelatinization hindering cyanogenic glycoside breakdown and effect of Cassava Species. Species E shows superior detoxification under processing, possibly due to naturally lower cyanogenic glycoside level and favorable cell structure aiding leaching during drying. Species D shows the worst performance in the analysis by maintaining cyanide levels close to the upper limit.
c) Effect of Time: Mid-range processing times of 35 to 45 minutes appear optimal and very short or very long durations are not necessarily beneficial on their own as effectiveness is dependent on cassava species and drying temperature-dependent.
3.7. Moisture Contents
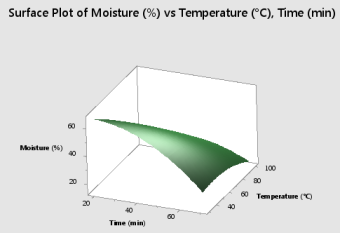
Figure 13. Response Surface of Time and Temperature on Moisture Content in Cassava Chips.
The study focused on removal of moisture content to an acceptable level to extend shelves life of the chips. Therefore, deduction from figure 13 shows that drying time and temperature affect the removal of moisture content of the cassava chips but Species of the cassava chips did not affect it. Hence, Time (Factor A´) and Temperature (Factor B´) are significant but Species (Factor C´) is not significant.
The analysis provided is based on a Response Surface Quadratic Model for moisture content in cassava chips, using Analysis of Variance (ANOVA) to identify statistically significant effects from factors such as time (A´), temperature (B´), cassava species (C´), and their interactions.
Table 9. Model Summary.

Term

F -Value

P -Value

Significance

Model

14.38

< 0.0001

Significant

A´ (Time)

67.12

< 0.0001

Highly significant

B´ (Temperature)

103.59

< 0.0001

Highly significant

C´ (Species)

1.89

0.1276

Not significant

A´2

36.05

< 0.0001

Quadratic effect of time

B´2

9.67

0.00032

Quadratic effect of temperature

A´B´

20.68

< 0.0001

Time-dependent interaction

A´C´, B´C´

< 1.0

> 0.5

Not significant

In table 9 and figure 13, Time (A´) and Temperature (B´) are the dominant factors and both have very high F-values and low p-values, indicating that the factors strongly influence moisture reduction. Longer drying times and higher temperatures significantly reduce moisture content due to extended exposure which allows more water evaporation and higher heat increase vapor pressure and drying rate. Cassava Species (C´) is not statistically significant. In spite the biological variation among species, species type had no statistically significant effect on moisture content as indicated by p = 0.1276. This suggests that moisture loss is governed more by physical drying parameters than species-specific differences in the structure or composition of the chips. For the quadratic effects (A´² and B´²), both time and temperature have significant quadratic terms indicating a non-linear relationship. More so, there exits an optimum range beyond which moisture loss peaks or changes more gradually as extremely prolonged drying time and high temperature may yield diminishing returns. The interaction between time and temperature (A´ B´) is significant showing that the effect of time depends on temperature and vice versa. There are further insignificant interactions between time - species (A´ C´) and temperature - species (B´ C´) confirming the study of Maalekun et al., that species significantly influence drying behavior under varying time and temperature .
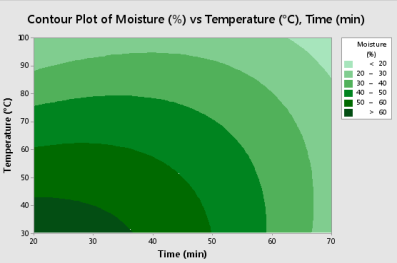
Figure 14. Contour of Time and Temperature on Moisture Content in Cassava Chips.
The contour plot on figure 14 revealed a strong interactive influence of drying time and temperature on cassava chip moisture content, consistent with the regression model on table 9; where both factors were highly significant (A = –11.33, B = –14.08, AB = +8.90). Moisture declined sharply from >30% at low time–temperature regions (20–30 min, 30–50°C) to <15% under optimal mid-range conditions (45–55 min, 60–80°C). The negative quadratic coefficients for time (A² = –8.91) and temperature (B² = –4.61) indicate curvature, confirming diminishing returns at extreme levels. Importantly, species-dependent terms highlight varietal differences in drying response, implying that while moderate conditions optimize overall moisture reduction, species-specific adjustments are required to achieve uniform product quality and ensure safe storage. In their separate studies, utilized response surface and contour plots for characterization of species-dependent physiochemical properties of postharvest food products and the results provided insights into drying processes optimization.
4. Conclusions
This study addressed the limited comparative understanding of species-dependent variations in cassava chips by applying standardized physicochemical characterization and drying experiments. Results showed that drying improved nutritional concentration, with Sample D emerging as the most promising variety for functional food applications, while Sample E demonstrated superior cyanide reduction at low-temperature processing. Sun drying proved more effective than oven drying in cyanide elimination due to enhanced linamarase activity at temperatures below 55°C. Drying time and temperature strongly influenced moisture and cyanide levels, though species selection had a greater impact on detoxification outcomes. Principal component analysis further revealed distinct nutrient trade-offs across varieties, underscoring the importance of varietal choice in nutritional optimization. The findings highlight the critical role of cassava species and drying conditions in ensuring safe consumption, guiding quality control, and informing processing protocols.
5. Recommendation
Future studies may integrate biochemical and genetic profiling to explain species-specific responses and support targeted post-harvest innovations.
Abbreviations

A

Game-Changer Cassava Specie

B

Obasanjo-II Cassava Specie

C

Poundable Cassava Specie

D

Hope Cassava Specie

E

Baba-70 Cassava Specie

Time Factor

Temperature Factor

Specie Factor

2

Quadratic Effects of Time

2

Quadratic of Temperature

A´B´

Time - temperature Interaction

A´C´

Time – Species Interaction

B´C´

Temperature – Species Interaction

%

Percent / Percentage

Mg/g

Milligram per gram

RSM

Response Surface Methodology

KCN

Potassium Cyanide

PC

Principal Component

PCA

Principal Component Analysis

Ca

Calcium

Mg

Magnesium

K

Potassium

Na

Sodium

P

Phosphorus

Vit. A

Vitamin A

Vit. C

Vitamin C

HCN

Hydrogen Cyanide

AOAC

Association of Official Analytical Chemists

ANOVA

Analysis of Variance

Author Contributions
Thomas Okechukwu Onah: Conceptualization, Formal Analysis, Investigation, Methodology, Resources, Validation, Writing – original draft, Writing – review & editing
Christian Chikezie Aka: Conceptualization, Formal Analysis, Investigation, Methodology, Resources, Validation, Writing – original draft, Writing – review & editing
Samuel David Tommy: Conceptualization, Formal Analysis, Investigation, Methodology, Resources, Validation, Writing – original draft, Writing – review & editing
Conflicts of Interest
The authors hereby declare that there exist no known conflicts of interest in this manuscript.
References
[1] Swennen, R., Ortiz, R., Gebhardt, S., and Bellotti, A. (2021). Cassava: A Reference Handbook. Springer, New York, NY.
[2] Ikuemonisan, E. S., Mafimisebi, T. E., Ajibefwn, I., Adenegan, K., (2020). Cassava Production in Nigeria: trends, instability and decomposition analysis (1970 – 2018). Heliyon, 6(10): e05089.
[3] Lozano, J. C., Luna, J. C., & Blanca Meneses, R. (2019). Cassava: characteristics, uses and problems of utilization. Food Reviews International, 31(2): 189-204.
[4] Maalekuu, B. K., Owusu-Ansah, F., Atudorei, V, N., & Sossou, M. E. (2019). Cassava drying methods and their effect on quality parameters: A review. Journal of International Academic Research for Multidisciplinary, 7(4): 188-200.
[5] Ogbu, J. O., Mbaeyi-Nwaoha, I. E., Nwankwo, C. C., & Orji, J. O. (2020). Postharvest Handling Techniques on Cassava (Manihot esculenta): A Review. Journal of Agriculture and Ecology Research International, 20(1), 42-56.
[6] Milena, L., Maria, D. F., Arianna, R., and Dante, M. F., (2023). Improved Processing Methods to reduce the total cyanide content of cassava roots from Bwrundi. African Journal of Biotechnology, 12(19): 2685-2691.
[7] Tewe, O. O., & Iyayi, E. A. (2022). Toxicological implications of cyanogens in cassava diets. Nutrition Research, 9(11), 1207-1214.
[8] Monroy-Rivera, J. A., Angulo, B. E., & Bressani, R. (2018). Chemical and nutritional changes during root cutting and exposure to air in cassava. Journal of Food Science, 61(2), 369-373.
[9] Bánkuti, F. I., Madi, A., & Nwogu, A. O. (2019). Effect of processing methods on the nutritional value and toxicity of cassava: A review. International Journal of Food Science and Agriculture, 3(2), 14-23.
[10] Okudo, H., & Rosentrater, K. A. (2020). Cassava Processing and Utilization: Current Practices and Emerging Trends. Journal of Food Processing and Preservation, 40(6), 1049-1061.
[11] Harrigan, G. G., & Lueschow, S. R. (2019). Cyanide in Cassava: An Update. Journal of Agricultural and Food Chemistry, 62(40), 9754-9763.
[12] Hidayat, A., Hermanto, C., Nugroho, A., Hastuti, U. S., & Sumardiono, S. (2022). Variability of cyanide potentials in cassava (Manihot esculenta) leaves and roots. Journal of the Science of Food and Agriculture, 82(3), 329-334.
[13] Splittstoesser, W. E., & Tunya, H. (2018). Cyanogenic compounds in cassava and their relationship to agroecological factors. International Journal of Food Science & Technology, 27(3), 289-298.
[14] Huaman, Z., and Spooner, D. M. (2018). Reclassification of landrace populations of cultivated potatoes (Solanum sect. petota). American Journal of Botany. 89(6): 947 – 965.
[15] Cardoso, O., Ravagnani, S. P., Ramos, A. C., Pinheiro-Sant’Ana, H. M., Figueira, R. C., & Shimokomaki, M. (2019). Cyanogenic glycosides in Cassava and Linamarin determination in Manioc Flour by HPLC. Brazilian Archives of Biology and Technology, 48(4), 541-546.
[16] Wheatley, A. O., Sharif, M. K., & Butt, M. S. (2021). Chemical composition and nutritional quality of bitter and sweet apricot kernels. Food Chemistry, 46(1), 41-46.
[17] Onwueme, I. (2018). Effect of Harvesting Stages and Drying Methods on Some of the Antinutritive Components of Cassava (Manihot esculenta Crantz) Tubers. Journal of Agricultural and Food Chemistry, 26(3): 608-610.
[18] Peng, W., Jeffrey, C. S., Jackson, L. S., & Wei-Chuan, C. (2020). Cyanogenic Glucoside Degradation during Processing of Cassava Leaf and Roots: Effects of Traditional African Fermentation. Journal of Agricultural and Food Chemistry, 65(26), 5248-5254.
[19] Akinwale, T. O., Ogunlakin, G. O., & Awoyale, W. (2022). Nutritional optimization of cassava-based foods through processing. Food Bioscience, 47, 101781.
[20] Olufayo, AA., & Ogunkunle, AT. (2020). Effect of layer thickness and weather conditions on drying of cassava chips under natural convection. International Journal of Food Science & Technology, 34(1): 85-91.
[21] Udoro, E. O., Omodara, M. A., & Adebayo, S. E. (2023). Moisture reduction techniques in cassava products: Impact on quality and shelf stability. Journal of Food Science and Technology, 60(4), 1051–1060.
[22] Akpan, I. E., & Umoh, I. B. (2020). Retention of β-carotene and vitamin C in dried cassava products using optimized drying methods. International Journal of Food Properties, 23(1), 1085–1099.
[23] Boakye Peprah, B., Parkes, E. Y., Harrison, O. A., Jacoby, A., Steiner-Asiedu, M. & Labuschagne, M. (2020). Proximate Composition, Cyanide Content, and Carotenoid Retention after Boiling of Provitamin A-Rich Cassava Grown in Ghana. Foods. 9. 1800.
[24] Mohidin, S. R. N. S. P., Moshawih, S., Hermansyah, A., Asmuni, M. I., Shafqat, N., & Ming, L. C. (2023). Cassava (Manihot esculenta Crantz): A Systematic Review for the Pharmacological Activities, Traditional Uses, Nutritional Values, and Phytochemistry. Journal of evidence-based integrative medicine, 28, 2515690X231206227.
[25] Popova, A. (2019). The effect of heating on the vitamin C content of selected vegetables. World Journal of Advanced Research and Reviews. 3. 2581-9615.
[26] Quinn, A. Myrans, H. & Gleadow, R. (2022). Cyanide Content of Cassava Food Products Available in Australia. Foods. 11. 1384.
[27] Cumbana, R. P., Dovlo, F., & Mlingi, N. (2019). Variations in various processing methods for the removal of cyanide, phytic acid and tannins from cassava chips. International Journal of Food Science & Technology, 42(9), 1055-1061.
[28] Odongo, M. & Mutagaya, S. A. (2023). Investigation of Levels of Cyanide in Cassava Tubers Marketed in Kampala. American Journal of Applied Scientific Research, 9(1), 21-26.
[29] Bello, F. A., Obadina, A. O., & Oyedele, H. A. (2024). Evaluating cassava varieties for nutrient-dense snack development. African Journal of Food, Agriculture, Nutrition and Development, 24(1), 13812–13826.
[30] Lazzari, G. (2022). Drying of Foods: Principles and Practice (Third Edition). Woodhead Publishing Limited.
[31] Nartey, F., Amoa-Awua, W. K., & Appiah, V. (2018). Cyanide content of cassava and cassava-based dishes in the Brong-Ahafo region, Ghana. Food Control, 18(7), 905-908.
[32] Jimoh, M. O., Afolayan, A. J., & Lewu, F. B. (2021). Mineral composition and bioavailability in cassava-based food products: Effect of variety and processing methods. Journal of Food Composition and Analysis, 98, 103830.
[33] World Health Organization. (2021). Cassava cyanogens and human health. Retrieved from
[34] Laskar, A. A., Ahmed, M., Khan, A. & Samir, M. (2022). Experimental investigation and statistical validation of mathematical models for hot air drying traits of carrot. Food Science and Technology International. 29. 108201322210932.
[35] Kaur, D., Kumar, M., Gupta, O. P., Sharma, S. & Kumar, S. (2018). Drying Characteristics of Fenugreek and Its Computer Simulation for Automatic Operation. International Journal of Current Microbiology and Applied Sciences. 7. 3275-3291.
Cite This Article
  • APA Style

    Onah, T. O., Aka, C. C., Tommy, S. D. (2025). Species-Dependent Variations in the Physicochemical Properties of Bio-chips: Implications for Quality Control and Processing Optimization of Cassava. American Journal of Applied Scientific Research, 11(4), 176-192. https://doi.org/10.11648/j.ajasr.20251104.11

    Copy | Download

    ACS Style

    Onah, T. O.; Aka, C. C.; Tommy, S. D. Species-Dependent Variations in the Physicochemical Properties of Bio-chips: Implications for Quality Control and Processing Optimization of Cassava. Am. J. Appl. Sci. Res. 2025, 11(4), 176-192. doi: 10.11648/j.ajasr.20251104.11

    Copy | Download

    AMA Style

    Onah TO, Aka CC, Tommy SD. Species-Dependent Variations in the Physicochemical Properties of Bio-chips: Implications for Quality Control and Processing Optimization of Cassava. Am J Appl Sci Res. 2025;11(4):176-192. doi: 10.11648/j.ajasr.20251104.11

    Copy | Download

  • @article{10.11648/j.ajasr.20251104.11,
      author = {Thomas Okechukwu Onah and Christian Chikezie Aka and Samuel David Tommy},
      title = {Species-Dependent Variations in the Physicochemical Properties of Bio-chips: Implications for Quality Control and Processing Optimization of Cassava
    },
      journal = {American Journal of Applied Scientific Research},
      volume = {11},
      number = {4},
      pages = {176-192},
      doi = {10.11648/j.ajasr.20251104.11},
      url = {https://doi.org/10.11648/j.ajasr.20251104.11},
      eprint = {https://article.sciencepublishinggroup.com/pdf/10.11648.j.ajasr.20251104.11},
      abstract = {The systematic analysis of edible biochips provides accurate and reproducible data that supports quality assurance, safety assessment, and optimization; for utilization in food and industrial processing applications. Despite their wide deployment, limited studies have comprehensively compared the physicochemical properties of different cassava varieties using standardized analytical methods. This study focuses on the investigation of the species-dependent variations in the physicochemical properties of cassava chips. Game-Changer, Obasanjo-II, Poundable, Hope, and Baba-70 denoted as samples A, B, C, D and E respectively were oven-and-sun dried under controlled conditions. Moisture, cyanide, and physicochemical properties were modeled using Response Surface Methodology (RSM), Principal Component Analysis (PCA), Radar plots and Analysis of Variance (ANOVA) for optimization. The investigation covered percentage composition of fresh and dried samples, vitamins-minerals contents, principal components, correlations matrix, nutrients radar, hydrogen cyanide (HCN) content, moisture content and fundamental chemical attributes affecting the structural integrity of the chips. Sample D exhibited the highest initial moisture content while Sample E recorded the lowest, indicating a species-dependent variation in moisture retention. Minimal cyanide content within acceptable range was achieved, which demonstrates effective detoxification under controlled conditions. Species and temperature exerted a stronger influence than time; and observation identified specie as the most critical factor. PCA revealed complex nutrient trade-offs among minerals and vitamins, while RSM indicated that balanced control of drying time and temperature, rather than extreme settings, ensures optimal moisture reduction and processing efficiency. These findings underscore the hypercritical role of species selection in post-harvest cassava processing and provide baseline data for predicting drying behavior, ensuring product safety, and optimizing processing parameters for food and industrial applications.},
     year = {2025}
    }
    

    Copy | Download

  • TY  - JOUR
    T1  - Species-Dependent Variations in the Physicochemical Properties of Bio-chips: Implications for Quality Control and Processing Optimization of Cassava
    
    AU  - Thomas Okechukwu Onah
    AU  - Christian Chikezie Aka
    AU  - Samuel David Tommy
    Y1  - 2025/10/14
    PY  - 2025
    N1  - https://doi.org/10.11648/j.ajasr.20251104.11
    DO  - 10.11648/j.ajasr.20251104.11
    T2  - American Journal of Applied Scientific Research
    JF  - American Journal of Applied Scientific Research
    JO  - American Journal of Applied Scientific Research
    SP  - 176
    EP  - 192
    PB  - Science Publishing Group
    SN  - 2471-9730
    UR  - https://doi.org/10.11648/j.ajasr.20251104.11
    AB  - The systematic analysis of edible biochips provides accurate and reproducible data that supports quality assurance, safety assessment, and optimization; for utilization in food and industrial processing applications. Despite their wide deployment, limited studies have comprehensively compared the physicochemical properties of different cassava varieties using standardized analytical methods. This study focuses on the investigation of the species-dependent variations in the physicochemical properties of cassava chips. Game-Changer, Obasanjo-II, Poundable, Hope, and Baba-70 denoted as samples A, B, C, D and E respectively were oven-and-sun dried under controlled conditions. Moisture, cyanide, and physicochemical properties were modeled using Response Surface Methodology (RSM), Principal Component Analysis (PCA), Radar plots and Analysis of Variance (ANOVA) for optimization. The investigation covered percentage composition of fresh and dried samples, vitamins-minerals contents, principal components, correlations matrix, nutrients radar, hydrogen cyanide (HCN) content, moisture content and fundamental chemical attributes affecting the structural integrity of the chips. Sample D exhibited the highest initial moisture content while Sample E recorded the lowest, indicating a species-dependent variation in moisture retention. Minimal cyanide content within acceptable range was achieved, which demonstrates effective detoxification under controlled conditions. Species and temperature exerted a stronger influence than time; and observation identified specie as the most critical factor. PCA revealed complex nutrient trade-offs among minerals and vitamins, while RSM indicated that balanced control of drying time and temperature, rather than extreme settings, ensures optimal moisture reduction and processing efficiency. These findings underscore the hypercritical role of species selection in post-harvest cassava processing and provide baseline data for predicting drying behavior, ensuring product safety, and optimizing processing parameters for food and industrial applications.
    VL  - 11
    IS  - 4
    ER  - 

    Copy | Download

Author Information
  • Abstract
  • Keywords
  • Document Sections

    1. 1. Introduction
    2. 2. Materials and Methods
    3. 3. Results and Discussions
    4. 4. Conclusions
    5. 5. Recommendation
    Show Full Outline
  • Abbreviations
  • Author Contributions
  • Conflicts of Interest
  • References
  • Cite This Article
  • Author Information