Climate change induced irregularities in amount and frequency of extreme temperature and precipitation events are likely to increase across the globe. Climate change has created a new challenge to hamper development process throughout the world. For this analysis meteorological daily rainfall station data in millimetre, maximum temperature and minimum temperature data in degreecentgrade, wind speed in meter per second and direction in degree data including historical period from 2025-1995 G. c was taken form Ethiopian Meteorology Institute for a study area of Adama wereda. Result indictes Climatological rainfall (long-term monthly average) in Adama wereda has raised pic in the month of July and August with amount of above 200 mm (two hundred mm). The average daily temperature reaches from 18°C to 24°C prevailed in Adama wereda of Oromia region Ethiopia. Extreme maximum temperature of Adama wereda was recorded 36.1°C and Extreme minimum temperature of Adama wereda was recorded 3.1°C. Wind Rose diagrams has displays for Adama wereda average wind speed for winter season mostly dominated from 4m/s to 7.5m/s and the wind direction in this season dominated to ENE (East North East) direction of in Adama wereda and Wind Rose diagrams has displays for Adama wereda average wind speed for Summer season mostly dominated from 3m/s to 7m/s and the wind direction in this season dominated to WSW (West South West) and SSW (south south west) direction of in Adama wereda. The wind load analaysis indicates for windward wall is 0.0112 km/m2 and for leeward is - 0.0048km/m2. This analysis of climate pattern and trends will have benefits for decision makers and strategy in the study area.
This is an Open Access article, distributed under the terms of the Creative Commons Attribution 4.0 International License (http://creativecommons.org/licenses/by/4.0/), which permits unrestricted use, distribution and reproduction in any medium or format, provided the original work is properly cited.
Climate change induced irregularities in amount and frequency of extreme temperature and precipitation events are likely to increase across the globe. ″Climate change has created a new challenge to hamper development process throughout the world
[6]
Mesay M. & Degefa T., 2017. Description of long term climate data in eastern and southeaster Ethiopia: College of development of studies Adis abeba University Et.
[8]
World Meteorological Organization [WMO], (2012). Standard Precipitation Index User Guide. guide (M. Svoboda, M. Hayes and D. Wood). (WMO-No. 1090), Geneva.
[6, 8]
″. It is widely acknowledged that the impacts of ″climate-change amplify unfavorable climatic and environmental situations, particularly for developing countries
[7]
McCarthy, J. J., Canziani, O., Leary, N. A., Dokken, D. J., and White, K. S., (2001). Climate change: impacts, adaptation and vulnerability, IPCC working group II. Cambridge University Press, Cambridge. hiopia: Elsivier:
Endalew A, 2021. WIND SPEED POTENTIAL ASSESSMENT OF SELECTED CLIMATIC ZONES OF ETHIOPIA: College of Electrical & Mechanical Engineering, Addis Ababa Science and Technology University: RT&A, Special Issue № 1 (60) Volume 16, Janyary 2021.
[4]
Wind is one of the globally recognized potential renewable energy sources″ and it is important to have an inclusive knowledge about the wind characteristics for efficient planning and implementation of wind power generation plants.
Wind roses are graphical charts that characterize the speed and direction of winds at a location. Presented in a circular format, the length of each "spoke" around the circle indicates the amount of time that the wind blows from a particular direction. Colors along the spokes indicate categories of wind speed. A wind rose gives a succinct view of how wind speed and direction are typically distributed at a particular location.
Wind load refers to the forces or pressures exerted on a structure by the wind. It is a critical factor in the design and construction of buildings, ensuring structural integrity and safety. Properly accounting for wind load in design ensures that buildings can withstand high winds, reducing the risk of structural failure and protecting occupantshttps: //www.studiocarney.com/glossary/wind-load.
Adama wereda has designated as region A is characterized by quasi-double maxima rainfall pattern, with a small peak in April and maximum peak in August. The central and most of the eastern half of the country Ethiopia is included in this rainfall regime. ″The two rainy periods are locally known as ‘Kiremt’ (June to September) and ‘Belg’ (February to May), which are the long and short rainy periods, respectively. Short ‘dry’ period, which covers the rest of the year (i.e., October to January), known as Bega
[1]
Bekele, F., (1997). Ethiopian use of ENSO information in its seasonal forecast. Internet Journal for African Studies (IJAS), Vol. 1, No. 2. Case studies.
[1]
″.
Since the climatic condition has defined with a reference of a time it is advisable updated and analysed the climatic parameters with a reference of time for a location. Adama wereda is the second economic and endustrized wereda for the country of Ethiopia. ″
[5]
Gezahegn L, 2025. Modeling Future Rainfall Trends and Patterns Under Moderate and High Emission Scenarios in West Shewa, Oromia Region, Ethiopia: American Journal of Biological and Environmental Statistics 2025, Vol. 11, No. 3, pp. 87-106.
Understanding future rainfall variability is crucial for climate resilience planning in rain-fed agricultural regions like West Shewa in Ethiopia″.
Climate parameter such as rainfall, temperature, wind speed and direction has analyzed for allocation of Adama wereda. This information expected to address for different sectors and climate information seekers.
2. Study Area And Method for Adama Wereda
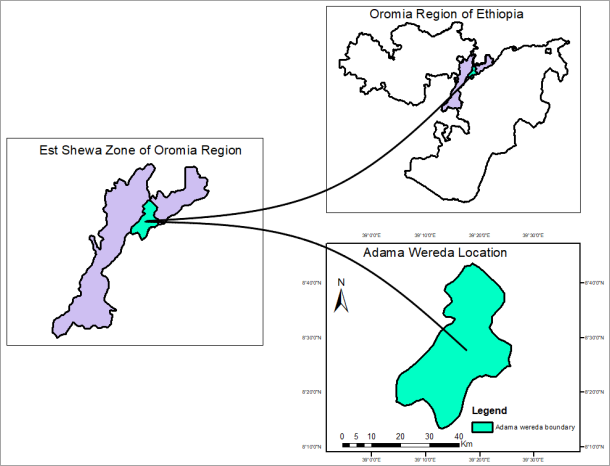
Location of Adama Wereda found in the 39°05′0″ - 39°20′0″ East and 8°45′0″ - 8°15′0″ North and it also found in Ethiopia Oromia Region East Shewa zone and it has an elevation about 1700m above sea lable.
Figure 1. Study area of Adama wereda location using Geographic Coordinate System: GCS_WGS_1984.
2.1. Metedology
The arithmetic mean is the simplest measure of central tendency and is the ratio of the sum of the items to the number of items. It is denoted by x̄. It is considered as the best measure of central tendency. The choice of the average depends upon the distribution of the data and the purpose for which it is used.
If a1, a2,…, an are the values of variable “a”, then the mean of a is calculated as below:
Arithmetic Mean=a1+a2+a3…+an/ n(1)
Where, “n” is the total number of elements in the set
1) For analysis of rainfall and temperature the arithmetic mean method was implemented mostly.
2) For wind load Analysis the below formula was implemented with consideration of different direction of wall and angle of roof.
q=0.613*Vs2/1000
q: is a wind pressure, Vs: is designed wind speed
Vs=V*S V: is basic wind speed, S: is published factor
Wind load =q*pressure factor 2
2.2. Data Type
For this analysis meteorological daily rainfall station data in millimetre, maximum temperature and minimum temperature data in degreecentgrade, wind speed in meter per second and direction in degree data including historical period from 2025-1995 G.c was taken form Ethiopian Meteorology Institute for a study area of Adama wereda.
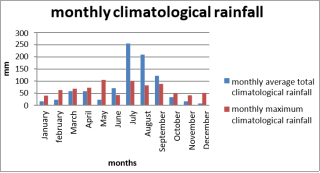
Figure 2. Monthly maximum climatological rainfall and monthly average total climatological average Rainfall of Adama wereda 2025 up to 1995 Gc.
Climatological rainfall (long-term monthly average) in Adama wereda has raised pic in the month of July and August with amount of above 200 mm (two hundred mm). The maximum rainfall in day of months was recorded in May and July in amount of above 100 mm at Adama wereda.″
[5]
Gezahegn L, 2025. Modeling Future Rainfall Trends and Patterns Under Moderate and High Emission Scenarios in West Shewa, Oromia Region, Ethiopia: American Journal of Biological and Environmental Statistics 2025, Vol. 11, No. 3, pp. 87-106.
a significant increase in annual and seasonal rainfall″, particularly during the Kiremt (summer) and Bega seasons in the near term (2030- 2059), with more pronounced increases under SSP585.
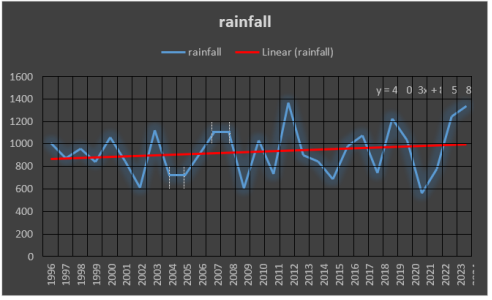
Figure 3. Total Annual trends of Rainfall of Adama wereda 2025 up to 1995 Gc.
3.2. Temperature Analysis and Trends of Adama City
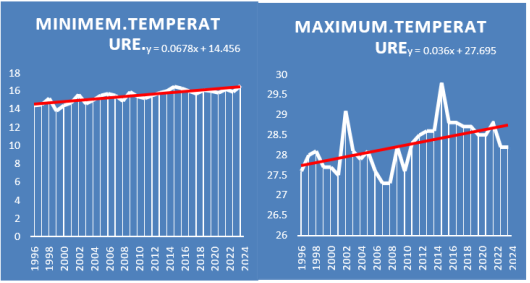
Figure 4 Average mean minimum, Average mean maximum and Average mean maximum and mean minimum Temperature of Adama wereda climatological temperature 2025-1995 Gc. In °C.
Daily average maximum temperature has reaches at pic level in months of April, May, June which around 30°C and above, critically in the month of May it rises above 30°C. Daily average minimum temperature has reaches at pic level in months of December which records below 20°C. The average daily temperature reaches from 18°C to 24°C prevailed in Adama wereda of Oromia region Ethiopia. Extreme maximum temperature of Adama wereda was recorded 36.1°C and Extreme minimum temperature of Adama wereda was recorded 3.1°C.
″the mean minimum temperature was raised by 0.05°C while the maximum temperature rose by 0.03°C/30 years″
[2]
Daniel A, 2022. Observed time series trend analysis of climate variability and smallholder adoption of new agricultural technologies in west Shewa, Ethiopia: Published by Elsevier B. V. on behalf of African Institute of Mathematical Sciences / Next Einstein Initiative.
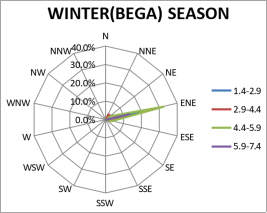
Figure 5. Average Winter season maximum wind speed and direction of Adama wereda.
Wind Rose diagrams has displays for Adama wereda average wind speed for winter season mostly dominated from 4m/s to 7.5m/s and the wind direction in this season dominated to ENE (East North East) direction of in Adama wereda.
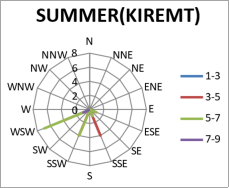
Figure 6. Average Summer season maximum wind speed in m/s and direction of Adama wereda.
Wind Rose diagrams has displays for Adama wereda average wind speed for Summer season mostly dominated from 3m/s to 7m/s and the wind direction in this season dominated to WSW (West South West) and SSW (south south west) direction of in Adama wereda. ″
[3]
Devadass T, 2015. Determining the reference basic wind speed in Ethiopia and comparing with compulsory Ethiopian standard CES 145: Faculty of Civil Engineering, Arba Minch University, Arba Minch, P. O. Box 21, Ethiopia: Published by Elsevier B. V.
the magnitude of the operating basic wind speed was increased in 14-150%″ from the constant of 22 m/s. By using best fitted probability distribution methods of each stations, obtained result are ranging from 25 to 55 m/s in Ethiopia.
3.4. Wind Load Analysis of Adama City
1) Average maximum wind speed of Adama wereda= 8.7 m/s
2) Assumption Height at 10m building at Adama wereda and its published factor S is 0.62
q=0.613*Vs2/1000
q: are wind pressures, Vs: is designed wind speed
Vs=V*S V: is basic wind speed, S: is published factor
Windload=q*pressurefactor
Vs= 8.7 m/s * 0.62 Vs=5.2 m/s
Wind pressure q = 0.613 * (5.2)2/1000
= 0.613*27.04/1000
=0.613*0.027 q =0.016 Km/m2
Wind load = q * pressure coefficient (pc)
3.4.1. Wind Load Analysis for Wind Ward Wall and Leeward Wall Which Is 10 M Height
A) Wind load for wind ward wall which is 10 m height Pc = for wind ward wall = +0.7
Wind load = 0.7 * 0.016 km/m2= 0.0112 km/m2
B) Wind load for leeward wall which is 10m height Pc = for leeward wall = -0.3
Wind load = -0.3 * 0.016 km/m2= - 0.0048 km/m2
3.4.2. Wind Load Analysis for Wind Wards Roof and Leeward Roof Which Is 20° Angle
A) Wind load for Roof wind ward which roof slope has 200 Pc = for Roof wind ward = -0.7
Wind load = -0.7 * 0.016 km/m2= - 0.0112 km/m2
B) Wind load for Roof leeward which roof slope has 20°
Pc = for Roof leeward = -0.5 Wind load = -0.5 * 0.016 km/m2 = - 0.008 km/m2
Suction pressure is a negative pressure difference measured below atmospheric pressure
4. Conclusion
This analysis of climate pattern and trends will have benefits for decision makers and strategy in the study area. as a result indicates there is some changes in temperature and rainfall. So knowing and addressing changes of climate issues in specific location is useful for strategic for water and agriculture strategies. Wind speed and direction analysis also indicates from where wind blowing to the study area and its strength for the study area of Adama wereda. it also will have good imputes for stablishing industries and building and also the analysis will impute for different sectors.
5. Discussion
The maximum rainfall in day of months was recorded in May and July in amount of above 100 mm at Adama wereda.″
[5]
Gezahegn L, 2025. Modeling Future Rainfall Trends and Patterns Under Moderate and High Emission Scenarios in West Shewa, Oromia Region, Ethiopia: American Journal of Biological and Environmental Statistics 2025, Vol. 11, No. 3, pp. 87-106.
a significant increase in annual and seasonal rainfall″, particularly during the Kiremt (summer) and Bega seasons in the near term (2030- 2059), with more pronounced increases under SSP585. Adama district is a Bimodal (Belg and Kiremt) Rainfall benefiting areas when Bega is the dry, cold period &the harvesting time
[12]
Abdisa, et al, 2020,: Seasonal And Annual Climate Profile of Adama District, East Shewa, Oromia, Ethiopia: SSRG International Journal of Geoinformatics and Geological Science (SSRG-IJGGS) – Volume 7 Issue 2 – May – Aug 2020.
[12]
. Kiremt rainfall amount accounts 80.1%; Belg had 20.1% and Bega had 7.8% from the annual rainfall received over district The average daily temperature reaches from 18°C to 24°C prevailed
[14]
Ethiopia: National adaptation programme of action - NAPA (2007) Marigi, S. N., Njogu, A. K. and Githungo, W. N. (2016) Trends of Extreme Temperature and Rainfall Indices for Arid and Semi-Arid Lands of South Eastern Kenya. Journal of Geoscience and Environment Protection, 4, 158-171.
[14]
. Climate indices have shown decreasing trends in annual rainfall, rainfall intensity and consecutive wet days but increasing trends in consecutive dry days. Steady warming patterns were evident in both the maximum and minimum temperature indices in Kenya.
[15]
Demeke, Muluneh, Desalegn, 2024. Trends and variability in annual and seasonal rainfall amount and timing in Wereilu district, Northeastern Highlands of Ethiopia: Environmental Challenges Volume 17, December 2024, 101055:
Rainfall onset dates significantly shifted towards earlier onset, while rainfall cessation dates showed insignificant late cessation. The length of the rainy season exhibited a positive trend (p < 0.01) at Wereilu and (p < 0.05) at Kabie in Adama wereda of Oromia region Ethiopia. Extreme maximum temperature of Adama wereda was recorded 36.1°C and Extreme minimum temperature of Adama wereda was recorded 3.1°C.
″the mean minimum temperature was raised by 0.05°C while the maximum temperature rose by 0.03°C/30 years″
[2]
Daniel A, 2022. Observed time series trend analysis of climate variability and smallholder adoption of new agricultural technologies in west Shewa, Ethiopia: Published by Elsevier B. V. on behalf of African Institute of Mathematical Sciences / Next Einstein Initiative.
The result indicates a significant rise in both minimum and maximum temperatures during all four seasons over Addis Ababa City. More importantly, the minimum temperature is generally found to increase at the higher rate than the maximum temperature.
The study of wind profiles above oceanic surface shows that wind speed varies more dramatically with altitude in winter and less in summer
[11]
Liqing Zhao, 2024. Research on the characteristics of wind speed, wind direction, and wind profile based on ERA5 reanalysis data: Aerospace Traffic and Safety: Volume 1, Issues 2–4, December 2024, Pages 131-140:
. From October to March of the following year, the wind profile for each month all displays an inverted S-shaped pattern.
[9]
BD Yadav, Nilesh Choudhary, Jaydev Kumar Mahato, Nitin Kumar (2023) Study Efects of Various Wind Loadings In High Rise Rc-Framed Structures In Zone –V. Journal of Civil Engineering Research & Technology. SRC/JCERT-140.
The construction of high-rise buildings, both residential and commercial, is increasing. Every structural designer must be aware of the forces such as earthquake and wind effects.
[10]
D K Mokashi, U S Patil, Vashistha Kamble, Akshay Mandel (2017) Wind pressure distribution on triangular shape of building model, International Journal for Research in Applied Science & Engineering Technology (IJRASET).
[10]
Pressure profile changes due to angle made in 0°, 60° and 90° and effect of distance between object building and interfering building on wind loads is studied.
Wind Rose diagrams has displays for Adama wereda average wind speed for Summer season mostly dominated from 3m/s to 7m/s and the wind direction in this season dominated to WSW (West South West) and SSW (south south west) direction of in Adama wereda. ″
[3]
Devadass T, 2015. Determining the reference basic wind speed in Ethiopia and comparing with compulsory Ethiopian standard CES 145: Faculty of Civil Engineering, Arba Minch University, Arba Minch, P. O. Box 21, Ethiopia: Published by Elsevier B. V.
the magnitude of the operating basic wind speed was increased in 14-150%″ from the constant of 22 m/s. By using best fitted probability distribution methods of each stations, obtained result are ranging from 25 to 55 m/s in Ethiopia.
6. Recommendation
The climate pattern of a specific area as well as entire spatial temporal analysis has a vital role in order to know what was the previous climate and weather condition as well as present and to have capabilities to project the feature climate scenario. Wind is a dominant feature of climate condition, quantifying its direction and magnitude will be strengthen the scientific community as well as the strategic plan for the specific area like adama wereda. unlike the temperature and rainfall parameter station wind measuring stations are limited but I recommend wind measuring stations to expanded to represent different topography even in a wereda level.
Abbreviations
mm-
milemeter
°C
deegre centigrade
Pc
pressure coefficient
m/s
meter per second
KM/m2
kilometer per meter square
Acknowledgments
I acknowledge Ethiopian meteorology institute to make me to access and analyze its raw station and historic weather and climate data. The tools that I used for this analysis Arc GIS, Microsoft excel and word.
Author Contributions
Mekuanint Tariku Guta: Conceptualization, Resources, Data curation, Methodology
Conflicts of Interest
The authors declare no conflicts of interest in this article manuscript.
References
[1]
Bekele, F., (1997). Ethiopian use of ENSO information in its seasonal forecast. Internet Journal for African Studies (IJAS), Vol. 1, No. 2. Case studies.
[2]
Daniel A, 2022. Observed time series trend analysis of climate variability and smallholder adoption of new agricultural technologies in west Shewa, Ethiopia: Published by Elsevier B. V. on behalf of African Institute of Mathematical Sciences / Next Einstein Initiative.
Devadass T, 2015. Determining the reference basic wind speed in Ethiopia and comparing with compulsory Ethiopian standard CES 145: Faculty of Civil Engineering, Arba Minch University, Arba Minch, P. O. Box 21, Ethiopia: Published by Elsevier B. V.
Endalew A, 2021. WIND SPEED POTENTIAL ASSESSMENT OF SELECTED CLIMATIC ZONES OF ETHIOPIA: College of Electrical & Mechanical Engineering, Addis Ababa Science and Technology University: RT&A, Special Issue № 1 (60) Volume 16, Janyary 2021.
[5]
Gezahegn L, 2025. Modeling Future Rainfall Trends and Patterns Under Moderate and High Emission Scenarios in West Shewa, Oromia Region, Ethiopia: American Journal of Biological and Environmental Statistics 2025, Vol. 11, No. 3, pp. 87-106.
Mesay M. & Degefa T., 2017. Description of long term climate data in eastern and southeaster Ethiopia: College of development of studies Adis abeba University Et.
[7]
McCarthy, J. J., Canziani, O., Leary, N. A., Dokken, D. J., and White, K. S., (2001). Climate change: impacts, adaptation and vulnerability, IPCC working group II. Cambridge University Press, Cambridge. hiopia: Elsivier:
World Meteorological Organization [WMO], (2012). Standard Precipitation Index User Guide. guide (M. Svoboda, M. Hayes and D. Wood). (WMO-No. 1090), Geneva.
[9]
BD Yadav, Nilesh Choudhary, Jaydev Kumar Mahato, Nitin Kumar (2023) Study Efects of Various Wind Loadings In High Rise Rc-Framed Structures In Zone –V. Journal of Civil Engineering Research & Technology. SRC/JCERT-140.
D K Mokashi, U S Patil, Vashistha Kamble, Akshay Mandel (2017) Wind pressure distribution on triangular shape of building model, International Journal for Research in Applied Science & Engineering Technology (IJRASET).
[11]
Liqing Zhao, 2024. Research on the characteristics of wind speed, wind direction, and wind profile based on ERA5 reanalysis data: Aerospace Traffic and Safety: Volume 1, Issues 2–4, December 2024, Pages 131-140:
Abdisa, et al, 2020,: Seasonal And Annual Climate Profile of Adama District, East Shewa, Oromia, Ethiopia: SSRG International Journal of Geoinformatics and Geological Science (SSRG-IJGGS) – Volume 7 Issue 2 – May – Aug 2020.
[13]
GEZAHEGN B., 2018: Analysis of temperature trend over Addis Ababa City, Ethiopia:
Ethiopia: National adaptation programme of action - NAPA (2007) Marigi, S. N., Njogu, A. K. and Githungo, W. N. (2016) Trends of Extreme Temperature and Rainfall Indices for Arid and Semi-Arid Lands of South Eastern Kenya. Journal of Geoscience and Environment Protection, 4, 158-171.
[15]
Demeke, Muluneh, Desalegn, 2024. Trends and variability in annual and seasonal rainfall amount and timing in Wereilu district, Northeastern Highlands of Ethiopia: Environmental Challenges Volume 17, December 2024, 101055:
Guta, M. T. (2026). Wind ROS Wind Load and Climate Analysis of Adama Wereda Oromia Ethiopia. American Journal of Biological and Environmental Statistics, 12(2), 36-42. https://doi.org/10.11648/j.ajbes.20261202.12
Guta, M. T. Wind ROS Wind Load and Climate Analysis of Adama Wereda Oromia Ethiopia. Am. J. Biol. Environ. Stat.2026, 12(2), 36-42. doi: 10.11648/j.ajbes.20261202.12
Guta MT. Wind ROS Wind Load and Climate Analysis of Adama Wereda Oromia Ethiopia. Am J Biol Environ Stat. 2026;12(2):36-42. doi: 10.11648/j.ajbes.20261202.12
@article{10.11648/j.ajbes.20261202.12,
  author = {Mekuanint Tariku Guta},
  title = {Wind ROS Wind Load and Climate Analysis of Adama Wereda Oromia Ethiopia},
  journal = {American Journal of Biological and Environmental Statistics},
  volume = {12},
  number = {2},
  pages = {36-42},
  doi = {10.11648/j.ajbes.20261202.12},
  url = {https://doi.org/10.11648/j.ajbes.20261202.12},
  eprint = {https://article.sciencepublishinggroup.com/pdf/10.11648.j.ajbes.20261202.12},
  abstract = {Climate change induced irregularities in amount and frequency of extreme temperature and precipitation events are likely to increase across the globe. Climate change has created a new challenge to hamper development process throughout the world. For this analysis meteorological daily rainfall station data in millimetre, maximum temperature and minimum temperature data in degreecentgrade, wind speed in meter per second and direction in degree data including historical period from 2025-1995 G. c was taken form Ethiopian Meteorology Institute for a study area of Adama wereda. Result indictes Climatological rainfall (long-term monthly average) in Adama wereda has raised pic in the month of July and August with amount of above 200 mm (two hundred mm). The average daily temperature reaches from 18°C to 24°C prevailed in Adama wereda of Oromia region Ethiopia. Extreme maximum temperature of Adama wereda was recorded 36.1°C and Extreme minimum temperature of Adama wereda was recorded 3.1°C. Wind Rose diagrams has displays for Adama wereda average wind speed for winter season mostly dominated from 4m/s to 7.5m/s and the wind direction in this season dominated to ENE (East North East) direction of in Adama wereda and Wind Rose diagrams has displays for Adama wereda average wind speed for Summer season mostly dominated from 3m/s to 7m/s and the wind direction in this season dominated to WSW (West South West) and SSW (south south west) direction of in Adama wereda. The wind load analaysis indicates for windward wall is 0.0112 km/m2 and for leeward is - 0.0048km/m2. This analysis of climate pattern and trends will have benefits for decision makers and strategy in the study area.},
 year = {2026}
}
TY  - JOUR
T1  - Wind ROS Wind Load and Climate Analysis of Adama Wereda Oromia Ethiopia
AU  - Mekuanint Tariku Guta
Y1  - 2026/08/11
PY  - 2026
N1  - https://doi.org/10.11648/j.ajbes.20261202.12
DO  - 10.11648/j.ajbes.20261202.12
T2  - American Journal of Biological and Environmental Statistics
JF  - American Journal of Biological and Environmental Statistics
JO  - American Journal of Biological and Environmental Statistics
SP  - 36
EP  - 42
PB  - Science Publishing Group
SN  - 2471-979X
UR  - https://doi.org/10.11648/j.ajbes.20261202.12
AB  - Climate change induced irregularities in amount and frequency of extreme temperature and precipitation events are likely to increase across the globe. Climate change has created a new challenge to hamper development process throughout the world. For this analysis meteorological daily rainfall station data in millimetre, maximum temperature and minimum temperature data in degreecentgrade, wind speed in meter per second and direction in degree data including historical period from 2025-1995 G. c was taken form Ethiopian Meteorology Institute for a study area of Adama wereda. Result indictes Climatological rainfall (long-term monthly average) in Adama wereda has raised pic in the month of July and August with amount of above 200 mm (two hundred mm). The average daily temperature reaches from 18°C to 24°C prevailed in Adama wereda of Oromia region Ethiopia. Extreme maximum temperature of Adama wereda was recorded 36.1°C and Extreme minimum temperature of Adama wereda was recorded 3.1°C. Wind Rose diagrams has displays for Adama wereda average wind speed for winter season mostly dominated from 4m/s to 7.5m/s and the wind direction in this season dominated to ENE (East North East) direction of in Adama wereda and Wind Rose diagrams has displays for Adama wereda average wind speed for Summer season mostly dominated from 3m/s to 7m/s and the wind direction in this season dominated to WSW (West South West) and SSW (south south west) direction of in Adama wereda. The wind load analaysis indicates for windward wall is 0.0112 km/m2 and for leeward is - 0.0048km/m2. This analysis of climate pattern and trends will have benefits for decision makers and strategy in the study area.
VL  - 12
IS  - 2
ER  -
Geography and Environmental Studies, College of Social Sciences and Humanities, Jimma, Ethiopia;Meteorology, Water Technology Institute, Arbaminch, Ethiopia; College of Civil Engineering and Architecture, Adama Science & Technology University, Adama, Ethiopia; Meteorological Forecasting and Early Warning Department, Ethiopia Meteorology Institute, Adis Ababa, Ethiopia
Guta, M. T. (2026). Wind ROS Wind Load and Climate Analysis of Adama Wereda Oromia Ethiopia. American Journal of Biological and Environmental Statistics, 12(2), 36-42. https://doi.org/10.11648/j.ajbes.20261202.12
Guta, M. T. Wind ROS Wind Load and Climate Analysis of Adama Wereda Oromia Ethiopia. Am. J. Biol. Environ. Stat.2026, 12(2), 36-42. doi: 10.11648/j.ajbes.20261202.12
Guta MT. Wind ROS Wind Load and Climate Analysis of Adama Wereda Oromia Ethiopia. Am J Biol Environ Stat. 2026;12(2):36-42. doi: 10.11648/j.ajbes.20261202.12
@article{10.11648/j.ajbes.20261202.12,
  author = {Mekuanint Tariku Guta},
  title = {Wind ROS Wind Load and Climate Analysis of Adama Wereda Oromia Ethiopia},
  journal = {American Journal of Biological and Environmental Statistics},
  volume = {12},
  number = {2},
  pages = {36-42},
  doi = {10.11648/j.ajbes.20261202.12},
  url = {https://doi.org/10.11648/j.ajbes.20261202.12},
  eprint = {https://article.sciencepublishinggroup.com/pdf/10.11648.j.ajbes.20261202.12},
  abstract = {Climate change induced irregularities in amount and frequency of extreme temperature and precipitation events are likely to increase across the globe. Climate change has created a new challenge to hamper development process throughout the world. For this analysis meteorological daily rainfall station data in millimetre, maximum temperature and minimum temperature data in degreecentgrade, wind speed in meter per second and direction in degree data including historical period from 2025-1995 G. c was taken form Ethiopian Meteorology Institute for a study area of Adama wereda. Result indictes Climatological rainfall (long-term monthly average) in Adama wereda has raised pic in the month of July and August with amount of above 200 mm (two hundred mm). The average daily temperature reaches from 18°C to 24°C prevailed in Adama wereda of Oromia region Ethiopia. Extreme maximum temperature of Adama wereda was recorded 36.1°C and Extreme minimum temperature of Adama wereda was recorded 3.1°C. Wind Rose diagrams has displays for Adama wereda average wind speed for winter season mostly dominated from 4m/s to 7.5m/s and the wind direction in this season dominated to ENE (East North East) direction of in Adama wereda and Wind Rose diagrams has displays for Adama wereda average wind speed for Summer season mostly dominated from 3m/s to 7m/s and the wind direction in this season dominated to WSW (West South West) and SSW (south south west) direction of in Adama wereda. The wind load analaysis indicates for windward wall is 0.0112 km/m2 and for leeward is - 0.0048km/m2. This analysis of climate pattern and trends will have benefits for decision makers and strategy in the study area.},
 year = {2026}
}
TY  - JOUR
T1  - Wind ROS Wind Load and Climate Analysis of Adama Wereda Oromia Ethiopia
AU  - Mekuanint Tariku Guta
Y1  - 2026/08/11
PY  - 2026
N1  - https://doi.org/10.11648/j.ajbes.20261202.12
DO  - 10.11648/j.ajbes.20261202.12
T2  - American Journal of Biological and Environmental Statistics
JF  - American Journal of Biological and Environmental Statistics
JO  - American Journal of Biological and Environmental Statistics
SP  - 36
EP  - 42
PB  - Science Publishing Group
SN  - 2471-979X
UR  - https://doi.org/10.11648/j.ajbes.20261202.12
AB  - Climate change induced irregularities in amount and frequency of extreme temperature and precipitation events are likely to increase across the globe. Climate change has created a new challenge to hamper development process throughout the world. For this analysis meteorological daily rainfall station data in millimetre, maximum temperature and minimum temperature data in degreecentgrade, wind speed in meter per second and direction in degree data including historical period from 2025-1995 G. c was taken form Ethiopian Meteorology Institute for a study area of Adama wereda. Result indictes Climatological rainfall (long-term monthly average) in Adama wereda has raised pic in the month of July and August with amount of above 200 mm (two hundred mm). The average daily temperature reaches from 18°C to 24°C prevailed in Adama wereda of Oromia region Ethiopia. Extreme maximum temperature of Adama wereda was recorded 36.1°C and Extreme minimum temperature of Adama wereda was recorded 3.1°C. Wind Rose diagrams has displays for Adama wereda average wind speed for winter season mostly dominated from 4m/s to 7.5m/s and the wind direction in this season dominated to ENE (East North East) direction of in Adama wereda and Wind Rose diagrams has displays for Adama wereda average wind speed for Summer season mostly dominated from 3m/s to 7m/s and the wind direction in this season dominated to WSW (West South West) and SSW (south south west) direction of in Adama wereda. The wind load analaysis indicates for windward wall is 0.0112 km/m2 and for leeward is - 0.0048km/m2. This analysis of climate pattern and trends will have benefits for decision makers and strategy in the study area.
VL  - 12
IS  - 2
ER  -




 Share This Article
 Twitter
 Linked In
 Facebook
 Copy
Copy Download