
During this last decade, urban flooding has become recurrent in Senegal, particularly in the city of Dakar. The causes are multiple and varied, with devastating impacts on population well-being and the urban environment. For sustainable and harmonious urban development, flood risk mapping should be integrated into urban planning policies. This study aims to map areas vulnerable to flooding at regional, departmental and communal scale, using Remote Sensing, Geography Information System (GIS) and Multicriteria Evolution Approach (MCEA). Twelve criteria layers were defined to identify flood-prone areas, including Rainfall, Elevation, Slope, Groundwater level, Soil type, Impervious surfaces, Land use/cover, Population density, Housing type and structure, Humid zones, Drainage density and Standard of living. A Weighted Linear Combination (WLC) technique was applied and adapted in this study to map flood vulnerability. The criteria were scored and weighted according to their relative importance, as defined by local experts. ArcGIS 10.1 software through its extension Weighted sum overlay tool, was used to aggregate criteria layers into three main indicators: “Socio-economic”, “Physical environment” and “Land use/cover”. The results indicate that approximately 60% of the Dakar urban area is highly vulnerable to flooding according to the "Physical environment" indicator, compared to 12% and 10% for the "Socioeconomic" and "Land use/cover indicators, respectively. Overall, the combination all indicators shows that about 50% of Dakar urban environment is vulnerable to flooding. This vulnerability mainly concerns the departments of Pikine, Guediawaye and Keur Massar, where more than 80% of areas are classified as highly vulnerable. At the municipal and departmental scales, vulnerability indices are higher (greater than 0.7) in these areas compared to the department of Dakar (0.37) and Rufisque (0.14). Validation of final flood vulnerability map was conducted by comparing the most vulnerable areas identified in this study with those severely affected by floods observed using Earth Observation Satellite (SPOT) imagery in September 2005 and 2009. The validation results show an overall accuracy approximately 0.95 and 0.90 for the two respective dates. Understanding the level of vulnerability of the Dakar urban environment, as well as the contribution of each factor, can serve as a decision-support tool for rational and localized management of flood-prone areas in the context of climate change.
| Published in | American Journal of Environmental Protection (Volume 15, Issue 4) |
| DOI | 10.11648/j.ajep.20261504.12 |
| Page(s) | 98-123 |
| Creative Commons |
This is an Open Access article, distributed under the terms of the Creative Commons Attribution 4.0 International License (http://creativecommons.org/licenses/by/4.0/), which permits unrestricted use, distribution and reproduction in any medium or format, provided the original work is properly cited. |
| Copyright |
Copyright © The Author(s), 2026. Published by Science Publishing Group |
Geography Information System (GIS), Remote Sensing, Multicriteria Evolution Approach (MCEA), Weighted Linear Combination (WLC), Flood Vulnerability, Dakar Urban Environment
Data | Types | Resolution | Format | Sources | |
|---|---|---|---|---|---|
1 | Rainfall | RS | 5km | Raster | [51] |
2 | Elevation | RS | 30m | Raster | [52] |
3 | Slope | RS | 30m | Raster | [52] |
4 | Groundwater level | GIS | -- | Vector | [47] |
5 | Soil types | GIS | -- | Vector | [46, 53] |
6 | Impervious surface | RS | 30m | Raster | [52] |
7 | Population density | Mapping | -- | Raster | [49, 50, 54] |
8 | Land use/cover | RS | 30 | Raster | [52] |
9 | Type and structure of habitat | Mapping | -- | Raster | [54, 55] |
10 | Humid zones | RS | 30m | Raster | [52] |
11 | Drainage density | RS | 30m | Raster | [52] |
12 | Standard of living | Mapping | -- | Raster | [48] |
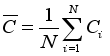 (1)
(1)  is the average of interannual cumulations; i is the cumulation in a given year and N is the series length.
 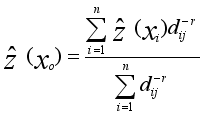 (2)
(2)  (3)
(3)  (4)
(4) 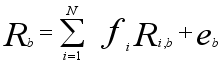 (5)
(5) 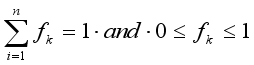 (6)
(6)  (7)
(7)  (8)
(8)  (9)
(9) 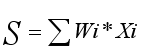 (10)
(10) A1 | A2 | A3 | … | An | Wi | |
|---|---|---|---|---|---|---|
∆1 | W1(∆1: A1) | W1(∆1: A2) | W1(∆1: A3) | … | W1(∆1: An) | ∑W1((∆1(A1,…An)))/N |
∆2 | W2(∆2: A1) | W2(∆2: A2) | W2(∆2: A3) | … | W2(∆2: An) | ∑W2((∆2(A1,…An)))/N |
∆3 | W1(∆3: A1) | W3(∆3: A2) | W3(∆3: A3) | … | W3(∆3: An) | ∑W3((∆3(A1,…An)))/N |
… | … | … | … | … | … | … |
∆n | Wn(∆n: A1) | Wn(∆n: A2) | Wn(∆n: A3) | … | Wn(∆n: An) | ∑Wn((∆n(A1,…An)))/N |
N | ∑W1,…n(A1) | ∑W1,…n(A2) | ∑W1,…n(A3) | … | ∑W1,…n(An) | ∑Wi=1 |
Factors or Criteria | Subclasses | Scores | Weight |
|---|---|---|---|
Population density | 200 - 5000 ht./km2 | 1 | 0.35 |
5000 - 15000 ht./km2 | 2 | ||
15000 - 30000 ht./km2 | 3 | ||
30000 - 50000 ht./km2 | 4 | ||
Above 50000 ht./km2 | 5 | ||
Structure and type of Habitat | Pericentre center and very well equipped | 1 | 0.41 |
Pericentre well equipped | 2 | ||
Suburbs near and far well-equipped means | 3 | ||
outer suburbs poorly equipped | 4 | ||
Suburban underequipped | 5 | ||
Standard of living | Easy category | 1 | 0.24 |
Middle class category | 2 | ||
Middle category | 3 | ||
Poor category | 4 | ||
Very poor category | 5 |
Factors or Criteria | Sub classes | Scores | Weight |
|---|---|---|---|
Rainfall | Below 350 mm/an | 2 | 0.11 |
400 - 350 mm/an | 3 | ||
Above 400 mm/an | 4 | ||
Elevation | Above 40% | 1 | 0.18 |
30 - 40% | 2 | ||
20 - 30% | 3 | ||
10 - 20% | 4 | ||
0 - 10% | 5 | ||
Ground Water level | Above 20 m | 1 | 0.14 |
15 - 20 m | 2 | ||
10 - 15 m | 3 | ||
5 - 10 m | 4 | ||
Below 5 | 5 | ||
Soil type | Tropical ferruginous soils | 1 | 0.12 |
Halomorphic soils | 3 | ||
Hydromorphic soils | 5 | ||
Slope | Above 30 | 2 | 0.17 |
20 - 30 | 3 | ||
10 - 20 | 4 | ||
0 - 10 | 5 | ||
Impervious surface | Below 40% | 3 | 0.15 |
40 - 70% | 4 | ||
Above 70% | 5 | ||
Drainage density | Above 0.0321 m/m2 | 2 | 0.13 |
0.0363 - 0.0321 m/m2 | 3 | ||
0.0425 - 0.0363 m/m2 | 4 | ||
Above 0.0425 m/m2 | 5 |
Factors | Subclasses | Scores | Weight |
|---|---|---|---|
Humid zones | Below 400 m | 1 | 0.63 |
300 - 400 m | 2 | ||
200 - 300 m | 3 | ||
100 - 200 m | 4 | ||
0 - 100 m | 5 | ||
Land use/cover | Water bodies | 1 | 0.37 |
Vegetation urban | 2 | ||
Crop land | 3 | ||
Bare soil | 4 | ||
Build areas | 5 |
Indicators | Weight |
|---|---|
Socioeconomic | 0,34 |
Physical environment | 0,41 |
Land use/cover | 0,25 |
Name of departments | Name of communes | Low | Moderate | High | Very high | Total | Vul. index |
|---|---|---|---|---|---|---|---|
Rufisque | Yene | 0,13 | 99,76 | 0,11 | 0 | 100 | 0,00 |
Sangalkam | 0 | 97,82 | 2,18 | 0 | 100 | 0,02 | |
Rufisque Nord | 0 | 33,93 | 66,07 | 0 | 100 | 0,66 | |
Rufisque Est | 0 | 42,56 | 57,44 | 0 | 100 | 0,57 | |
Rufisque Ouest | 0 | 85,58 | 14,42 | 0 | 100 | 0,14 | |
Tivaouane-Peulh/Niaga | 0 | 90,25 | 9,75 | 0 | 100 | 0,10 | |
Bambilor | 0 | 100 | 0 | 0 | 100 | 0,00 | |
Sebikhotane | 0 | 100 | 0 | 0 | 100 | 0,00 | |
Diamniadio | 0 | 100 | 0 | 0 | 100 | 0,00 | |
Bargny | 0 | 98,22 | 1,78 | 0 | 100 | 0,02 | |
Sendou | 0 | 100 | 0 | 0 | 100 | 0,00 | |
Dakar | Camberène | 0 | 0 | 100 | 0 | 100 | 1,00 |
Parcelles Assainies | 0 | 0,17 | 99,83 | 0 | 100 | 1,00 | |
Yoff | 19,73 | 66,41 | 13,86 | 0 | 100 | 0,14 | |
Ngor Ile | 0 | 100 | 0 | 0 | 100 | 0,00 | |
Ngor | 0 | 92,68 | 7,32 | 0 | 100 | 0,07 | |
Patte - d'Oie | 0 | 21,78 | 78,22 | 0 | 100 | 0,78 | |
Grand - Yoff | 9,37 | 45,55 | 45,09 | 0 | 100 | 0,45 | |
Dalifor - Foirail | 0 | 1,25 | 86,96 | 11,79 | 100 | 0,99 | |
Hann - Bel Air | 0 | 46,92 | 51,56 | 1,52 | 100 | 0,53 | |
Ouakam | 24,64 | 75,36 | 0 | 0 | 100 | 0,00 | |
Mermoz - Sacré -Coeur | 20,41 | 79,59 | 0 | 0 | 100 | 0,00 | |
HLM | 0 | 34,36 | 65,64 | 0 | 100 | 0,66 | |
Biscuiterie | 0 | 5,9 | 94,1 | 0 | 100 | 0,94 | |
Grand-Dakar | 0 | 44,5 | 55,5 | 0 | 100 | 0,56 | |
Fann - Point E - Amitié | 13,81 | 81,53 | 4,66 | 0 | 100 | 0,05 | |
Gueule tapée - Fass - Colobane | 0 | 84,16 | 15,84 | 0 | 100 | 0,16 | |
Médina | 0 | 85,21 | 14,79 | 0 | 100 | 0,15 | |
Dakar - Plateau | 6,94 | 88,59 | 4,47 | 0 | 100 | 0,04 | |
Gorée | 3,77 | 96,23 | 0 | 0 | 100 | 0,00 | |
SICAP - Liberté | 7,98 | 90,96 | 1,06 | 0 | 100 | 0,01 | |
Dieuppeul - Derklé | 0 | 76,5 | 23,5 | 0 | 100 | 0,24 | |
Guediawaye | Wakhinan - Nimzatt | 0 | 21,62 | 64,15 | 14,23 | 100 | 0,78 |
Ndiaréme - Limamoulaye | 0 | 28,74 | 71,21 | 0,05 | 100 | 0,71 | |
Sam Notaire | 0 | 13,38 | 78,18 | 8,44 | 100 | 0,87 | |
Golf Sud | 0 | 20,32 | 79,68 | 0 | 100 | 0,80 | |
Médina Gounass | 0 | 0 | 4,92 | 95,08 | 100 | 1,00 | |
Pikine | Djidah -Thiaroye Kaw | 0 | 0 | 29,56 | 70,44 | 100 | 1,00 |
Mbao | 0 | 51,62 | 45,41 | 2,97 | 100 | 0,48 | |
Pikine-Ouest | 0 | 0,03 | 95,09 | 4,88 | 100 | 1,00 | |
Pikine Nord | 0 | 0 | 76,21 | 23,79 | 100 | 1,00 | |
Diameguene - SICAP Mbao | 0 | 0,22 | 74,48 | 25,3 | 100 | 1,00 | |
Thiaroye gare | 0 | 0 | 93,61 | 6,39 | 100 | 1,00 | |
Pikine - Est | 0 | 0 | 83,98 | 16,02 | 100 | 1,00 | |
Guinaw rail Nord | 0 | 0 | 38,68 | 61,32 | 100 | 1,00 | |
Tivaouane - Diak Sao | 0 | 0 | 53,1 | 46,9 | 100 | 1,00 | |
Guinaw rail Sud | 0 | 0 | 17,03 | 82,97 | 100 | 1,00 | |
Thiaroye-sur-Mer | 0 | 1,52 | 63,12 | 35,36 | 100 | 0,98 | |
Keur Massar | Malika | 0 | 25,31 | 63,94 | 10,76 | 100 | 0,75 |
Keur Massar | 0 | 6,24 | 84,48 | 9,28 | 100 | 0,94 | |
Yeumbeul - Nord | 0 | 14,28 | 53,82 | 31,89 | 100 | 0,86 | |
Yeumbeul - Sud | 0 | 0 | 55,34 | 44,66 | 100 | 1,00 | |
Jaxaay-P. A-Niacoul RAB | 0 | 100 | 0 | 0 | 100 | 0,00 |
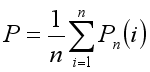 (11)
(11) Reference data in 2005 | ||||||
|---|---|---|---|---|---|---|
Vulnerable | No vulnerable | Total Row | Ind. Accuracy | Global accuracy | ||
Model | Vulnerable | 92 | 3 | 95 | 0,97 | 0,95 |
No vulnerable | 8 | 97 | 105 | 0,92 | ||
Total Col. | 100 | 100 | 200 | |||
Reference data in 2009 | ||||||
|---|---|---|---|---|---|---|
Vulnerable | No vulnerable | Total Row | Ind. accuracy | Global accuracy | ||
Model | Vulnerable | 89 | 9 | 98 | 0,91 | 0,90 |
No vulnerable | 11 | 91 | 102 | 0,89 | ||
Total Col. | 100 | 100 | 200 | |||
AHP | Analytic Hierarchy Process |
ACP | Principal Component Analysis |
ArcGIS | Geographic Information System Software |
CSE | Centre De Suivi Ecologique |
DEM | Digital Elevation Model |
DN | Digital Number |
DOS | Dark Object Subtraction |
GIS | Geographic Information System |
IDW | Inverse Distance Weighted |
ISE | Institute of Environmental Sciences |
LSMA | Linear Spectral Mixture Analysis |
MCEA | Multicriteria Evaluation Approach |
MNF | Maximum Noise Fraction |
NASA | National Aeronautics and Space Administration |
NDVI | Normalized Difference Vegetation Index |
WLC | Weighted Linear Combination |
OLI | Operational Land Imager |
ORSEC | Civil Security Response Organization |
OWA | Ordered Weighted Average |
PCA | Principal Component Analysis |
PDU | Urban Planning Master Plan |
SMA | Spatial Multi Criteria Analysis |
SPOT | Earth Observation Satellite |
SPSS | Statistical Package for the Social Sciences |
SRTM | Shuttle Radar Topography Mission |
TIN | Triangulated Irregular Network |
TIRS | Thermal Infrared Sensor |
TRMM | Tropical Rainfall Measuring Mission |
USGS | United States Geological Survey |
UTM | Universal Transverse Mercator |
WGS84 | World Geodetic System 1984 |
| [1] | Ologunorisa, E. T. An Assessment of Flood Vulnerability Zones in the Niger Delta, Nigeria. International Journal of Environmental Studies 2004. 61, 31-38. |
| [2] | Provitolo, D. Vulnerability to Mediterranean floods in urban areas: a new geographical approach. Anale de Géographie. 2007, 1, 23-40. |
| [3] | Clement, A. R. An Application of Geographic Information System in Mapping Flood Risk Zones in a North Central City in Nigeria. African Journal of Environmental Science and Technology, 2013, 7, 365-371. |
| [4] | Pelling, M. The Vulnerability of Cities: Natural Disasters and Social Resilience, Earthscan Publications, London, England, 2003. |
| [5] | Ouma, Y. O.; Tateishi, R. Urban Flood Vulnerability and Risk Mapping Using Integrated Multi-Parametric AHP and GIS: Methodological Overview and Case Study Assessment. Water 2014, 6, 1515-1545. |
| [6] | Thouret J. C., D'ercole R. Vulnerability to natural hazards in urban environments: effects, factors and social responses, Cah. Sci. Hum. 1996, 32, 407-422. |
| [7] | Leome F., Vinet F., Dir. The vulnerability of societies and territories to natural threats: Geographical analyses, Collection “Géorisques” n° 1; Publication of the Paul Valery University, Montpellier 3, 2006; pp. 1-71. |
| [8] | Jonkman, S. N. Global Perspectives on Loss of Human Life Caused by Floods. Natural Hazards, 2005, 34(2), 151-175. |
| [9] | Ezemonye, M. N. Flooding and Household Preparedness in Benin City, Nigeria. Mediterranean Journal of Social Sciences. 2014. 5, 547-553. |
| [10] | Kane, N. K. Flood management in Dakar region" Master's Thesis in Economics, Faculty of Economic Sciences and Management, Cheikh Anta Diop University, Dakar, Senegal, 2007. |
| [11] |
ADEPT. Floods in Dakar and suburbs: A better understanding of the causes for durable solutions. P. 67 2010.
http://www.iagu.org/PDF/inondations_banlieue_dakar.pdf (assess on 3 January 2017). |
| [12] | World Bank, and Global Facility for Disaster Reduction and Recovery (GFDRR). Vulnerability, risk reduction, and adaptation to climate change - Senegal. Washington, DC, USA. 2011. |
| [13] | Sané, O. D.; Gaye, A. T.; Diakhaté, M.; Aziadekey, M. Critical Factors of Vulnerability That Enable Medina Gounass (Dakar/Senegal) to Adapt against Seasonal Flood Events. Journal of Geographic Information System, 2016, 8, 457-469. |
| [14] | Ndiaye M. L. Detection of land cover changes and geomatic modeling using a multi-criteria assessment approach for mapping flood-vulnerable areas in the Dakar region. Master's thesis, Specialization: Remote Sensing and GIS, African Regional Centre for Space Science and Technology in French (CRASTE_LF) and Mouhamed 5 University, Rabat, Morocco. P. 139, 2015. |
| [15] | Global Facility for Disaster Reduction and Recovery (GFDRR). Senegal: Urban Floods, Recovery and Reconstruction from 2009 Onwards, Case Study for the Post-Disaster Recovery Framework. Final Report, Senegal. p. 27, 2014. (In French). |
| [16] | Stormwater Management Project (PROGEP). Study of the stormwater drainage master plan for the peri-urban region of Dakar, Municipal Development Agency, p. 72. 2011. |
| [17] | National Agency for Statistics and Demography (ANSD). Economic and social situation in Senegal in 2009. Final report, p. 19, 2010. |
| [18] | Diongue M. Urban periphery and flood risks in Dakar, Senegal: the case of Yeumbeul Nord, ESO, Works and documents, no. 37, June 2014. |
| [19] | Sané, O. D.; Gaye, A. T.; Diakhaté, M.; Aziadekey, M. Social Vulnerability Assessment to Flood in Medina Gounass Dakar. Journal of Geographic Information System, 2015. 7, 415-429. |
| [20] | Rimba, A. B.; Setiawati M. D.; Sambah, A. B.; Miura, F. Physical Flood Vulnerability Mapping Applying Geospatial Techniques in Okazaki City, Aichi Prefecture, Japan. Urban Sci. 2017, 1(7), 1-22. |
| [21] | Mbow, C.; Diop, A.; Diaw, A. T.; Niang, C. I. Urban Sprawl Development and Flooding at Yeumbeul Suburb (Dakar, Senegal)”, African Journal of Environmental Science and Technology. 2008, 2(4), 75-88. |
| [22] | Wade, S.; Faye, S.; Dieng, M., Kaba, M.; Kane, N-R. Remote sensing of urban flood disasters: the case of Dakar region (Senegal), AUF Scientific Animation Days, Alger, Algeria, November 2009. |
| [23] | Diop, A.; Niang, C. I.; Mbow, C.; Diallo, A. D. Study of the vulnerability of Thiaroye-sur-Mer to flooding: Factors and consequences, New Series Links, n° 18 December 2014. |
| [24] | Viviana, P. ; Daniele ,R. Spatial Analysis of Flood Exposure and Vulnerability for Planning More Equal Mitigation Actions, Sustainability. 2023. 15(10), 57-79 |
| [25] | Ollierou, R.; Quantinet, B. Vulnerability a notion of the future, Ecole Nationale Supérieure des Mines, Saint-Etienne, p. 55. 2004. |
| [26] | PDU, Urban Planning Master Plan "horizon 2015" p. 243. 2003. |
| [27] |
Aguiar, L. A. Impact of recent climate variability on the ecosystems of the Niayes region of Senegal between 1950 and 2004, Ph.D. Thesis in Environmental Sciences, University of Quebec at Montreal, 2009.
http://www.geotop.ca/pdf/Gestion_Documents/Theses/These_Lazar_Aguiar.pdf |
| [28] | Graillot, D.; Londiche, H.; Dechomets, R.; Batton-Hubert, M. Multi-criteria spatial analysis for identification of vulnerability to flooding. Ecole Normale Supérieure des Mines de Saint Etienne, France, 2001; p. 17. |
| [29] | Barroca, B.; Pottier, N.; Lefort, E. Analysis and assessment of flood vulnerability in the downstream barley basin. Seventh Workshop of Théo As of January. 2005. |
| [30] | Saaty, T. L. Decision making with the Analytic Hierarchy Process, Int. J. Services Sciences. 2008. 1(1). 83-98. |
| [31] | Malczewski, J. Weighted Linear Combination Method in GIS: Common and Best Practice Approaches. Transactions in GIS. 2000. 4(1), 5-22. |
| [32] | Jiang, H.; Esatman J. R. Applications of fuzzy measures in multi-criteria evaluation in GIS. Int. J. of Geographical Information Science, 2000. 14(2), 173-184. |
| [33] | Ishaya, S. Mapping flood vulnerable areas in a developing urban center of Nigeria. Journal of Sustainable Development in Africa, 2009, 11(4).180-194. |
| [34] | Carlin, N. Geospatial Mapping Analysis of Flood Hazard Levels in Ajeokuta, Nigeria. Journal of Environmental Sciences. 2011. 4, 28-39. |
| [35] | Taubenbook H.; Wurm, M.; Netzband, M.; Zwenzner, H.; Roth, A.; Rahman A.; Dech, S. Flood Areas-Multi-Sensoral Approaches Using Remotely Sensed Data for Risk Assessment. Natural Hazards and Earth System Sciences, 2011. 11(2), 431-444. |
| [36] | Olajuyigbe E. A. Mapping and Analysis of 2012 Flood Disaster in Edo State Using Geospatial Technic. Journal of Environmental sciences, 2012. 6(2), 32-44. |
| [37] | Nkeki, F-N.; Henje, P-J.; Ojeh, V. N. Geospatial Techniques for the Assessment and Analysis of Flood Risk along the Niger-Benue Basin in Nigeria, Journal of Geographic Information System, 2013, 5(2), 123-135. |
| [38] | Malczewski, J. GIS-Based Land-Use Suitability Analysis: A Critical Overview on Research Gate, The professional network for scientists, 2004, 62(1), 3-65. |
| [39] | Carter, B.; Rinner, C. Locally weighted linear combination in a vector geographic information system. J. Geogr Syst, 2014, 16(3). 343-361. |
| [40] | Diouf, R.; Ndiaye, M. L.; Traore, V. B.; Sambou, H.; Giovani, M.; Lo, Y.; Sambou, B.; Diaw, A. T. Beye, A. C. Multi Criteria Evaluation Approach Based on Remote Sensing and GIS for Identification of Suitable Areas to the Implantation of Retention Basins and Artificial Lakes in Senegal. American Journal of Geographic Information System, 2017, 6, 1-13. |
| [41] | Al-Hanbali, A.; Alsaaideh, B.; Kondoh, A. Using GIS-Based Weighted Linear Combination Analysis and Remote Sensing Techniques to Select Optimum Solid Waste Disposal Sites within Mafraq City, Jordan. Journal of Geographic Information System, 2011. 3(4), 267-278. |
| [42] | Pereira, J. M. C.; Duckstein, L. A. Multiple Criteria Decision Making Approach to GIS-Based Land Suitability Evaluation, International Journal of Geographical Information Systems, 1993, 7(5), 407-424. |
| [43] | National Agency for Statistics and Demography (ANSD). (2025). Situation Économique et Sociale de la région de Dakar 2022-2023. Dakar, Sénégal. |
| [44] | Dasylva, S.; Cosandey, C. Exploitation of the Quaternary sands water table for the supply of drinking water in Dakar: an offer compromised by the inadequate rainfall recharge. Géocarrefour. 2006. 80(4), 349-358. |
| [45] | Diop, C.; Sagna, P. Climate Vulnerability of Neighborhoods in Dakar, Senegal: Examples of Nord-FoireAzur and Hann-Maristes. Strengthening Urban Resilience to Climate Change: From Spatial Diagnosis to Adaptation Measures, Paul Sabatier University Verlaine, Metz. Metz, France, 2011. (In French). |
| [46] | Michel P.; Sall, M. M. Atlas of Senegal, J. A. Edition, Paris, p. 74. 1984. |
| [47] | UNEP / UNESCO / UN-HABITAT / ECA. Surface aquifer and urban pollution in West Africa, Progress report of Senegal, p. 39. 2003. |
| [48] | Borderon M.; Oliveau, S.; Machault, V.; Vignolles, C.; Lacaux, J. P.; Ndonky, A. Qualifying urban spaces in Dakar, Senegal: Preliminary results of the cross-approach between remote sensing and spatialized census data, Cybergeo: European Journal of Geography, 2014, 1-16. |
| [49] | Lombard J. Private stakes in public transport in Abidjan and Dakar. Géocarrefour, 2006, 81(2), 167-174. |
| [50] | ACS. Urban Development Strategy for Grand-Dakar (2025)”, Cities Alliances, UN-HABITAT, Republic of Senegal, p. 74. 2010. |
| [51] |
The Tropical Rainfall Measuring Mission (TRMM). NASA Homepage. Available online:
https://trmm.gsfc.nasa.gov/ (accessed on 21 December 2025). |
| [52] |
USGS. USGS Home page. Available online:
https://earthexplorer.usgs.gov/ (accessed on 15 January 2017). |
| [53] | Charreau, C. I.; Fauck, R. The soils of Senegal. Part Two. ORSTOM Documentary Collection. No. 29248. Reference: B. p. 45. |
| [54] | ANSD. General Population and Housing Census, Housing and Agriculture - (2013), Final National Report. p. 19. 2006. |
| [55] | Lessault D.; Imbert, C. Residential mobility and recent dynamics of urban settlement in Dakar (Senegal), European Journal of Geography. 2013. |
| [56] | Meijerink, A. M. J.; Lieshout, A. M. Comparison of approaches for erosion modeling using flow accumulation with GIS. Hydro GIS 96: Application of Geographic Information Systems in Hydrology and Water Resources Management. Proceedings of the Vienna Conference, IAH S Publ. no. 235, April 1996. |
| [57] | Tachikawa, T.; Kaku, M.; Iwasaki, A.; Gesch, D.; Oimoen, M.; Zhang, Z.; Danielson, J.; Krieger, T.; Curtis, B.; Haase, J.; Abrams, M.; Crippen, R.; Carabajal, C. ASTER Global Digital Elevation Model Version 2 summary of Validation Results, The NASA Land Processes Distributed Active Archive Center and the Joint Japan-US ASTER Science Team, 2011. |
| [58] | Nagarajan, R.; Mukherjee, A.; Roy, A.; Khire, M. V. Temporal remote sensing data and GIS application in landslide hazard zonation of part of Western Ghat, India. International Journal of Remote Sensing, 1998, 19, 573-585. |
| [59] | Vijith, H.; Rejith, P. G.; Madhu, G. Using InfoVal Method and GIS Techniques for the Spatial Modelling of Landslide Susceptibility in the Upper Catchment of River Meenachil in Kerala. J. Indian Soc. Remote Sens. 2009, 37(2), 241-250. |
| [60] | Dakar Regional Council (CRD). What synergies can be achieved in the face of flooding in the Dakar Region?, Research-Action Seminar Report, Dakar, Senegal, 2011; p. 56. |
| [61] | Diop, A.; Ndiaye, M. L.; Sambou, H.; Dacosta, H.; Sambou, B. Integrated a GIS and Multicriteria Evaluation approach for Mapping Flood Vulnerability of Buildings in the Grande Niaye Watershed of Dakar, Senegal. American Journal of Geographic Information System, 2017, 6(2), 41-53. |
| [62] | Burrough, P. A.; McDonnell, R. A. Principles of Geographical Information Systems. OXFORD University Press. 1998. |
| [63] | Mokarram, M.; Hojati, M. Using Ordered Weight Averaging (OWA) for multicriteria soil fertility evaluation by GIS (Case study: Southeast Iran). Solid Earth Discuss. 2016, 17, 1-26. |
| [64] | Anctionaide International. Climate change, urban flooding and the rights of the urban poor in Africa. Key findings from six African cities. p. 8. 2006. |
| [65] | Chander G.; Markham B. L.; Helder D. L. Summary of current radiometric calibration coefficients for Landsat MSS, TM, ETM+, and EO-1 ALI sensors”, Remote Sensing of Environment. 2009, 113(5), 893-903. |
| [66] | Paolini, L.; Grings, F.; Sobrino, J. A.; Jiménez Muñoz, J. C.; Karszenbaum, H. Radiometric correction effects in Landsat multi-date/multi-sensor change detection studies. Int. J. Remote Sens. 2006, 27(4), 685-704. |
| [67] | Caloz R.; Collet, C. Digital Image Processing of Remote Sensing, A Concise Guide to Remote Sensing - Volume 3, Presses de l’Université du Québec, 398 pages. 2001. D1145, ISBN 978-2-7605-1145-3. |
| [68] | Phinn, S.; Stanford, M.; Scarth, P., Murray, A. T.; Shyy, P. T. Monitoring the composition of urban environment based on the vegetation-impervious surface-soil (VIS) model by subpixel analysis techniques. International Journal of Remote Sensing, 2002, 23(20), 4131-4153. |
| [69] | Chester, L.; Arnold, Jr.; James Gibbons C. Impervious Surface Coverage: The Emergence of a Key Environmental Indicator, Journal of the American Planning Association, 1996, 62, 243-258. |
| [70] | Deng, Y.; Fan, F.; Chen, R. Extraction and Analysis of Impervious Surfaces Based on a Spectral Un-Mixing Method Using Pearl River Delta of China Landsat TM/ETM+ Imagery from 1998 to 2008. Sensors, 2012, 12(2), 1846-1862. |
| [71] | Rashed, T., Weeks, J. R., & Gadalla, M. S. Revealing the anatomy of cities through spectral mixture analysis of multispectral satellite imagery: a case study of the greater Cairo region, Egypt. Geocarto International, 2001, 16(4), 5-15. |
| [72] | Green, A. A.; Berman, M.; Switzer, P.; Craig, M. D. A transformation for ordering multispectral data in terms of image quality with implications for noise removal. IEEE Transactions on Geoscience and Remote Sensing, 1988, 26, 65-74. |
| [73] | Wu, C.; Murray, A. T. Estimating impervious surface distribution by spectral mixture analysis. Remote Sensing of Environment, 2003, 84(4), 493-505. |
| [74] | ANSD. Results of the third general census of population and housing 2002, National presentation report, Republic of Senegal, 123 p. 2006. |
| [75] | Kelson, K. I.; Wells, S. G. Geologic influence on fluvial hydrology and bedload transport in small mountainous watershed, northern New Mexico, USA. Earth Surface Processes Landforms, 1989, 14, 671-690. |
| [76] | Reddy, G. P. O.; Maji, A. K.; Gajbhiye, K. S. Drainage morphometry and its influence on landform characteristics in a basaltic terrain, Central India - A Remote Sensing and GIS approach”. Applied Earth Observation and Geoinformation, 2004, 6, 1-16. |
| [77] | European Commission. Directive 2007/60/EC of the European Parliament and of the Council of 23 October 2007 on the assessment and management of flood risks. 2007. |
| [78] | Schanze, J.; Zeman, E.; Marsalek, J. Flood Risk Management: Hazards, Vulnerability and Mitigation Measures; Springer: Berlin, Germany, 2006. |
| [79] | Alfieri, L.; Feyen, L.; Dottori, F.; Bianchi, A. Ensemble flood risk assessment in Europe under high end climate scenarios. Global Environmental Change, 2015, 35, 199-212. |
| [80] | Sambah, A. B.; Miura, F.; Integration of Spatial Analysis for Tsunami Inundation and Impact Assessment. Journal of Geographic Information System, 2014, 6(1), 11-22. |
| [81] | Malczcewski, J. GIS and multicriteria decision analysis. Department of geography, University of Western Ontario. John Wiley & Sons, New York, 363 p. 1999. |
APA Style
Ndiaye, M. L., Traore, V. B., Sambou, H., Diaw, A. T. (2026). Flood Vulnerability Assessment Using Geoinformation Data and Multicriteria Evolution Approach in Dakar Urban Environment, Senegal. American Journal of Environmental Protection, 15(4), 98-123. https://doi.org/10.11648/j.ajep.20261504.12
ACS Style
Ndiaye, M. L.; Traore, V. B.; Sambou, H.; Diaw, A. T. Flood Vulnerability Assessment Using Geoinformation Data and Multicriteria Evolution Approach in Dakar Urban Environment, Senegal. Am. J. Environ. Prot. 2026, 15(4), 98-123. doi: 10.11648/j.ajep.20261504.12
@article{10.11648/j.ajep.20261504.12,
  author = {Mamadou Lamine Ndiaye and Vieux Boukhaly Traore and Hyacinthe Sambou and Amadou Tahirou Diaw},
  title = {Flood Vulnerability Assessment Using Geoinformation Data and Multicriteria Evolution Approach in Dakar Urban Environment, Senegal},
  journal = {American Journal of Environmental Protection},
  volume = {15},
  number = {4},
  pages = {98-123},
  doi = {10.11648/j.ajep.20261504.12},
  url = {https://doi.org/10.11648/j.ajep.20261504.12},
  eprint = {https://article.sciencepublishinggroup.com/pdf/10.11648.j.ajep.20261504.12},
  abstract = {During this last decade, urban flooding has become recurrent in Senegal, particularly in the city of Dakar. The causes are multiple and varied, with devastating impacts on population well-being and the urban environment. For sustainable and harmonious urban development, flood risk mapping should be integrated into urban planning policies. This study aims to map areas vulnerable to flooding at regional, departmental and communal scale, using Remote Sensing, Geography Information System (GIS) and Multicriteria Evolution Approach (MCEA). Twelve criteria layers were defined to identify flood-prone areas, including Rainfall, Elevation, Slope, Groundwater level, Soil type, Impervious surfaces, Land use/cover, Population density, Housing type and structure, Humid zones, Drainage density and Standard of living. A Weighted Linear Combination (WLC) technique was applied and adapted in this study to map flood vulnerability. The criteria were scored and weighted according to their relative importance, as defined by local experts. ArcGIS 10.1 software through its extension Weighted sum overlay tool, was used to aggregate criteria layers into three main indicators: “Socio-economic”, “Physical environment” and “Land use/cover”. The results indicate that approximately 60% of the Dakar urban area is highly vulnerable to flooding according to the "Physical environment" indicator, compared to 12% and 10% for the "Socioeconomic" and "Land use/cover indicators, respectively. Overall, the combination all indicators shows that about 50% of Dakar urban environment is vulnerable to flooding. This vulnerability mainly concerns the departments of Pikine, Guediawaye and Keur Massar, where more than 80% of areas are classified as highly vulnerable. At the municipal and departmental scales, vulnerability indices are higher (greater than 0.7) in these areas compared to the department of Dakar (0.37) and Rufisque (0.14). Validation of final flood vulnerability map was conducted by comparing the most vulnerable areas identified in this study with those severely affected by floods observed using Earth Observation Satellite (SPOT) imagery in September 2005 and 2009. The validation results show an overall accuracy approximately 0.95 and 0.90 for the two respective dates. Understanding the level of vulnerability of the Dakar urban environment, as well as the contribution of each factor, can serve as a decision-support tool for rational and localized management of flood-prone areas in the context of climate change.},
 year = {2026}
}
TY  - JOUR
T1  - Flood Vulnerability Assessment Using Geoinformation Data and Multicriteria Evolution Approach in Dakar Urban Environment, Senegal
AU  - Mamadou Lamine Ndiaye
AU  - Vieux Boukhaly Traore
AU  - Hyacinthe Sambou
AU  - Amadou Tahirou Diaw
Y1  - 2026/08/06
PY  - 2026
N1  - https://doi.org/10.11648/j.ajep.20261504.12
DO  - 10.11648/j.ajep.20261504.12
T2  - American Journal of Environmental Protection
JF  - American Journal of Environmental Protection
JO  - American Journal of Environmental Protection
SP  - 98
EP  - 123
PB  - Science Publishing Group
SN  - 2328-5699
UR  - https://doi.org/10.11648/j.ajep.20261504.12
AB  - During this last decade, urban flooding has become recurrent in Senegal, particularly in the city of Dakar. The causes are multiple and varied, with devastating impacts on population well-being and the urban environment. For sustainable and harmonious urban development, flood risk mapping should be integrated into urban planning policies. This study aims to map areas vulnerable to flooding at regional, departmental and communal scale, using Remote Sensing, Geography Information System (GIS) and Multicriteria Evolution Approach (MCEA). Twelve criteria layers were defined to identify flood-prone areas, including Rainfall, Elevation, Slope, Groundwater level, Soil type, Impervious surfaces, Land use/cover, Population density, Housing type and structure, Humid zones, Drainage density and Standard of living. A Weighted Linear Combination (WLC) technique was applied and adapted in this study to map flood vulnerability. The criteria were scored and weighted according to their relative importance, as defined by local experts. ArcGIS 10.1 software through its extension Weighted sum overlay tool, was used to aggregate criteria layers into three main indicators: “Socio-economic”, “Physical environment” and “Land use/cover”. The results indicate that approximately 60% of the Dakar urban area is highly vulnerable to flooding according to the "Physical environment" indicator, compared to 12% and 10% for the "Socioeconomic" and "Land use/cover indicators, respectively. Overall, the combination all indicators shows that about 50% of Dakar urban environment is vulnerable to flooding. This vulnerability mainly concerns the departments of Pikine, Guediawaye and Keur Massar, where more than 80% of areas are classified as highly vulnerable. At the municipal and departmental scales, vulnerability indices are higher (greater than 0.7) in these areas compared to the department of Dakar (0.37) and Rufisque (0.14). Validation of final flood vulnerability map was conducted by comparing the most vulnerable areas identified in this study with those severely affected by floods observed using Earth Observation Satellite (SPOT) imagery in September 2005 and 2009. The validation results show an overall accuracy approximately 0.95 and 0.90 for the two respective dates. Understanding the level of vulnerability of the Dakar urban environment, as well as the contribution of each factor, can serve as a decision-support tool for rational and localized management of flood-prone areas in the context of climate change.
VL  - 15
IS  - 4
ER  -
Ecological Monitoring Center (CSE), Ministry of the Environment and Ecological Transition, Dakar, Senegal
Department of Physics, Cheikh Anta DIOP University, Dakar, Senegal
Institut des Sciences de l’environnement (ISE), Cheikh Anta DIOP University, Dakar, Senegal
Department of Geography, Cheikh Anta DIOP University, Dakar, Senegal
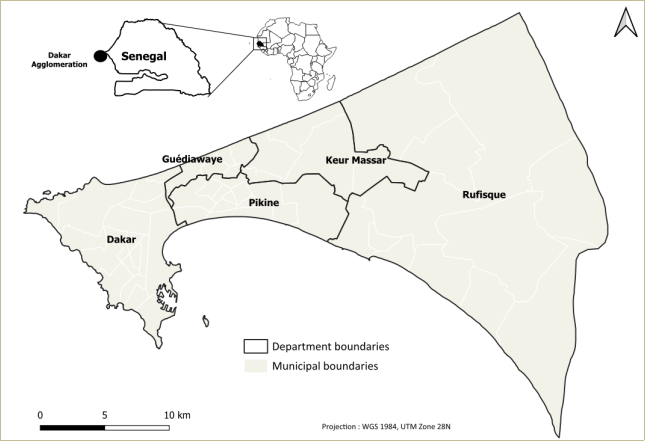
Figure 1. Location and extent of Dakar region, Senegal, Africa. On this map are also represented the limits of the departments and communes.
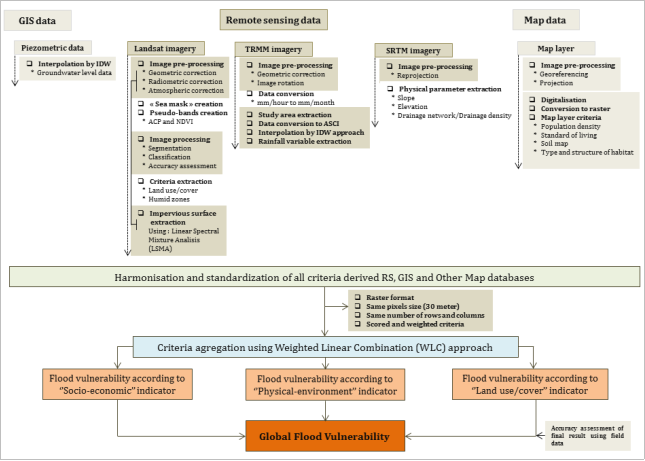
Figure 2. Flow chart showing the integration of Remotely-Sensed, GIS, Mapping data, and spatial multi-criteria analysis for mapping areas vulnerable to flooding in Dakar urban environment.
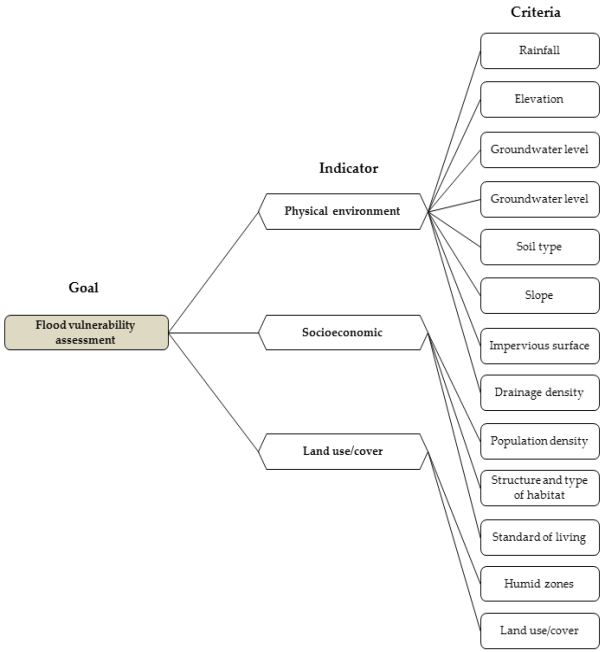
Figure 3. Flood vulnerability analysis hierarchy. This figure show that vulnerability is evaluated in a first time according to the three vulnerability indicators (Physical environment, Socioeconomic and Land use/cover) relating to environment urban of Dakar region. And the aggregation of indicator attributes gives global vulnerability at Dakar scale.
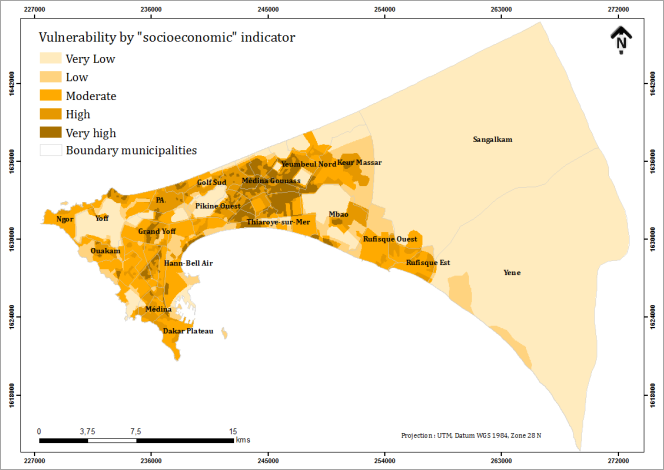
Figure 4. Vulnerability map according to the "Socioeconomic" indicator.
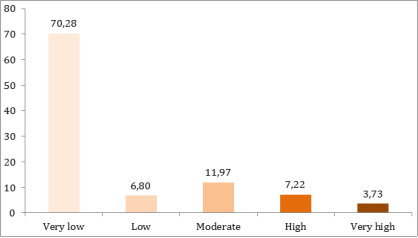
Figure 5. Proportion of vulnerability level according to the socioeconomic indicator.
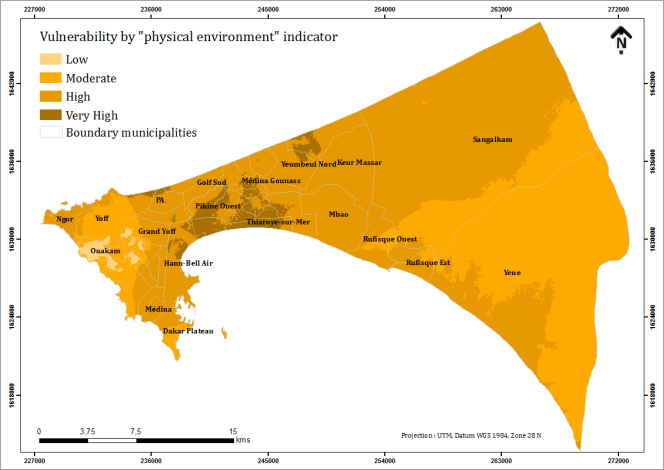
Figure 6. Vulnerability map according to the "Physical environment.
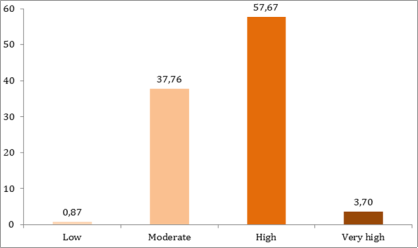
Figure 7. Proportion of vulnerability level according to the "Physical environment".
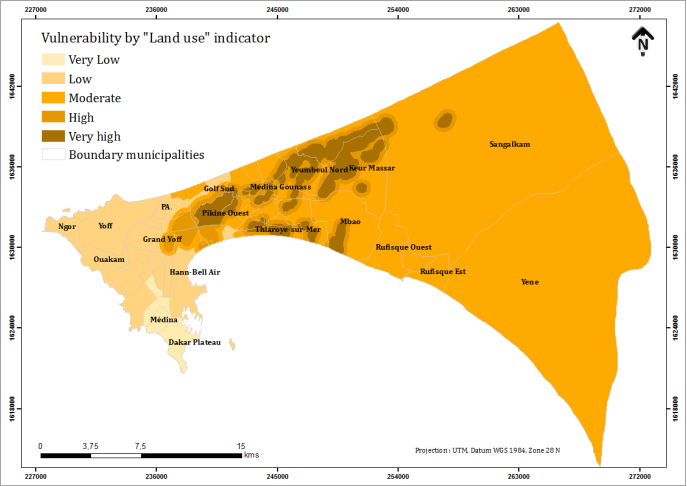
Figure 8. Vulnerability map according to the indicator "Land use/cover”.
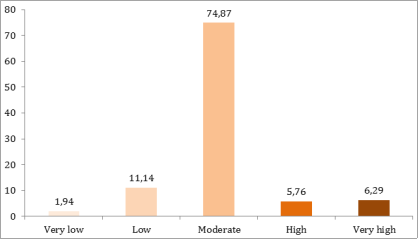
Figure 9. Vulnerability level according to the indicator "Land use/cover".
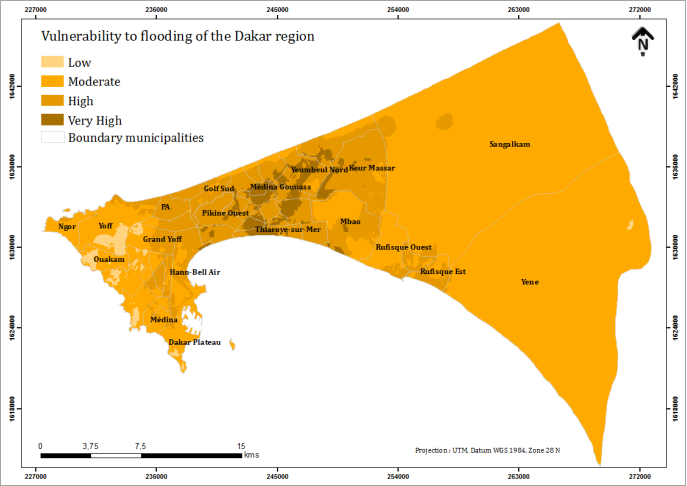
Figure 10. Final map of flood vulnerability.
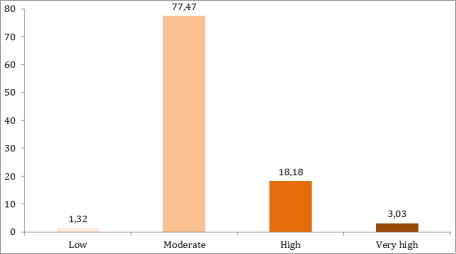
Figure 11. Global vulnerability at regional scale.
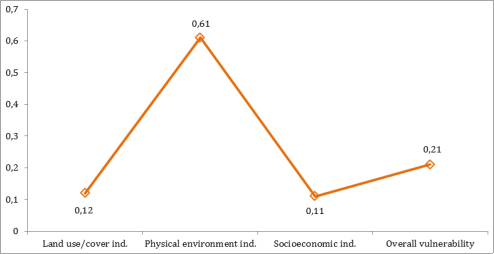
Figure 12. VUlnerability Index at regional scale.
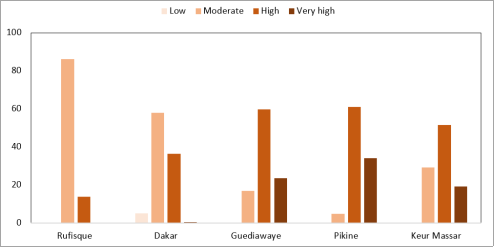
Figure 13. Vulnerability at departmental scale.
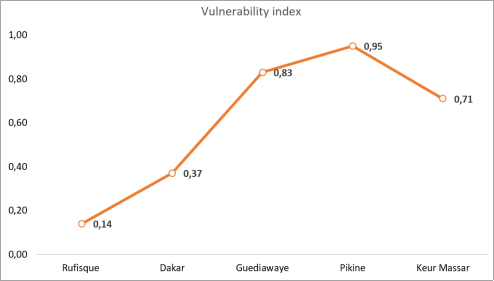
Figure 14. Vulnerability index at departmental scale.
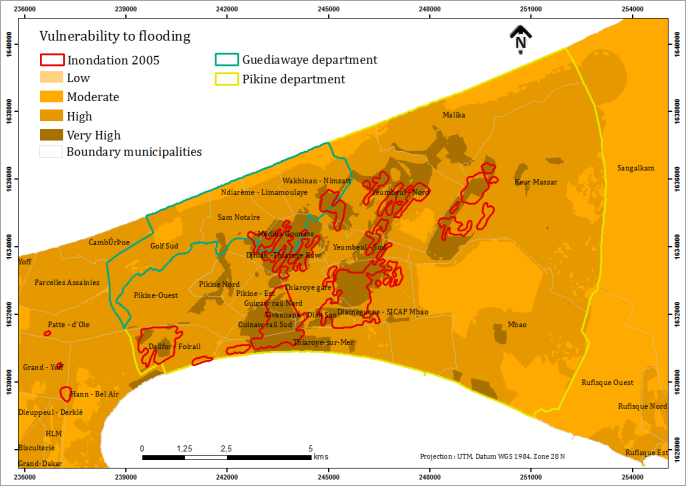
Figure 15. Correspondence map between vulnerable areas and flooded areas in 2005.
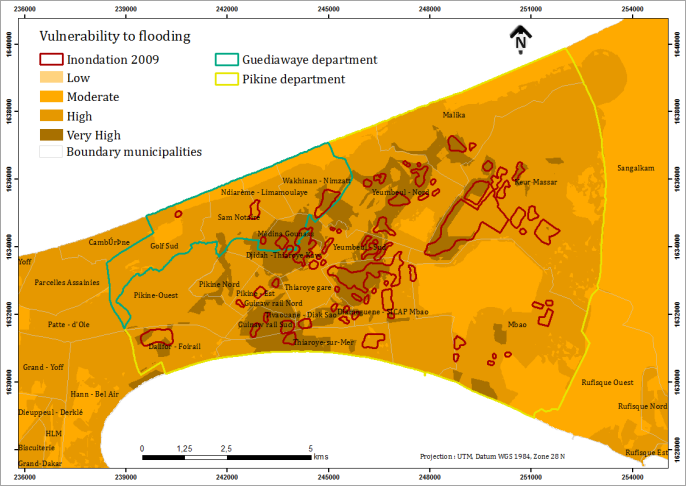
Figure 16. Correspondence map between vulnerable areas and flooded areas in 2009.
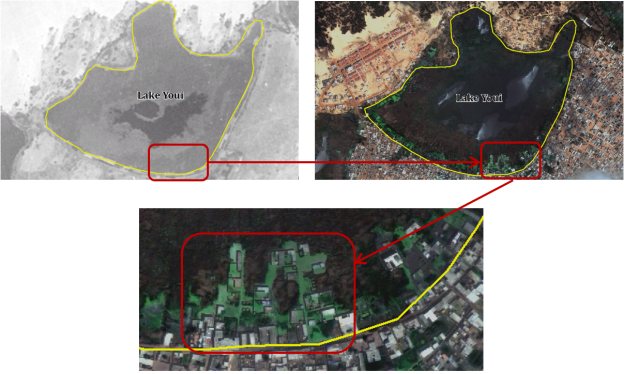
Figure 17. Overview of buildings erected within the limits of Lake Youi, today under the waters. The image on the left is taken from an aerial photo taken on April 4, 1942 by USGS and the one on the right is from a Pleiades source acquired in 2014.
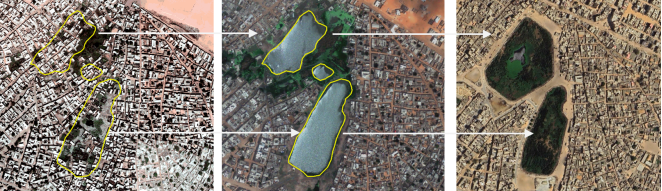
Figure 18. Overview of buildings in 2003 (left image), converted to water bodies in 2014 (middle image) and converted into stormwater retention basins actually in 2026 (right image). The source of these images is QuickBird 2003, Pleiades 2014 and Airbus 2026.

Information



 Share This Article
 Twitter
 Linked In
 Facebook
 Copy
Copy Download