Research Article | | Peer-Reviewed

Volatile Organic Compounds from the Oil and Gas Extraction and Processing: Emission Characteristics, Monitoring Technologies, Control Technologies, and Environmental and Health Impacts

Received: 10 June 2026     Accepted: 14 July 2026     Published: 13 August 2026
Views:       Downloads:
Abstract

Volatile organic compounds (VOCs) emitted from the oil and gas extraction and processing industry constitute a major fraction of global anthropogenic VOC releases, with significant implications for tropospheric ozone formation, secondary organic aerosol production, and population-level health risks. This review adopts a source-monitoring-control-impact four-dimensional analytical framework to systematically evaluate the current state of research spanning the full petroleum industrial chain. The analysis reveals a progressive compositional shift in emission profiles, from alkane-dominated fugitive releases in upstream extraction to aromatic- and olefin-rich process emissions in midstream refining, culminating in evaporative losses during downstream storage and transport. A persistent discrepancy exists between bottom-up emission inventories and top-down flux measurements, with fugitive sources systematically underestimated by factors of two to five. The three-tier monitoring hierarchy of offline speciation, online continuous monitoring, and satellite- and UAV-based remote sensing provides complementary spatial and temporal coverage, yet cross-tier data integration remains underdeveloped, limiting the realization of unified emission estimates. Control strategies follow a three-stage hierarchy in which source reduction and process optimization deliver substantially greater emission reduction per unit cost than end-of-pipe treatment alone, although condensation-adsorption-catalytic oxidation remains the mainstream refinery exhaust treatment configuration. Health risk assessments consistently identify benzene-driven incremental lifetime cancer risk exceeding regulatory benchmarks in fenceline communities, while secondary pollution from ozone and aerosol formation extends impacts hundreds of kilometers downwind. To shift from reactive compliance to proactive VOC management, interconnected areas must be prioritized: artificial intelligence powered operational multi-platform emission inventories, unified VOC-greenhouse gas surveillance networks, intelligent closed-loop process control, pilot-scale synergistic abatement technologies, integrated co-control policies that jointly reduce VOCs and methane, and prospective cohort studies with biomarker-based exposure assessment.

Published in American Journal of Environmental Science and Engineering (Volume 10, Issue 3)
DOI 10.11648/j.ajese.20261003.12
Page(s) 82-92
Creative Commons

This is an Open Access article, distributed under the terms of the Creative Commons Attribution 4.0 International License (http://creativecommons.org/licenses/by/4.0/), which permits unrestricted use, distribution and reproduction in any medium or format, provided the original work is properly cited.

Copyright

Copyright © The Author(s), 2026. Published by Science Publishing Group

Keywords

VOCs, Oil and Gas Industry, Emission Inventory, Fenceline Monitoring, Catalytic Oxidation, Health Risk Assessment

1. Introduction
Volatile organic compounds (VOCs) encompass a chemically heterogeneous class of carbon-based substances characterized by vapor pressures sufficient to produce significant gas-phase concentrations under ambient conditions, including alkanes, alkenes, aromatic hydrocarbons, oxygenated organics, and halogenated species . The oil and gas extraction and processing industry—spanning upstream drilling and extraction, midstream refining and petrochemical conversion, and downstream storage, transport, and distribution—is among the largest anthropogenic VOC source sectors globally, contributing an estimated 15 to 25 percent of total anthropogenic non-methane VOC emissions depending on regional industrial intensity and regulatory context .
The environmental and public health significance of petroleum-industry VOC emissions arises from three interconnected mechanisms. First, VOCs function as critical precursors to tropospheric ozone formation through photochemical reactions with nitrogen oxides (NOx), with C3-C6 alkenes and C7-C9 aromatics exhibiting disproportionately high ozone formation potential (OFP) relative to their emitted mass . Second, the atmospheric oxidation of aromatic VOCs yields secondary organic aerosol (SOA), contributing to regional PM2.5 loadings that degrade visibility and produce adverse respiratory outcomes . Third, several petroleum-associated VOCs—most notably benzene and 1, 3-butadiene—are established human carcinogens, with fenceline monitoring studies documenting incremental lifetime cancer risk (ILCR) values exceeding 1 10-6 in communities adjacent to refining and extraction facilities .
Research activity has accelerated over the past decade, with a threefold increase in annual publication volume between 2015 and 2023 across atmospheric chemistry, environmental engineering, toxicology, and policy analysis . Methodological advances have been pronounced in fast-response online mass spectrometry for real-time fenceline monitoring , satellite-based spectroscopic instruments for basin-scale emission quantification , and advanced porous adsorbents and oxygen-vacancy-engineered catalysts for VOC removal . However, the rapid expansion of primary literature has not been matched by integration across traditionally siloed research domains.
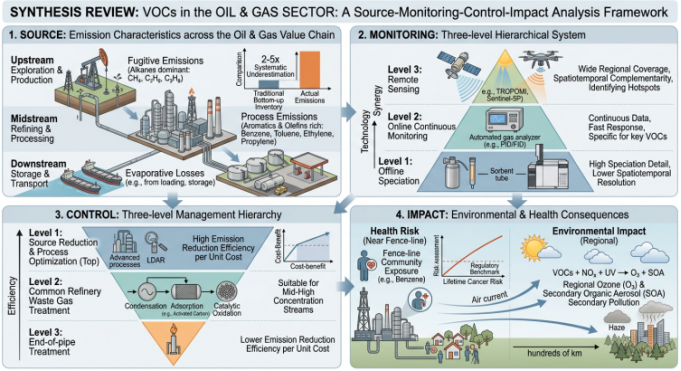
This review adopts a source-monitoring-control-impact four-dimensional analytical framework to evaluate petroleum-industry VOC research published between 2016 and 2026, drawing on 149 peer-reviewed publications from high-impact journals. Four evaluation criteria anchor this framework: source contribution weight determination, monitoring technique applicability boundaries, control technology feasibility assessed through abatement efficiency and lifecycle cost, and spatial heterogeneity of environmental and health risks benchmarked against regulatory compliance requirements (Figure 1).
Figure 1. Framework diagram.
2. Materials and Methods
A systematic literature search was conducted across Web of Science Core Collection, Scopus, PubMed, and the China National Knowledge Infrastructure (CNKI), using controlled vocabulary and free-text keyword combinations spanning four thematic dimensions: emission characterization (VOC, NMHC, emission factor, source profile, inventory, fugitive emission), monitoring technology (GC-MS, PTR-MS, FTIR, DOAS, fenceline monitoring, remote sensing, UAV, TROPOMI), control technology (catalytic oxidation, adsorption, biofiltration, condensation, LDAR, vapor recovery), and environmental and health impact (ozone formation potential, SOA, ILCR, health risk assessment). Boolean operators combined petroleum-industry terms with each dimension, restricted to peer-reviewed articles published in English or Chinese between January 2016 and May 2026. The initial search retrieved 1,847 records; after automated deduplication, 1,326 unique records underwent title and abstract screening. Two independent reviewers applied inclusion criteria —original quantitative measurements, methodology evaluation, control technology performance data, or regulatory analysis in SCIE/SSCI-indexed or Chinese core journals—achieving 92 percent inter-reviewer agreement, with disagreements resolved through consensus. Full-text assessment of 186 articles yielded a final corpus of 149 publications distributed across emission characterization (41 studies), monitoring technology (28 studies), control technology (37 studies), health and environmental impact (26 studies), and regulatory analysis (17 studies).
3. Results and Discussion
3.1. Emission Characteristics and Inventory Construction Across the Petroleum Industrial Chain
The emission profile of volatile organic compounds from the petroleum industrial chain exhibits a progressive compositional shift from light alkanes in upstream extraction, through olefin- and aromatic-enriched process streams in midstream refining, to evaporative mixtures dominated by intermediate-volatility species in downstream storage and distribution. This section traces that compositional evolution and evaluates the methodological frameworks for constructing and reconciling emission inventories.
3.1.1. Upstream Extraction
Upstream oil and gas extraction releases VOCs through well-pad equipment leaks, gas-liquid separation, produced-water handling, pneumatic device venting, and intermittent well completion and workover activities. The dominant VOC species are C2-C6 alkanes—ethane, propane, n-butane, isobutane, n-pentane, isopentane, and n-hexane—accounting for 70 to 85 percent of total non-methane VOC mass in most basin-level measurements . This compositional signature reflects thermodynamic partitioning of volatile hydrocarbons from the reservoir fluid and is relatively consistent across conventional and unconventional production types.
Quantifying upstream VOC emissions has proven challenging due to the inherently fugitive and intermittent nature of release points. Bottom-up inventories, which multiply activity data by emission factors, have historically underestimated measured ambient concentrations by factors of two to five . Francoeur et al. compared EPA National Emission Inventory estimates with top-down flux inversions using TROPOMI satellite data and aircraft mass-balance measurements across multiple U.S. production basins, finding the largest discrepancies for basins with aging infrastructure and sparse continuous emission monitors. In the Uintah Basin, Foster et al. confirmed that methane and VOC emissions exceeded inventory estimates by a factor of two to three, with the largest underestimation at wells in intermediate production phases where automated monitoring is least common.
In China, the Junggar Basin emission inventory by Zhang et al. identified production wellheads and gas-gathering stations as the dominant upstream sources, contributing 48 and 26 percent of total upstream emissions respectively. Emission factors from field measurements were approximately 30 percent higher than U.S. AP-42 defaults, reflecting differences in well age distribution, vapor recovery system penetration, and produced-water management practices. Seasonality exerts a substantial effect, with summer emissions exceeding winter values by 40 to 60 percent for wellhead sources.
3.1.2. Midstream Refining
Petroleum refining transforms the upstream alkane mixture into a more complex VOC emission profile. High-temperature, catalytic, and hydrogen-addition processes—particularly fluid catalytic cracking (FCC), delayed coking, catalytic reforming, and hydrotreating—generate process streams enriched in olefins and aromatic hydrocarbons .
Lv et al. conducted source profile characterization at a major refinery in Shandong Province, measuring emission factors ranging from 0.02 to 1.8 grams of VOC per ton of feedstock across 14 unit operations. The FCC unit dominated, contributing 38 percent of total facility VOC emissions with an aromatic-rich speciation and benzene-to-toluene ratio of approximately 0.8. The delayed coking unit was the second-largest source at 22 percent with an olefin-dominated profile. Importantly, the sum of diffuse and fugitive source emissions—flange leaks, pump seals, valve packing, and open-ended lines—equaled or exceeded combined stack emissions in several surveyed facilities, underscoring the limitations of stack-focused monitoring.
Historical emission trends provide evidence of regulatory impact. Sun et al. reconstructed emission inventories for the Guangdong Province refining sector from 2000 to 2020, documenting a peak around 2015 followed by a 25 to 30 percent decline through 2020, attributed primarily to China’s GB 31570-2015 emission standard. Similar patterns have been documented in the U.S. refining sector, where the 2015 Refinery Sector Rule drove an approximately 20 percent reduction in refinery benzene emissions between 2015 and 2020 .
3.1.3. Downstream Storage and Transport
Downstream VOC emissions arise principally from evaporative losses. Storage tanks represent the single largest downstream source category, with tank breathing losses and working losses together contributing 30 to 40 percent of total facility-level VOC releases . Liu et al. developed a process-based emission inventory method resolving tank emissions as a function of stored liquid vapor pressure, tank design parameters, and meteorological variables. Application to 12 Chinese refineries revealed that floating-roof tanks still contributed 60 to 70 percent of total tank farm emissions when seal degradation was accounted for, with crude oil and naphtha tanks exhibiting emission rates three to five times higher than diesel or fuel oil tanks.
Loading operations—truck, rail, and marine—constitute the second major downstream source. Vapor recovery systems capable of capturing 95 percent or more of displaced vapors have been widely deployed at gasoline terminals in North America and Europe, but penetration remains lower in developing-country contexts . Marine loading of crude oil and refined products involves larger individual transfer volumes and merits attention in regional emission inventories, particularly in coastal refining centers.
3.1.4. Emission Inventory Methodologies
Three methodological paradigms underpin current petroleum-industry VOC emission inventories. Bottom-up methods multiply activity data by emission factors and are most widely used for regulatory reporting . Material-balance methods compare VOC content of process inputs and outputs, offering greater accuracy for well-characterized processes. Inverse-dispersion methods infer emission rates from ambient concentration measurements by solving the atmospheric transport equation in reverse .
The systematic discrepancy between bottom-up and top-down emission estimates represents a consequential methodological challenge. Wei et al. applied inverse-dispersion calculations to a refinery in northern China, finding fugitive VOC emissions 2.5 to 4.0 times higher than the facility’s AP-42-based inventory. Riddick et al. evaluated EPA Other Test Method 33A and reported that the method systematically underestimated true emissions by 20 to 40 percent under unstable atmospheric conditions. Helmig et al. concluded that the average ratio of top-down to bottom-up estimates across 11 U.S. basins was 2.3, with the largest discrepancies in basins with aging infrastructure. Despite recognition that multi-method reconciliation is essential for credible emission reporting, no widely accepted reconciliation framework has been adopted by regulatory agencies in any jurisdiction.
3.2. Monitoring Technologies
Monitoring petroleum-industry VOC emissions requires technologies spanning at least six orders of magnitude in spatial scale, from individual component leaks at the centimeter scale to continental-scale satellite retrievals. This section evaluates the three-tier monitoring hierarchy that has emerged to address this challenge.
3.2.1. Offline Speciation
Offline sampling followed by laboratory analysis remains the reference method for detailed VOC speciation. The SUMMA canister method, combining whole-air sampling in electropolished stainless steel canisters with GC-MS/FID analysis, achieves sub-parts-per-billion detection limits for 57 to over 100 individual VOC species . A year-long monitoring campaign at an oil and gas station in northwest China employed this method to characterize seasonal VOC profiles with monthly resolution, demonstrating that alkane concentrations varied by a factor of three between winter and summer .
Sorbent tube sampling with thermal desorption provides complementary capabilities for polar and higher-boiling VOCs subject to wall losses during canister storage. Multi-bed sorbent tubes packed with sequentially stronger adsorbents enable quantitative collection of VOCs spanning the C3 to C20 volatility range. The principal limitation is temporal resolution: typical sampling durations of 1 to 24 hours integrate over emission episodes and atmospheric dilution events.
3.2.2. Online Continuous Monitoring
Proton transfer reaction mass spectrometry (PTR-MS) has emerged as the leading online monitoring technology for petroleum-industry VOC applications, offering sub-second time resolution for targeted hydrocarbons at detection limits of 10 to 50 parts per trillion by volume . The technique ionizes VOCs via proton transfer from hydronium ions under controlled drift-tube conditions, producing minimal fragmentation and enabling real-time quantification without chromatographic separation .
Automated online gas chromatographs with thermal desorption pre-concentration offer an alternative that prioritizes speciation breadth over time resolution, achieving hourly or sub-hourly measurement cycles for 50 to 100 VOC species . Lee et al. demonstrated that passive sampling with thermal desorption tubes and active canister sampling produced statistically indistinguishable concentration estimates for benzene and toluene but diverged by 20 to 40 percent for low-molecular-weight C2-C3 species. Open-path Fourier transform infrared spectroscopy (FTIR) and differential optical absorption spectroscopy (DOAS) provide path-integrated concentration measurements over 100 to 500 meters, enabling facility-scale emission quantification from diffuse area sources.
3.2.3. Remote Sensing and Mobile Platforms
Optical gas imaging (OGI) cameras operating in the mid-wave infrared spectral region enable real-time visualization of hydrocarbon plumes, leveraging C-H stretching vibration absorption. OGI cameras have become the primary survey tool for LDAR programs in North America, though their quantification capability is limited to qualitative indication of emission rate .
Mobile measurement platforms mounted on ground vehicles, UAVs, and crewed aircraft have substantially expanded spatial coverage. Zhou et al. deployed a vehicle-based system integrating a cavity ring-down spectrometer, a flame ionization detector, and GPS across over 1,000 well pads in the Eagle Ford Basin, revealing a skewed emission distribution in which 5 percent of sites accounted for over 50 percent of total detected emissions. At the largest scale, the TROPOMI instrument aboard Sentinel-5 Precursor, with 7-by-5.5-kilometer nadir pixel resolution and daily global coverage, has enabled basin-scale methane quantification . Tyner et al. combined airborne LiDAR with ground survey data for the Permian Basin, demonstrating that combining top-down flux constraints with bottom-up equipment inventories can reduce emission estimate uncertainty by 30 to 50 percent.
3.2.4. Cross-Tier Data Integration
Despite the complementary capabilities of the three monitoring tiers, data from different platforms are rarely combined into unified emission estimates. The technical obstacles include fundamentally different measurement support scales, the absence of standardized uncertainty propagation methods, and the semantic challenge of reconciling VOC measurements performed with different speciation resolution . Di Gilio et al. demonstrated a citizen-science approach combining a distributed network of low-cost passive samplers with PTR-MS time series, substantially improving source attribution confidence but requiring labor-intensive calibration. The absence of a widely accepted cross-tier integration framework has practical consequences for regulatory enforcement and impedes the development of intelligent closed-loop monitoring and control systems.
3.3. Control Technologies
The control of VOC emissions from petroleum-industry operations follows a three-stage hierarchy of increasing cost and decreasing marginal effectiveness: source reduction through feedstock and design choices, process optimization and equipment management, and end-of-pipe treatment through destruction or capture.
3.3.1. Source Reduction
Green well completion practices—in which flowback gas is captured and directed to a gathering line rather than vented or flared—represent the single most effective source reduction measure for upstream operations, achieving greater than 90 percent VOC emission reduction during the completion phase . Reduced emission completion (REC) technologies were mandated for new hydraulically fractured natural gas wells in the United States under the 2012 NSPS Subpart, producing an estimated 1.7 million ton reduction in methane emissions between 2012 and 2020. In the refining context, source reduction encompasses the substitution of high-volatility feedstocks and solvents, the adoption of closed-loop cooling and sampling systems, and the redesign of process units to minimize leak points. These measures are most cost-effective when incorporated during major facility turnarounds or new construction .
3.3.2. Process Control
Leak detection and repair (LDAR) programs form the backbone of process-level fugitive emission control. The conventional paradigm of fixed-frequency surveys of all accessible components has been challenged by evidence that emission rates follow a highly skewed distribution in which a small fraction of components accounts for a large fraction of total emissions . Ravikumar et al. analyzed repeated LDAR surveys from over 2,000 facilities in Canada and the United States, finding that directed inspection programs—surveying only historically high-leak components and known problematic equipment at high frequency—achieved 80 to 90 percent of the emission reduction of comprehensive programs at approximately 40 percent of the inspection cost.
Floating-roof tank seal retrofitting is among the most cost-effective process control measures for downstream storage. Internal floating-roof tanks equipped with mechanically or liquid-mounted primary seals and rim-mounted secondary seals achieve 60 to 95 percent standing loss reduction. Yang et al. demonstrated that secondary seal installation and regular seal integrity inspection reduced tank-related VOC emissions by 85 percent with a payback period of less than two years. Closed loading systems with vapor return lines achieve capture efficiencies exceeding 95 percent for high-vapor-pressure products .
3.3.3. End Treatment
The condensation-adsorption-catalytic oxidation treatment train represents the mainstream technology configuration for refinery process exhaust streams with VOC concentrations in the 500 to 10,000 mg/m3 range . Condensation serves as the first stage, recovering high-boiling VOCs while reducing organic loading on downstream units. Single-stage condensation at 5 degrees Celsius removes 80 to 95 percent of C6+ hydrocarbons.
Adsorption on porous solid media—activated carbon, zeolites, silica gel, and increasingly, metal-organic frameworks (MOFs)—addresses the intermediate-volatility fraction not captured by condensation . Activated carbon remains the most widely deployed adsorbent due to its low cost and high specific surface area (800-1,500 m2/g), but its performance degrades in humid streams and it is susceptible to bed fires during exothermic regeneration . MOF-based adsorbents of the UiO and MIL families offer tunable pore geometries and surface chemistries for selective VOC adsorption . Zhu et al. concluded that while MOFs exhibit superior adsorption capacities for aromatic VOCs under dry conditions (up to 1.5 g/g for benzene on MIL-101), their performance under humid conditions remains inferior to hydrophobic zeolites such as ZSM-5.
Catalytic oxidation completes the treatment train by converting residual VOCs to CO2 and H2O at 200 to 500 degrees Celsius. Noble-metal catalysts (Pt, Pd on gamma-Al2O3) offer high activity at lower temperatures but are costly and susceptible to poisoning by sulfur, chlorine, and silicon compounds . Transition-metal oxide catalysts based on Mn, Co, Cu, and Ce oxides have attracted substantial research attention as lower-cost alternatives .Oxygen-vacancy engineering has emerged as a particularly effective strategy for enhancing low-temperature activity: Zeng et al. demonstrated that MnO2 nanorods with engineered oxygen vacancies achieved 90 percent toluene conversion at 200 degrees Celsius—approximately 40 degrees lower than the stoichiometric baseline—with stable performance over 100 hours in dry conditions. The critical unresolved challenge is maintaining this performance in the presence of water vapor, sulfur dioxide, and chlorinated VOCs common in real refinery exhaust.
3.3.4. Emerging Technologies
Biofiltration—passing VOC-laden air through a packed bed colonized by VOC-degrading microorganisms—offers a low-energy, low-operating-cost alternative for dilute, high-volume streams. Removal efficiencies of 80 to 95 percent have been reported for BTEX compounds at inlet concentrations below 500 mg/m3 . The principal limitations are sensitivity to concentration fluctuations and inability to degrade highly halogenated VOCs at economically viable rates .
Non-thermal plasma (NTP) technologies, particularly dielectric barrier discharge (DBD) reactors, generate reactive oxygen and nitrogen species at ambient temperature and pressure . While removal efficiencies exceeding 90 percent are achievable for single-component VOC streams at laboratory scale, energy efficiency (typically 1-10 g VOC/kWh) remains inferior to catalytic oxidation. Plasma-catalytic hybrid systems address this limitation by using the plasma discharge to generate reactive intermediates that are selectively oxidized on the catalyst surface at lower temperatures . Photo-thermal synergistic catalysis, in which the catalyst is simultaneously heated and irradiated with ultraviolet or visible light, represents a frontier research direction. Prostějovský et al. demonstrated that ultraviolet light integration into a catalytic reactor improved styrene degradation efficiency by 25 percent relative to thermal catalysis alone.
3.3.5. Lifecycle Cost Analysis
Comparative economic analyses consistently indicate that front-loaded investment in source reduction and process optimization yields 30 to 50 percent greater emission reduction per unit of lifecycle cost compared to end-of-pipe-only strategies . Behnami et al. applied multi-criteria decision analysis to a petrochemical wastewater treatment plant, demonstrating that the optimal control strategy allocated approximately 40 percent of total abatement investment to source reduction, 35 percent to process control, and 25 percent to end-of-pipe treatment. This allocation achieved the same total emission reduction as an end-of-pipe-only alternative at 30 percent lower total cost. The optimal investment allocation depends on facility-specific factors including infrastructure age, crude slate processed, applicable emission limits, and discount rate applied to future operating cost savings.
3.4. Environmental Fate and Health Risk Assessment
Petroleum-industry VOC emissions produce a spatial dichotomy in environmental and health impacts: near-source risks are dominated by direct inhalation of carcinogenic aromatic hydrocarbons at concentrations exceeding regulatory risk benchmarks, while far-field impacts arise from secondary formation of ozone and particulate matter through multi-generational atmospheric oxidation.
3.4.1. Near-Source Carcinogenic Risk
Benzene—a Group 1 carcinogen—is the dominant contributor to inhalation cancer risk in populations proximate to petroleum facilities. ILCR values exceeding 1×10⁻⁶ have been documented in fenceline communities near refineries in the Pearl River Delta, Beijing, Shandong, and the Yangtze River Delta . Li et al. measured seasonal VOC profiles at multiple receptor sites in Beijing and calculated ILCR values ranging from 2.3 10-6 to 8.7 10-6, with benzene contributing 65 to 80 percent of total cancer risk.
Source apportionment using positive matrix factorization (PMF) consistently identifies petroleum-related factors—characterized by high loadings of C4-C6 alkanes, cyclohexane, and methylcyclohexane—as the dominant contributor to benzene concentrations at fenceline locations . Quasi-experimental evidence from the idling of an urban oil production site in Los Angeles demonstrated a statistically significant decline in ambient benzene concentrations following cessation of operations, confirming the direct contribution of the petroleum source . Urinary biomarker studies provide corroborating evidence: trans, trans-muconic acid (t, t-MA) has been measured at elevated concentrations in fenceline community residents, although interpretation is complicated by dietary sorbic acid interference . S-phenylmercapturic acid (S-PMA), a more specific benzene biomarker, has been less extensively deployed in petroleum-community studies despite its greater specificity.
3.4.2. Far-Field Ozone and Secondary Organic Aerosol Formation
Tropospheric ozone formation proceeds through the photochemical cycling of NO and NO2 in the presence of VOCs, with OFP of individual species varying by over three orders of magnitude depending on OH radical reaction rate and mechanistic pathway . A consistent finding across multiple studies is that a small subset of petroleum-associated VOCs—C3-C6 alkenes and C7-C9 aromatics—accounts for 70 to 90 percent of total OFP while constituting only 30 to 50 percent of total VOC mass . Xiong et al. applied a chemical transport model to an oil industry center in Canada and demonstrated that a strategy targeting the top 20 OFP-contributing species achieved 85 percent of the ozone reduction benefit obtainable from controlling all VOC species.
In northern China, where oil production overlaps with high population density and unfavorable dispersion conditions, Chen et al. diagnosed the ozone formation regime in Shandong Province and found that ozone production was VOC-limited throughout summer, with alkenes driving a disproportionate share of radical initiation. Secondary organic aerosol formation from aromatic VOCs proceeds through multi-generational oxidation adding oxygen-containing functional groups that progressively reduce volatility. Aromatic SOA yields range from approximately 5 percent for benzene to over 30 percent for m-xylene under high-NOx conditions . Integrated source apportionment studies in the Beijing-Tianjin-Hebei region estimate that petroleum-industry VOC emissions contribute 8 to 15 percent of the regional anthropogenic SOA burden, rising to over 20 percent 50 to 100 kilometers downwind of major refining centers.
3.4.3. Respiratory and Systemic Health Effects: Epidemiological Evidence and Gaps
Non-cancer health effects of petroleum-industry VOC exposure have been investigated through panel studies, time-series analyses of emergency department visits, and cross-sectional surveys in fenceline communities. Madani et al. analyzed the association between VOC concentrations and respiratory disease-associated emergency room visits, finding that benzene, toluene, ethylbenzene, and xylenes each exhibited independent positive associations with asthma exacerbation, with odds ratios ranging from 1.15 to 1.42 per interquartile range increase. The existing epidemiological literature is constrained by three structural limitations: the predominance of cross-sectional and ecological study designs, exposure assessment relying on central-site monitoring data that do not capture fine-scale spatial gradients , and the confounding influence of co-emitted pollutants that is difficult to disentangle from VOC-specific effects.
A consequential open debate concerns the appropriate dose-response model for benzene carcinogenic risk assessment at low concentrations characteristic of fenceline community exposures. The linear no-threshold model—the default assumption in U.S. EPA and WHO risk assessments—has been challenged by analyses suggesting that benzene metabolism follows saturable kinetics at low concentrations, potentially producing a sub-linear dose-response relationship . The mechanistic basis rests on the observation that cytochrome P450 2E1-mediated oxidation of benzene to benzene oxide—the rate-limiting step in metabolic activation—exhibits Michaelis-Menten kinetics with a Km value in the low micromolar range. Resolution of this debate through targeted dosimetric and epidemiological studies at fenceline-relevant concentrations would substantially reduce uncertainty in population-level cancer burden estimates.
4. Conclusions and Outlook
4.1. Conclusions
This review has systematically evaluated petroleum-industry VOC research through the source-monitoring-control-impact framework, demonstrating that emission profiles shift compositionally across the industrial chain, from alkane-dominated upstream fugitive releases through aromatic- and olefin-rich midstream process emissions to downstream evaporative losses. Bottom-up emission inventories systematically underestimate fugitive VOC releases by factors of two to five, and the absence of practical cross-tier data integration frameworks remains the principal barrier to unified emission estimates despite complementary coverage from three monitoring tiers. Control technology analysis shows that front-loaded investment in source reduction and process optimization achieves 30 to 50 percent greater emission reduction per unit lifecycle cost than end-of-pipe-only strategies, although advanced adsorbents and oxygen-vacancy-engineered catalysts face persistent sensitivity to sulfur, chlorine, and water vapor co-exposure in real refinery exhaust. Health risk assessments document benzene-driven ILCR values exceeding regulatory benchmarks in fenceline communities, corroborated by urinary biomarker data and quasi-experimental evidence, while far-field secondary pollution from ozone and SOA formation extends impacts hundreds of kilometers downwind.
Research limitations include the predominance of studies from North America, China, and Western Europe, constraining transferability to other petroleum-producing regions, and the absence of standardized VOC reporting metrics precluding formal meta-analysis. Six frontier directions—multi-platform data fusion for dynamic inventories, intelligent closed-loop monitoring and control, durable low-temperature catalysts for real exhaust conditions, and prospective cohort studies with individual-level exposure monitoring—define the pathway from reactive compliance to proactive health-protective management of petroleum-industry VOC emissions.
4.2. Future Outlook
Six frontiers define the transition from reactive compliance to proactive, multi-pollutant risk prevention.
1) In emission characterization, multi-platform data fusion combining satellite total-column retrievals of both VOCs and greenhouse gases, must move from basin-scale demonstrations to operational multi-species inventories through standardized assimilation algorithms and cross-platform uncertainty propagation frameworks .
2) In monitoring, a critical frontier is the integration of VOC and greenhouse gas measurement into unified surveillance networks. Recent advances in open-path dual-comb spectroscopy have demonstrated simultaneous quantification of methane, ethane, and propane at high temporal resolution from a single instrument, enabling source attribution through VOC-methane correlation analysis . Long-term community monitoring campaigns combining VOC speciation with methane concentration measurements have proven effective in distinguishing oil-and-gas contributions from other methane sources in mixed urban-industrial environments .
3) In process control, intelligent closed-loop systems integrating real-time fenceline and greenhouse gas data streams with machine-learning anomaly detection promise continuous multi-pollutant prevention, contingent on robust algorithms balancing sensitivity with low false-alarm rates in chemically complex facility environments.
4) In control technology, the synergistic abatement of VOCs and methane—a potent short-lived climate pollutant—requires advancing from single-pollutant laboratory testing to multi-component pilot-scale validation. Dual-function catalysts capable of simultaneously oxidizing methane alongside aromatic and oxygenated VOCs at moderate temperatures remain in an early development stage, with Mn-Ce oxide compositions and Pd-based formulations showing the greatest promise for integrated exhaust treatment . Photo-thermal synergistic systems and plasma-catalytic hybrids must similarly be validated under the combined sulfur-, chlorine-, water vapor-, and CO2-laden conditions of real refinery exhaust.
5) In policy and management, the emerging paradigm of synergistic co-control—simultaneously targeting VOC reductions for ozone air quality improvement and methane reductions for near-term climate mitigation—represents a transformative opportunity . Multi-objective optimization studies for petrochemical facilities have demonstrated that VOC and greenhouse gas co-reduction strategies can achieve substantial emission reductions in both pollutant categories at lower aggregate cost than separate abatement programs, by exploiting shared emission sources and overlapping control technologies . Operationalizing co-control requires institutional mechanisms that integrate currently fragmented VOC and greenhouse gas regulatory frameworks, including unified emission reporting protocols, co-benefit accounting methodologies, and coordinated incentive structures.
6) In health research, prospective cohort studies employing wearable passive samplers and urinary VOC-specific biomarkers remain essential for establishing causal exposure-outcome relationships that cross-sectional designs have left unresolved.
Abbreviations

BTEX

Benzene, Toluene, Ethylbenzene, and Xylenes

DBD

Dielectric Barrier Discharge

DOAS

Differential Optical Absorption Spectroscopy

EPA

Environmental Protection Agency (United States)

FCC

Fluid Catalytic Cracking

FTIR

Fourier Transform Infrared Spectroscopy

ILCR

Incremental Lifetime Cancer Risk

LDAR

Leak Detection and Repair

LiDAR

Light Detection and Ranging

MIL

Materials of Institut Lavoisier (a Family of MOFs)

NMHC

Non-methane Hydrocarbon

NTP

Non-thermal Plasma

OFP

Ozone Formation Potential

OGI

Optical Gas Imaging

PMF

Positive Matrix Factorization

REC

Reduced Emission Completion

SOA

Secondary Organic Aerosol

UAV

Unmanned Aerial Vehicle

VOCs

Volatile Organic Compounds

Acknowledgments
This study was supported by the Research Foundation of China University of Petroleum-Beijing at Karamay (Grant No. XQZX20250019), Karamay Innovation Environment Construction Plan (Innovative Talents) Project (Grant No. 2025DB0104), and Implementation Plan of the Talent Support Program for Major Needs in Xinjiang Project Implementation Plan for the Xinjiang Major Needs Talent Support Program (Grant No. XJRC-2025-ZZB-ZDXQ-022).
Author Contributions
Shuzheng Guo: Conceptualization, Funding acquisition, Writing – original draft
Yiqi Wang: Conceptualization, Writing – review & editing
Pengyu Wang: Investigation, Writing – review & editing
Xiuqin Sun: Conceptualization, Supervision, Writing – review & editing
Haoxiang Wang: Investigation, Writing – review & editing
Funding
This work is supported by Research Foundation of China University of Petroleum-Beijing at Karamay (Grant No. XQZX20250019), Karamay Innovation Environment Construction Plan (Innovative Talents) Project (Grant No. 2025DB0104), and Implementation Plan of the Talent Support Program for Major Needs in Xinjiang Project Implementation Plan for the Xinjiang Major Needs Talent Support Program (Grant No. XJRC-2025-ZZB-ZDXQ-022).
Conflicts of Interest
The authors declare no conflicts of interest.
References
[1] Rajabi, H., Mosleh, M. H., Mandal, P., Lea-Langton, A., Sedighi, M. Emissions of volatile organic compounds from crude oil processing - Global emission inventory and environmental release, The Science of the Total Environment. 2020, 727, 138654.
[2] Ragothaman, A., Anderson, W. A., Anderson, W. Air quality impacts of petroleum refining and petrochemical industries, Environments. 2017, 4(3), 66.
[3] Duan, C., Liao, H., Wang, K., Ren, Y. The research hotspots and trends of volatile organic compound emissions from anthropogenic and natural sources: A systematic quantitative review, Environmental Research. 2023, 216(Pt 1), 114386.
[4] Xiong, Y., Zhou, J., Xing, Z., Du, K. Optimization of a volatile organic compound control strategy in an oil industry center in Canada by evaluating ozone and secondary organic aerosol formation potential, Environmental Research. 2020, 191, 110217.
[5] Chen, T., et al. Volatile organic compounds and ozone air pollution in an oil production region in northern China, Atmospheric Chemistry and Physics. 2020, 20(11), 7069-7086.
[6] Xiang, S., et al. Control of both PM2.5 and O3 in Beijing-Tianjin-Hebei and the surrounding areas, Atmospheric Environment. 2020, 224, 117259.
[7] Li, C., et al. Environmental impact and health risk assessment of volatile organic compound emissions during different seasons in Beijing, Journal of Environmental Sciences. 2020, 93, 1-12.
[8] Zhang, Z., et al. Emission and health risk assessment of volatile organic compounds in various processes of a petroleum refinery in the Pearl River Delta, China, Environmental Pollution. 2018, 238, 452-461.
[9] Edie, R., et al. Off-site flux estimates of volatile organic compounds from oil and gas production facilities using fast-response instrumentation, Environmental Science & Technology. 2020, 54(3), 1385-1394.
[10] Lee, H. E., Yoon, S. J., Kim, J. H. Analysis of VOC emission characteristics in the petrochemical industry and study on fenceline monitoring techniques, Atmosphere. 2025, 16(5), 543.
[11] Zhou, X., et al. Mobile measurement system for the rapid and cost-effective surveillance of methane and volatile organic compound emissions from oil and gas production sites, Environmental Science & Technology. 2021, 55(1), 581-592.
[12] Zhu, L., Shen, D., Luo, K. H. A critical review on VOCs adsorption by different porous materials: Species, mechanisms and modification methods, Journal of Hazardous Materials. 2020, 389, 122102.
[13] Hao, X., Xiafan, X., Liubiao, C., Jia, G., Junjie, W. A novel cryogenic condensation system based on heat-driven refrigerator without power input for volatile organic compounds recovery, Energy Conversion and Management. 2021, 238, 114157.
[14] Zhang, W., Pan, D., Ku, I. T., Zhou, Y., Pierce, J. R., Jr, J. L. C. Using ambient concentration measurements to quantify volatile organic compound emissions from unconventional oil and gas operations, Environmental Science & Technology. 2025, 59(51), 27881-27890.
[15] Zhang, Q., Wang, H., Wang, X., Wu, Y. Volatile organic compounds emitted from oil and gas production in Junggar Basin: emission inventory, characteristics and environmental risks, Air Quality, Atmosphere & Health. 2025.
[16] Francoeur, C. B., et al. Quantifying methane and ozone precursor emissions from oil and gas production regions across the contiguous US, Environmental Science & Technology. 2021.
[17] Foster, C. S., et al. Confirmation of elevated methane emissions in Utah’s Uintah Basin with ground-based observations and a high-resolution transport model, Journal of Geophysical Research: Atmospheres. 2017.
[18] Lv, D., Lu, S., Tan, X., Shao, M., Xie, S., Wang, L. Source profiles, emission factors and associated contributions to secondary pollution of volatile organic compounds (VOCs) emitted from a local petroleum refinery in Shandong, Environmental Pollution. 2021, 274, 116589.
[19] Sun, X., Liang, X., Chen, L., Liao, C., Zhang, Y., Ye, D. Historical emission and reduction of VOCs from the petroleum refining industry and their potential for secondary pollution formation in Guangdong, China, The Science of the Total Environment. 2023, 904, 166416.
[20] Sha, S., Liu, S., Huang, M., Fan, N., Wang, N., Cai, M. Volatile organic compound emission status and control perspectives in the petroleum refining industry in China, Atmosphere. 2022, 13(8), 1194.
[21] Liu, Y., Han, F., Liu, W., Cui, X., Luan, X., Cui, Z. Process-based volatile organic compound emission inventory establishment method for the petroleum refining industry, Journal of Cleaner Production. 2020, 263, 121609.
[22] Huy, L. N., Oanh, N. T. K. Emission control for volatile organic compounds from gasoline stations and implication on ozone-forming potential, Atmospheric Pollution Research. 2020.
[23] Wei, W., Lv, Z., Yang, G., Cheng, S., Li, Y., Wang, L. VOCs emission rate estimate for complicated industrial area source using an inverse-dispersion calculation method: A case study on a petroleum refinery in Northern China, Environmental Pollution. 2016, 218, 681-688.
[24] Edie, R., et al. Constraining the accuracy of flux estimates using OTM 33A, Atmospheric Measurement Techniques. 2020, 13(1), 341-353.
[25] Detlev, H., Dani, C. Top-down versus bottom-up atmospheric emission estimates from oil and natural gas operations, Earth‘s Future. 2025.
[26] Zheng, H., et al. Monitoring of volatile organic compounds (VOCs) from an oil and gas station in northwest China for 1 year, Atmospheric Chemistry and Physics. 2018, 18(7), 4567-4595.
[27] Sanchez, N. P., et al. Results of three years of ambient air monitoring near a petroleum refinery in Richmond, California, USA, Atmosphere. 2019.
[28] Zhang, S., Ma, J., Zhang, X., Guo, C. Atmospheric remote sensing for anthropogenic methane emissions: Applications and research opportunities, The Science of the Total Environment. 2023.
[29] Tyner, D. R., Johnson, M. R. Where the methane is—Insights from novel airborne LiDAR measurements combined with ground survey data, Environmental Science & Technology. 2021.
[30] Gilio, A. D., Palmisani, J., Petraccone, S., de Gennaro, G. A sensing network involving citizens for high spatio-temporal resolution monitoring of fugitive emissions from a petroleum pre-treatment plant, The Science of the Total Environment. 2021, 791, 148135.
[31] Behnami, A., Benis, K. Z., Shakerkhatibi, M., Derafshi, S., Chavoshbashi, M. M. A systematic approach for selecting an optimal strategy for controlling VOCs emissions in a petrochemical wastewater treatment plant, Stochastic Environmental Research and Risk Assessment. 2019, 33(1), 13-29.
[32] Kim, M.-G., et al. Evaluating the feasibility of air environment management system for VOCs through ‘VOCs specification’ of petroleum refining industry, Journal of the Air & Waste Management Association. 2023, 73(5), 362-373.
[33] Ravikumar, A. P., et al. Repeated leak detection and repair surveys reduce methane emissions over scale of years, Environmental Research Letters. 2020.
[34] Yang, H., et al. Volatile organic compounds (VOCs) emissions from internal floating-roof tank in oil depots in Beijing: Influencing factors and emission reduction strategies analysis, The Science of the Total Environment. 2024.
[35] Huang, J., et al. Research on the general technical standards of the gasoline vapor recovery unit set, E3S Web of Conferences. 2019.
[36] Kamal, M. S., Razzak, A., Hossain, M. M., Razzak, S. A. Catalytic oxidation of volatile organic compounds (VOCs) - A review, Atmospheric Environment. 2016, 140, 117-134.
[37] Li, X., Zhang, L., Yang, Z., Wang, P., Yan, Y., Ran, J. Adsorption materials for volatile organic compounds (VOCs) and the key factors for VOCs adsorption process: A review, Separation and Purification Technology. 2020.
[38] Zhang, X., Gao, B., Creamer, A. E., Cao, C., Li, Y. Adsorption of VOCs onto engineered carbon materials: A review, Journal of Hazardous Materials. 2017.
[39] Choma, J., Szczęśniak, B., Kapusta, A., Jaroniec, M. A concise review on porous adsorbents for benzene and other volatile organic compounds, Molecules. 2024.
[40] Lu, S., et al. Potential applications of porous organic polymers as adsorbent for the adsorption of volatile organic compounds, Journal of Environmental Sciences. 2021.
[41] Li, K., Luo, X. Research progress on catalytic combustion of volatile organic compounds in industrial waste gas, Catalysts. 2023.
[42] Li, X., Niu, Y., Zhang, C., Su, H., Qi, Y. Catalytic combustion of toluene over broccoli-shaped Ce1Mn3Oₓ solid solution, ChemCatChem. 2021.
[43] Lu, Y., Duan, L., Sun, Z., Chen, J. Flame spray pyrolysis synthesized CuO-CeO2 composite for catalytic combustion of C3H6, Proceedings of the Combustion Institute. 2021.
[44] Zeng, J., Xie, H., Liu, Z., Liu, X., Zhou, G., Jiang, Y. Oxygen vacancy induced MnO2 catalysts for efficient toluene catalytic oxidation, Catalysis Science & Technology. 2021.
[45] Malakar, S., Saha, P. D., Baskaran, D., Rajamanickam, R. Comparative study of biofiltration process for treatment of VOCs emission from petroleum refinery wastewater—A review, Environmental Technology & Innovation. 2017.
[46] Li, S., Dang, X., Yu, X., Abbas, G., Zhang, Q., Cao, L. The application of dielectric barrier discharge non-thermal plasma in VOCs abatement: A review, Chemical Engineering Journal. 2020.
[47] Ahn, T., Lee, D. H., Park, S. Combustion of inert-gas-diluted volatile organic compounds using a fuel-rich pilot flame and rotating arc plasma, Plasma Chemistry and Plasma Processing. 2019.
[48] Prostějovský, T., Kulišťáková, A., Sauer, L., Přibyl, M., Reli, M., Kočí, K. Improving reactor fluid dynamics enhances styrene degradation by advanced oxidation processes, Separation and Purification Technology. 2023.
[49] Liu, C., Gao, J. Analysis on the hazard control technology of volatile organic compounds, IOP Conference Series: Earth and Environmental Science. 2021, 791(1), 012166.
[50] Li, L., et al. Investigation of O3-precursor relationship nearby oil fields of Shandong, China, Atmospheric Environment. 2022, 294, 119471.
[51] Wang, Z., et al. Ambient volatile organic compound characterization, source apportionment, and risk assessment in three megacities of China in 2019, Toxics. 2023.
[52] Johnston, J. E., Okorn, K., Horne, Y. O. V., Jimenez, A. Changes in neighborhood air quality after idling of an urban oil production site, Environmental Science: Processes & Impacts. 2021, 23(7), 967-980.
[53] Zhang, C., et al. Characteristics, source apportionment and chemical conversions of VOCs based on a comprehensive summer observation experiment in Beijing, Atmospheric Pollution Research. 2021, 12(3), 230-241.
[54] Yang, H.-H., Gupta, S. K., Dhital, N. B., Wang, L.-C., Elumalai, S. P. Comparative investigation of coal- and oil-fired boilers based on emission factors, ozone and secondary organic aerosol formation potentials of VOCs, Journal of Environmental Sciences. 2020.
[55] Madani, N. A., Jones, L. E., Carpenter, D. O. Different volatile organic compounds in local point source air pollution pose distinctive elevated risks for respiratory disease-associated emergency room visits, Chemosphere. 2023, 344, 140403.
[56] Holder, C., et al. Evaluating potential human health risks from modeled inhalation exposures to volatile organic compounds emitted from oil and gas operations, Journal of the Air & Waste Management Association. 2019.
[57] Sakizadeh, M. Spatiotemporal variations and characterization of the chronic cancer risk associated with benzene exposure, Ecotoxicology and Environmental Safety. 2019.
[58] Mead, G. J., Waxman, E. M., Bon, D., Herman, D. I., Baumann, E., Giorgetta, F. R., Friedlein, J. T., Ycas, G., Newbury, N. R., Coddington, I. Open-path dual-comb spectroscopy of methane and VOC emissions from an unconventional oil well development in Northern Colorado, Frontiers in Chemistry. 2023, 11, 1202255.
[59] Kim, S. J., Ku, I. T., Zhou, Y., Pan, D., Low, L., Frazier, M., Buck, B., Collett, J. L. Long-term community monitoring of volatile organic compounds and methane in Erie, Colorado: sources and health risks, Science of the Total Environment. 2026, 181100.
[60] Palella, A., Spadaro, L., Di Chio, R., Arena, F. Effective low-temperature catalytic methane oxidation over MnCeOₓ catalytic compositions, Catalysis Today. 2021.
[61] Zou, X., Chen, J., Rui, Z., Ji, H. Sequential growth reveals multi-spinel interface promotion for methane combustion over alumina supported palladium catalyst, Applied Catalysis B: Environmental. 2020, 273, 119071.
[62] Zhou, K., Cheng, Z., Chen, J., Li, F., Li, S., Wu, T., Lu, Z., Wang, Q. Multi-objective optimization of VOCs and NOₓ co-reduction strategies under carbon emission constraints: A petrochemical case study in China, Atmospheric Pollution Research. 2025, 102667.
[63] Wang, Q., et al. A supplementary assessment system of AQI-V for comprehensive management and control of air quality in chemical industrial parks, Journal of Environmental Sciences. 2023, 130, 114-125.
[64] Kolonsky, E., Neverov, S. A practical approach to LDAR effectiveness evaluation, Carbon Management. 2023.
[65] Fetisov, V., Gonopolsky, A. M., Davardoost, H., Ghanbari, A. R., Mohammadi, A. H. Regulation and impact of VOC and CO2 emissions on low-carbon energy systems resilient to climate change: A case study on an environmental issue in the oil and gas industry, Energy Science & Engineering. 2023, 11(4), 1516-1535.
Cite This Article
  • APA Style

    Guo, S., Wang, Y., Wang, P., Wang, H., Sun, X. (2026). Volatile Organic Compounds from the Oil and Gas Extraction and Processing: Emission Characteristics, Monitoring Technologies, Control Technologies, and Environmental and Health Impacts. American Journal of Environmental Science and Engineering, 10(3), 82-92. https://doi.org/10.11648/j.ajese.20261003.12

    Copy | Download

    ACS Style

    Guo, S.; Wang, Y.; Wang, P.; Wang, H.; Sun, X. Volatile Organic Compounds from the Oil and Gas Extraction and Processing: Emission Characteristics, Monitoring Technologies, Control Technologies, and Environmental and Health Impacts. Am. J. Environ. Sci. Eng. 2026, 10(3), 82-92. doi: 10.11648/j.ajese.20261003.12

    Copy | Download

    AMA Style

    Guo S, Wang Y, Wang P, Wang H, Sun X. Volatile Organic Compounds from the Oil and Gas Extraction and Processing: Emission Characteristics, Monitoring Technologies, Control Technologies, and Environmental and Health Impacts. Am J Environ Sci Eng. 2026;10(3):82-92. doi: 10.11648/j.ajese.20261003.12

    Copy | Download

  • @article{10.11648/j.ajese.20261003.12,
      author = {Shuzheng Guo and Yiqi Wang and Pengyu Wang and Haoxiang Wang and Xiuqin Sun},
      title = {Volatile Organic Compounds from the Oil and Gas Extraction and Processing: Emission Characteristics, Monitoring Technologies, Control Technologies, and Environmental and Health Impacts},
      journal = {American Journal of Environmental Science and Engineering},
      volume = {10},
      number = {3},
      pages = {82-92},
      doi = {10.11648/j.ajese.20261003.12},
      url = {https://doi.org/10.11648/j.ajese.20261003.12},
      eprint = {https://article.sciencepublishinggroup.com/pdf/10.11648.j.ajese.20261003.12},
      abstract = {Volatile organic compounds (VOCs) emitted from the oil and gas extraction and processing industry constitute a major fraction of global anthropogenic VOC releases, with significant implications for tropospheric ozone formation, secondary organic aerosol production, and population-level health risks. This review adopts a source-monitoring-control-impact four-dimensional analytical framework to systematically evaluate the current state of research spanning the full petroleum industrial chain. The analysis reveals a progressive compositional shift in emission profiles, from alkane-dominated fugitive releases in upstream extraction to aromatic- and olefin-rich process emissions in midstream refining, culminating in evaporative losses during downstream storage and transport. A persistent discrepancy exists between bottom-up emission inventories and top-down flux measurements, with fugitive sources systematically underestimated by factors of two to five. The three-tier monitoring hierarchy of offline speciation, online continuous monitoring, and satellite- and UAV-based remote sensing provides complementary spatial and temporal coverage, yet cross-tier data integration remains underdeveloped, limiting the realization of unified emission estimates. Control strategies follow a three-stage hierarchy in which source reduction and process optimization deliver substantially greater emission reduction per unit cost than end-of-pipe treatment alone, although condensation-adsorption-catalytic oxidation remains the mainstream refinery exhaust treatment configuration. Health risk assessments consistently identify benzene-driven incremental lifetime cancer risk exceeding regulatory benchmarks in fenceline communities, while secondary pollution from ozone and aerosol formation extends impacts hundreds of kilometers downwind. To shift from reactive compliance to proactive VOC management, interconnected areas must be prioritized: artificial intelligence powered operational multi-platform emission inventories, unified VOC-greenhouse gas surveillance networks, intelligent closed-loop process control, pilot-scale synergistic abatement technologies, integrated co-control policies that jointly reduce VOCs and methane, and prospective cohort studies with biomarker-based exposure assessment.},
     year = {2026}
    }
    

    Copy | Download

  • TY  - JOUR
    T1  - Volatile Organic Compounds from the Oil and Gas Extraction and Processing: Emission Characteristics, Monitoring Technologies, Control Technologies, and Environmental and Health Impacts
    AU  - Shuzheng Guo
    AU  - Yiqi Wang
    AU  - Pengyu Wang
    AU  - Haoxiang Wang
    AU  - Xiuqin Sun
    Y1  - 2026/08/13
    PY  - 2026
    N1  - https://doi.org/10.11648/j.ajese.20261003.12
    DO  - 10.11648/j.ajese.20261003.12
    T2  - American Journal of Environmental Science and Engineering
    JF  - American Journal of Environmental Science and Engineering
    JO  - American Journal of Environmental Science and Engineering
    SP  - 82
    EP  - 92
    PB  - Science Publishing Group
    SN  - 2578-7993
    UR  - https://doi.org/10.11648/j.ajese.20261003.12
    AB  - Volatile organic compounds (VOCs) emitted from the oil and gas extraction and processing industry constitute a major fraction of global anthropogenic VOC releases, with significant implications for tropospheric ozone formation, secondary organic aerosol production, and population-level health risks. This review adopts a source-monitoring-control-impact four-dimensional analytical framework to systematically evaluate the current state of research spanning the full petroleum industrial chain. The analysis reveals a progressive compositional shift in emission profiles, from alkane-dominated fugitive releases in upstream extraction to aromatic- and olefin-rich process emissions in midstream refining, culminating in evaporative losses during downstream storage and transport. A persistent discrepancy exists between bottom-up emission inventories and top-down flux measurements, with fugitive sources systematically underestimated by factors of two to five. The three-tier monitoring hierarchy of offline speciation, online continuous monitoring, and satellite- and UAV-based remote sensing provides complementary spatial and temporal coverage, yet cross-tier data integration remains underdeveloped, limiting the realization of unified emission estimates. Control strategies follow a three-stage hierarchy in which source reduction and process optimization deliver substantially greater emission reduction per unit cost than end-of-pipe treatment alone, although condensation-adsorption-catalytic oxidation remains the mainstream refinery exhaust treatment configuration. Health risk assessments consistently identify benzene-driven incremental lifetime cancer risk exceeding regulatory benchmarks in fenceline communities, while secondary pollution from ozone and aerosol formation extends impacts hundreds of kilometers downwind. To shift from reactive compliance to proactive VOC management, interconnected areas must be prioritized: artificial intelligence powered operational multi-platform emission inventories, unified VOC-greenhouse gas surveillance networks, intelligent closed-loop process control, pilot-scale synergistic abatement technologies, integrated co-control policies that jointly reduce VOCs and methane, and prospective cohort studies with biomarker-based exposure assessment.
    VL  - 10
    IS  - 3
    ER  - 

    Copy | Download

Author Information
  • College of Engineering, China University of Petroleum-Beijing at Karamay, Karamay, China

  • College of Engineering, China University of Petroleum-Beijing at Karamay, Karamay, China

  • College of Engineering, China University of Petroleum-Beijing at Karamay, Karamay, China

  • College of Engineering, China University of Petroleum-Beijing at Karamay, Karamay, China

  • Geological Environment Analysis Technology Department, Shandong Coal Field Geological Survey and Research Institute, Jinan, China