Research Article | | Peer-Reviewed

Spatial-Temporal Analysis of Vegetation and Land Cover Changes in Central Darfur Using Remote Sensing Data (1980-2020)

Received: 2 August 2025     Accepted: 13 August 2025     Published: 23 September 2025
Views:       Downloads:
Abstract

The main research field of the present study is to use remote sensing for the detection of natural resources changes for the past 20 years due to climate change variability in most vulnerable areas in Zallingei, Central Darfur State (western Sudan). The natural resources covered some classes (vegetation, herbaceous, forest cover, bare lands and water bodies). Meteorological data covered 30 years (1980 - 2020) for temperature and rainfall as well as satellite imageries’ for the years, 1981, 2000 and 2020. The geospatial data were downloaded and an analysis using QGIS 3.22.1 and ERDAS 2014 software. The results showed that for the last four decades, the average temperature increased from 30.4 to 30.9°C, while the average rainfall decreased from 460 to 730 mm. The mean NDVI decreased from 0.28 to 0.20. Changes in natural resources in the 3 areas under study and for the years; 1980, 2000 and 2020 revealed that, For Abatta area, percentage changes in water bodies ranged between 4 - 7 and 6% for the corresponding years. Bare soil showed increases as: 25, 44, and 64%. For vegetation cover the range of decreases were; 34, 19 and 18%, herbaceous decreases were: 17, 16, 13%, while forests decreases were 24 to 16 and 15%. For Orukum area, Bare soil percentage changes were: 23 - 12 and 25% for the corresponding years, while water bodies changes ranged as: 20, 30, 16%. For vegetation cover changes were 18, 10, which increased to 38%, while herbaceous decreases ranged as: 32, 14 and 6%, the forest percentage changes ranged between 7, 17 and 6%. For Teraj area, percentage changes in water bodies decreased from 16 to 7% with small changes in bare soils changes (20, 17, and 20%). Vegetation cover percentage increases were: 19, 26 and 32%, while herbaceous changes varied as: 26, 40, and 18% with forest showing changes as: 20, 10, and 23%. There was a high negative (r = - 0.51) correlation between vegetation cover and forest, as well as with average temperature (r = -0.64) but high positive correlations between vegetation cover and herbaceous cover (r = 0.51). Bare soil showed high negative correlations with vegetation cover (r = - 0.54) and average temperature (r = - 0.83). Forests were highly positively correlated with vegetation cover (r = 0.51), but highly negatively correlated average temperature (r = - 0.98) and annual rainfall (r = - 0.82). Herbaceous vegetation was highly (r = 0.83) positively correlated with vegetation cover. Average temperature negatively correlated with annual rainfall (r = - 0.77).

Published in American Journal of Life Sciences (Volume 13, Issue 4)
DOI 10.11648/j.ajls.20251304.12
Page(s) 117-128
Creative Commons

This is an Open Access article, distributed under the terms of the Creative Commons Attribution 4.0 International License (http://creativecommons.org/licenses/by/4.0/), which permits unrestricted use, distribution and reproduction in any medium or format, provided the original work is properly cited.

Copyright

Copyright © The Author(s), 2025. Published by Science Publishing Group

Keywords

Change Land Cover Detection, Special-temporal Use of Remote Sensing, Central Darfur, Sudan

1. Introduction
The Sahel region lies along the southern edge of the Sahara-desert, extending nearly five thousand kilometers from Cape Verde and Senegal in the west through Mali, Nigeria and Chad to Sudan . It is a transitional zone between the arid Sahara and the Savannah and tropical forest that border the coast . The Sahel has always been exposed to variable climatic changes. The variation from year to year can reach 30 per cent or more . The Sahel suffered severe droughts in the early 1970s and 1980s causing major losses of harvests and livestock, and an associated humanitarian crisis . Climate models generate mixed predictions for the further Sahelian climate. Some maintain that the Sahel region will be even drier in the twenty-first century .
Sudan is adversely affected by climatic variability and change because of its dependency on rain-fed agriculture, with variability in rainfall and temperature directly affecting crop and livestock yields The annual rainfall in the north ranges from almost zero near the border of Egypt to around 200 mm close to the capital Khartoum. Along the southern border, it seldom exceeds 700 mm per year . Hence, the concentration of rainfall in the short growing season and its erratic nature help to create vulnerable conditions for rain-fed agriculture to be sustained. The scale of historical climate change as recorded in north Darfur is almost unprecedented; the reduction in rainfall has turned millions of hectares of already marginal semi-desert grazing land into desert .
The dynamics of vegetation is defined as the change in vegetation during the time according to an appropriate scale of abundance. The type of land use is the main factor dictating the forest and rangeland structures and could be used as an indication to identify forest sites, rangelands areas and communities on ground cover assessment . Measuring and monitoring land cover change are particular challenges on the African continent, where ecological understanding is poor and observational networks are limited . Sudan ranked fourth among twelve of the most destructive countries to their forest resources in the developing countries . Due to the DD rate-determining in forest clearance by 220 m2 per person in a year.
2. Materials and Methods
2.1. Area of Study
The area of study lies within Zallingei locality (Capital of Central Darfur State, western Sudan). Zallingei is located in the south western part of Sudan. It extends from 14.8° - 11.8° East and 24.5° - 22.5° North (Yousif, 2015). The state is bordered by three states, North, South, and West Darfur and both republics of Chad and Central Republic of Africa (Ahmed, 2016). The villages selected were the most affected by climate change and variability. The villages were: Teraj, located in South-west about 37 km from Zallingei city, Orukom, located in South-east 25 km from Zallingei, and Abatta located about 33 km in the corner the Northern-east of Zallinge. Summary of data types and their sources is shown in Table 1.
Table 1. Summary of the data types and their sources.

Data type

Sources

Remark

Satellite imageries (change detection, matrix and NDVI)

Moderate Resolution

Imaging

Spectroradiometer Product from NASA (USGS)

This was used to derive NDVI values, understand the overall trend in rangeland changes, and to examine the relationships between NDVI and climatic variables such as rainfall and temperature (minimum and maximum average).

Climate-related data (rainfall and temperature)

Zallingei and Khartoum meteorological Stations March 2022.

Analyzing the relationships between climatic attributes and the situation of rangelands in the study area and links it with changes of the livelihood of the pastoralists.

2.2. Land Use and Land Cover Change on Rangeland Density in Zallingei Locality
Remote sensing data from satellite images were used to collect data through the US Geological Survey (USGS). It aimed to show how rangeland and pasture resources are being influenced by climate variability over 40 years ranging from 1980 to 2020. For identifying the natural resource changes, multitemporal Landsat images and remotely sensed data were used, whereas satellite images have been chosen to form the Landsat sensors. These images were downloaded from USGS (http://earthexplorer.usgs.gov/) at path 177 and row 53. Landsat 5 (TM), Landsat 7 (ETM+), and Landsat 8 (OLI) images were downloaded for the years 1980, 2000, and 2020, respectively. Landsat images were purposely selected because of their geographical cover and temporal availability. The available Landsat imagery with a spectral band was used in this study is shown Table 2. For data collection and analysis, an integrated approach was used. It is based on remote sensing data as well as other field information concerning the different land-use activities in the study area during the addressed period. Some processing techniques for the images included: (i) radiometric and geometry applied from the sources, (ii) image enhancement, (iii) image classification with supervision of natural resources in the study area, (iv) rate of change in the natural resource, (vi) change detection of natural resources, and (vii) accuracy assessment of image classification.
Table 2. Properties of Landsat data used.

Landsat data

Path/Row

Zone

Datum

Date Acquired

S. Resolution (m)

B. Combination

L5 MSS

192/051

UTM Zone, 34

WGS84

March, 18 1980

30*30

4-3-2-1 NIR- Red - Green - Blue

L7 ETM+

179/051

UTM Zone, 34

WGS84

March, 5 2000

30*30

4-3-2-1 NIR - Red - Green - Blue

L8 (OLI)

179/051

UTM Zone, 34

WGS84

March, 02 2020

30*30

2NIR- Red - Green - Blue

L5 TM = Landsat5 TM, L7 ETM+ = Landsat7 ETM, L8 (OLI) = Landsat8 (OLI), A. data = Acquisition data, S. Resolution (m) = Spatial Resolution (m), B. Combination = Band Combination.
2.3. Processing of Remote Sensed Imagery
The Landsat images were processed as follows:
1) Image registration
Image registration is the process of transforming different sets of data into one coordinate system. Registration is necessary to be able to compare or integrate the data obtained from different measurements. Registration is the process of making an image conforms to another image (a map coordinate system is not necessarily involved).
2) Image enhancement
This process was undertaken to improve the visual interpretability of any image by increasing the apparent distinction between the features in the scene. It aims to create a “new” image from the original image to increase the amount of information that can be visually interpreted from the data. Enhancement operations are normally applied to image data after the appropriate restoration procedures have been performed. Noise removal is an important precursor to most enhancements. Image enhancements are used to make it easier for visual interpretation and understanding of imagery. There are several different techniques and methods of enhancing images such as contrast stretching and spatial filtering to encompass another set of digital processing functions, which are used to enhance the appearance of an image. Contrast enhancement involves changing the original values so that more of the available range is used, thereby increasing the contrast between targets and their backgrounds. This enhances the contrast in the image with light-toned areas appearing lighter and dark areas appearing darker, making visual interpretation much easier. Accordingly, spectral enhancement has been performed on the three images of 1980, 2000, and 2020.
3) Images analyses/classification using visual image interpretation
Visual image interpretation was done before achieving the field survey for interpreting the features of the study area, determining the targets, and setting a plan of work for facilitating the survey task. The visual image, an interpretation was done in the research area by observing the variation of the pattern, shape, texture, association, and size.
4) Images analyses (classification) using unsupervised classification
This is a computerized method without direction from the analyst in which pixels with similar digital numbers are grouped into spectral classes using statistical procedures such as nearest neighbor and cluster analysis. The resulting image may then be interpreted by comparing the clusters produced with maps, air photos, and other materials related to the image site. Images analyses (classification) using supervised classification. In supervised classification, the analyst identifies several areas in an image that represent known features or land cover. These known areas are referred to as ‘training sites’ where groups of pixels are a good representation of the land cover or surface phenomenon. Using the pixel information, the computer programme (algorithm) then looks for other areas, which have a similar grouping and pixel value. The analyst decides on the rainy sites and thus supervises the classification process.
2.4. Estimation of Normalized Differences Vegetation Index (NDVI)
The NDVI is a simple numerical indicator used to analyze the remote sensing measurements and assess whether the target or object being observed contains live green vegetation or not, and the NDVI data were used to assist in identifying various vegetation stages’ dates during seasons . It is considered an ideal indicator, and it is the most popular index being used widely by researchers for assessing vegetation cover and growth. Here, the NDVI was used as an indicator of vegetation cover in the study area. Software ERDAS Imagine 2015 was applied to identify NDVI and their change analyses based on vegetation. Software ArcGIS version 10.7.1 was used for preparing NDVI maps (Younis et al. 2023). The NDVI of all preprocessed images (images of 1985, 2005, and 2020) was calculated by using the following formula used by scholars such as .
3. Results
3.1. Natural Resources Change Detection During the Years 1980-2000-2020
Changes in natural resources were detected using satellite images for the three areas under study during the years 1980-2000-2020. The natural resources included, water bodies, vegetation, herbaceous, forest cover and bare lands.
3.1.1. Atta Village
As shown in Table 3 and confirmed by satellite image (Figure 1) for each year, each parameter of the natural cover was compared to the total natural resources cover. For water bodies, in the year 1980 the area was 171 ha representing 4% of the total area (4816 ha), increased to 7% (345 ha) of the total area (4824 ha) in 2000, decreased to 6% (270 ha) of the total area (4822) in 2020. Vegetation cover was 1455 ha in 1980 representing 30% of the total natural resources cover, decreased to 19% (918 ha) in 2000, declined in 2020 as to represent 18% of the total area corresponding to an area of 876 ha. The bare soil areas percentages increased between 1980, 2000, and 2020, were 25%, 44% and 64% corresponding to 1228 ha, 2143 ha and 2212 ha for the respective years. Herbaceous cover showed percentages as compared to the total areas as: 17, 13, 16% corresponding to 818, 651 and 572 ha showing increases from year 1980 to 2000, but slight decline between 2000 and 2020. For the forest cover the percentage decreases were obtained between 1980 (24%, 1144 ha), 2000 (16%, 767) and 2020 (15%, 712 ha).
3.1.2. Orukum Village
Changes in natural resources areas were shown by (Figure 2 and Table 4). The change for each natural cover was compared as percentage of the total natural resources area. In 1980 Water bodies covered an areas 457 ha representing 20% of the total area (2306 ha), increased to 804 ha (30%) then decreased to 365 ha, representing a 16% of a total area of 2304 ha. Bare soil showed a percentage of 23% (533 ha) in 1980 increased to 32% (866 ha) 2000, then decreased to 25% (571 ha) in 2020. Percent of vegetation cover in 1980 represented 18% (413 ha) of the total area (2306 ha) decreased to 10% (270 ha) in 2000, then increased to 35% (815 ha) of the total area (2304 ha) in 2020. Herbaceous cover represented 32% of the natural resources in 1980, decreased to 14% in 2000 then little increased to 18% in 2020 corresponding to 750, 385, and 415 ha respectively. Forest cover areas represented 7% (153 ha) of the total area of natural resources in 1980 increased to 14%, (379 ha) in 2000, then decreased 6% (138 ha) in 2020.
3.1.3. Teraj Village
As compared to total natural resources areas, water bodies represented 16% (101 ha) of total area 629 ha in 1980. In 2000 total area was the same, but showed a percent decrease in water bodies 7% corresponding to 43 ha. In 2020, the total area increased to 630 ha with the same percent increase in water bodies and corresponding to slight increase (47 ha) in the area. Bare soil percent was 20% in 1980, decreased to 17% in 2000 returned back to 20% in 2020, the corresponding areas in hectares were: 123, 110, 124 ha. Vegetation cover represented 19% of the total area in 1980, increased to 26% and then to 32% for the years 2000 and 2020 corresponding to 116, 161, and 199 ha respectively. Herbaceous cover percent compared to the total area was 25% in 1980 increased highly to 40% in 2000 then sharply decreased to 18% in 2020 corresponding to 161, 250, and 114 ha. The forest cover represented 20% of the total area in 1980 (127 ha), decreased to 10% (65 ha) in 2000 then increased to 23% (146 ha) in 2020 (Figure 3, Table 5).
Table 3. Changes in natural resources (ha) during the years 1980-2000-2020 at Abatta area.

Class name

1980

2000

2020

Area (ha)

%

Area (ha)

%

Area (ha)

%

Water bodies

171

4

345

7

270

6

Vegetation cover

1455

30

918

19

876

18

Bare soil

1228

25

2143

44

2212

46

Forest cover

1144

24

767

16

712

15

Herbaceous cover

818

17

651

13

752

16

Total

4816

100

4824

100

4822

100

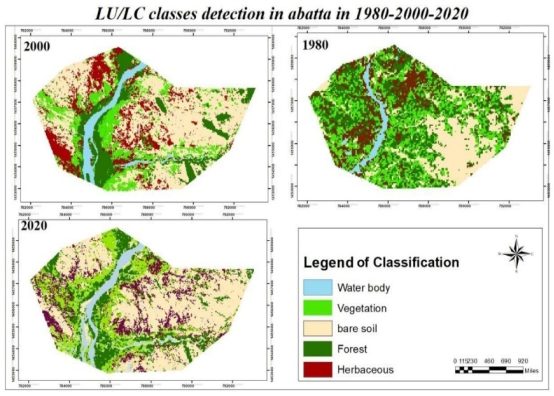
Figure 1. Classification map of natural resources in Abatta area (1980 - 2000 - 2020).
Table 4. Changes in natural resources (ha) during the years 1980-20002020 at in Orukum viiage.

Class name

1980

2000

2020

Area (ha)

%

Area (ha)

%

Area (ha)

%

Water bodies

457

20

804

30

365

16

Vegetation cover

413

18

267

10

815

35

Bare soil

533

23

866

32

571

25

Forest

153

7

379

14

138

6

Herbaceous

750

32

385

14

415

18

Total

2306

100

2701

100

2304

100

Table 5. Changes in natural resources (ha) during the years 1980-2000-2020 at Teraj area.

Class name

1980

2000

2020

Area (ha)

%

Area (ha)

%

Area (ha)

%

Water bodies

101

16

43

7

47

7

Vegetation cover

117

19

161

26

199

32

Bare soil

123

20

110

17

124

20

Forest cover

127

20

65

10

146

23

Herbaceous cover

161

25

250

40

114

18

Total

629

100

629

100

630

100

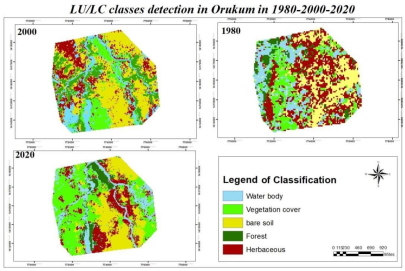
Figure 2. Classification map of natural resources in Orukum area (1980 2000 - 2020).
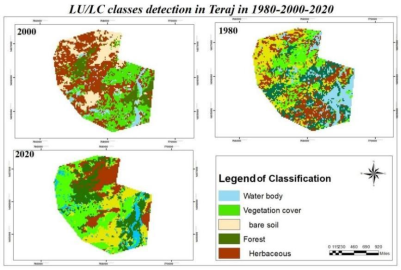
Figure 3. Classification map of natural resources in Teraj area (1980 - 2000 - 2020).
3.2. Net Changes (ha) in Natural Resources for the Three Areas Under Study During the Years (1980 - 2000 - 2020)
The net change for water bodies in the years between 1980 to 2000, was 24% (463 ha) showed little increase (27%, 510 ha) between 2000 to 2020 which accumulated to a significant total net decline (3%, 47 ha) between the years1980 to 2020. For the Herbaceous vegetation the change was 15% (443 ha) between 1980 - 2000, then significantly declined to 0.2% (5 ha) between 2000 2020), with a net total change of 15% (448 ha) between 180 - 2020.
For the Vegetation cover net change between the years 1980 - 2000 was 19% (639 ha) then between 2000 - 2020 with little decline 17% (544 ha) between 1980 - 2020 then a significant total net decrease to 2.5% (95 ha) in between the years 1980 – 2020.
The net change for the Forest cover showed a percent of 8% (213 ha) between 1980 - 2000, an increase to 15% (315 ha) between 2000 - 2020, then a total net increase to 23% (528 ha) between 1980 - 2020 (Table 6).
Table 6. Net changes (ha) in natural resources for the three areas under study during the years (1980 - 2000 - 2020).

Class name

1980 -2000

2000 - 2020

1980 - 2020

Area (ha)

%

Area (ha)

%

Area (ha)

%

Water bodies

463

24

510

27

47

3

Vegetation cover

639

19

544

17

95

2.5

Bare soil

1235

24

212

3.5

1023

21

Forest cover

213

8

315

15

528

23

Herbaceous cover

443

15

5

0.2

448

15

3.3. Climatic Factors and Its Impact on Natural Resources
3.3.1. Effects Temperature
Fluctuations in temperature over a period of four decades are shown in figure 4, it could be seen that annual average temperatures fluctuated around 24 and 26°C with a general trend of increase through the last decades. The minimum temperature ranged between 15 to 16°C for the years 1980, 2000, and 2020. For the same years the range for the maximum temperature was 35 to 36°C, the average ranged around 25°C.
3.3.2. Effect of Rainfall
The annual rainfall during over the last four decades (1980-2020), showed minimum peaks around 245 mm in 1984 and 424 mm in 2008, and maximum peaks around 642 mm in 1988 and 768 mm in 2002, with two similar peaks in 2018 and 2020 (Figure 5). The general trend of annual rainfall during 1980, 2000 and 2020, showed a steady increase from more than 500 mm in 1980 and 2000 to higher increase (≧ 600 mm) in 2020 (Figure 6).
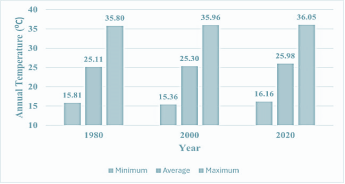
Figure 4. Average annual temperature 1980, 2000 and 2020.
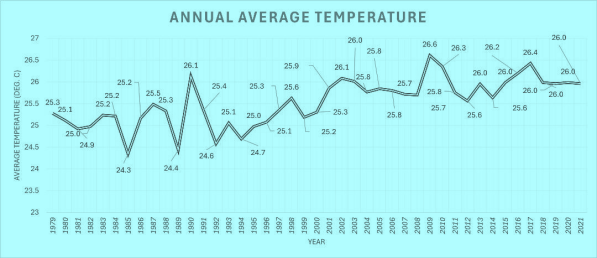
Figure 5. Fluctuations in average temperature over time (1980-2020).
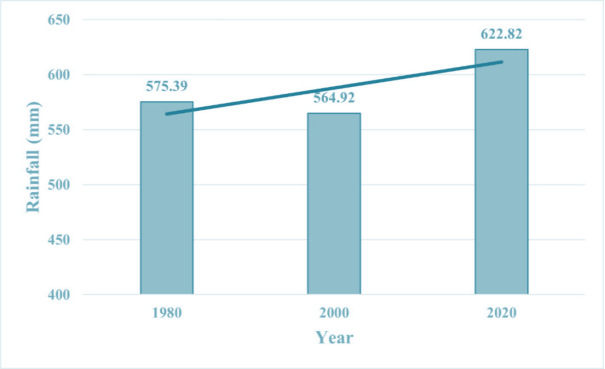
Figure 6. Trend of annual rainfall during 1980, 2000 and 2020.
3.3.3. Correlation Matrix of Natural Resources and Climate Parameters (Temperature and Rainfall)
Correlations for the different parameter under study are shown in Table 7). It could be shown that, there was a high negative (r = - 0.51) correlation between vegetation cover and forest, as well as with average temperature (r = -0.64) but high positive correlations between vegetation cover and herbaceous cover (r = 0.51). Bare soil showed high negative correlations with vegetation cover (r = 0.54) and average temperature (r = - 0.83). Forests were highly positively correlated with vegetation cover (r = 0.51), but highly negatively correlated with average temperature (r = - 0.98) and annual rainfall (r = - 0.82). Herbaceous vegetation was highly (r = 0.83) positively correlated with vegetation cover. Average temperature negatively correlated with annual rainfall (r = - 0.77).
Table 7. Correlation matrix for the natural resources, average temperature and rainfall (1980, 2000, and 2020).

Class

Water bodies

Vegetation cover

Bare soil

forests

Herbaceous vegetation

Average temperature

Vegetation cover

-0.0201

1

-0.517

-0.515

0.512

-0.439

Bare soil

-0.235

- 0.439

1

-0.321

0.453

0.457

Forest

-0.357

0.517

-0.472

1

- 0.472

- 0.982

Herbaceous vegetation

0.237

0.551

-0.491

-0.267

1

- 0.0452

Average temperature

- 0235

- 0.620

-0.294

-0327

- 0.297

1

Annual rainfall

0.643

0.06

-0.830

0.830

0468

0.771

3.3.4. Relationship Between NDVI and Climatic Factors
As shown in Table 8 variations in temperature among the years 1980 and 2020, for the maximum temperature the ranges were between 35.7°C and 36°C, while minimum ranged between 15.1 and 16.9°C, the average ranged between 24.3°C and 26.6°C. For the rainfall, a fluctuation ranges around averages between 562 mm and 623 mm). For the NDVI, for the minimum value, a decline was shown in the year 2000 which coincided with the average (-0.13) and very little change of maximum (0.03).The years 1980 and 2020 showed nearly similar negative values (-0.05, 0.06). For the maximum values, the highest value (0.47) for the year 2020 coinciding with the average which was the highest (0.20) for the same year. For the year 1980, NDVI maximum value was higher (0.10) compared to the average (0.02) (Table 8). A high correlation (R2 =0.53) for the temperature and years were obtained as the general steady increase for the past 40 years (1980 - 2020) for both average (Figure 7) and minimum temperature (Figure 8). For the rainfall the correlations were not strong, although a general trend is seen to increase through the past 40 years (Figure 9).
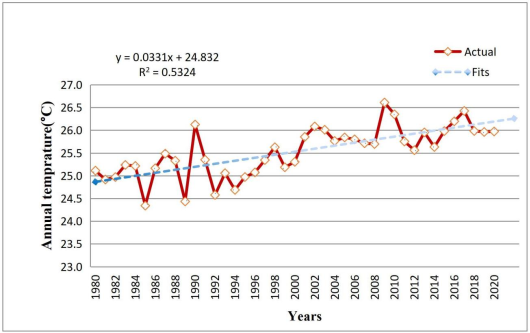
Figure 7. Climate trend analysis: Average temperature for the period between 1980 and 2020.
Table 8. Normalized different vegetation index (Min., Max. and Ave.), temperature (Min., Max. and Ave.) and rainfall (Ave.) values for the years 1980 to 2020.

Years

NDVI

Temperature (°C)

Rainfall (mm)

Min.

Max

Average

Min.

Max

Average

Average

1980

-0.052

0.109

0.028

15.1

35.7

24.3

562

2000

-0.304

0.0303

-0.13

15.3

35.9

25.7

565

2020

-0.063

0.47

0.20

16.9

36.0

26.6

623

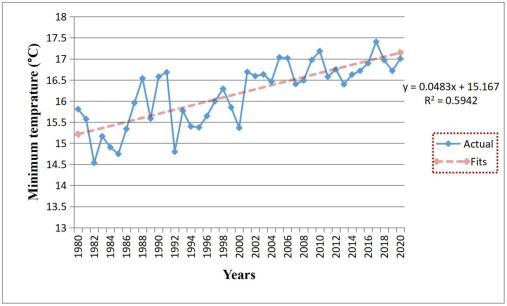
Figure 8. Climate trend analysis: Minimum temperature for the period between 1980 and 2020.
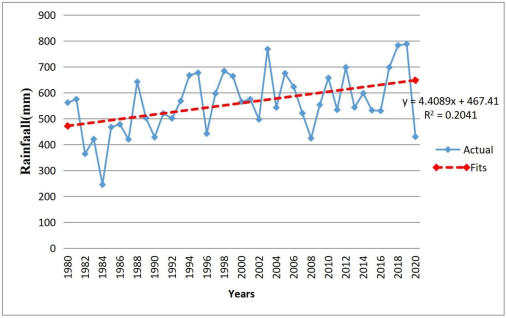
Figure 9. Climate trend analysis: of rainfall (mm) for the period between 1980 and 2020.
4. Discussion
4.1. Climatic Variability
Climate variability (temperature and rainfall) has a clear effect on natural resources (water bodies, vegetation cover, herbaceous and forests). Information collected from the meteorological station at Zallingei for the past 40 years (1980 - 2020) had shown a general tendency in temperature increase for both maximum and minimum measurements in Celsius degree, with highest and lowest temperature, being 36.3°C and 24°C, respectively. observed similar trends for the annual maximum temperature as 45°C in summer in 1990, and a lowest temperature of 24°C during winter in 1985. In this study, the annual rainfall in Zallingei locality varied from 100 mm to 800 mm, with the highest value recorded as 783 mm in 1980 and the lowest at 245 mm in 2020. Fluctuations in rainfall amounts were also noticed by other authors who identified four seasons; the first season from December through February, the second season runs from March through May, the third season runs from June to August and the fourth season from September to November. They showed a variation in the amounts of annual rainfall in some years (e.g. 1982, 1988, 1995, 2002 and 2018). Some years receiving lower than normal and others receiving higher than normal (e.g. 1994, 1996, 2000, 2008, and 2015). They related these abnormalities to uneven distribution of rainfall within the seasons.
4.2. Changes in Natural Resources
The use of NDVI used in this study is widely regarded as one of the most effective methods for monitoring historical changes in vegetation indices . Over the past 30 years, climate change has been manifested through altered precipitation patterns and rising temperatures, as noted by . LULC and vegetation cover can be positively or negatively affected by climate change which are key indicators of local climate change . In this study, supervised classification was performed on three satellite images for the years 1980, 2000, and 2020, to identify differences in vegetation cover in forest, rangeland and pasture. The feature classes were categorized and supervised according to the spectral reflectance of the electromagnetic spectrum. The results of these processes were identified and divided into five groups; (1) water bodies, (2) Vegetation cover, (3) Bare soil, (4) Forest (tree cover) and (5) Herbaceous. The net trend for the three areas under study showed slight decrease in water bodies between 1980 to 2000, then slight increase from 2000 to 2020 which corresponded to amounts of rainfall as shown by meteorological data. The decrease in herbaceous vegetation through the years could be related to animal numbers and carrying capacity. The decrease in vegetation could also be due to expansion of agriculture as increase in population growth rate and to meet the food requirement. The decrease in forest cover could be related to over-cutting of trees for charcoal production as expressed by most of the respondents. The increase in bare lands could be related due over-cutting of trees and consequent desertification. Similar observations were obtained by who related it to land degradation, increase of deforestation, series of drought and expansion of agricultural activities. Furthermore, bare areas in Darfur have consistently increased since 1984 due to several factors, including drought, conflict, and overgrazing .
5. Conclusions
NDVI was used as an indicator of vegetation cover in this study. For the three areas under study there were decreases for water bodies, herbaceous and forest covers. The increase in vegetation cover could be related to the increase in agriculture activities although agricultural areas were not well defined within the NDVI, but it was logic to assume expansion in agriculture at the expense of forest and herbaceous areas in response to human growth and as to meet food requirement. The decrease observed in water bodies, herbaceous and forest cover and hence increase in bare soils could related to climatic variability as rise in temperature and fluctuation in rainfall, where high evaporation due to high temperature and decrease in rainfall negatively impacted the natural resources under study. Human activities as overcutting of trees for charcoal making, mining activities or both led to deforestation, increased wind velocity over bare areas, carrying sand and encouraging sand dune movements, resulting in further deteriorated soil fertility and hence decreasing green cover. Animal activities as overgrazing and over-browsing were additional factors held responsible in rangeland deterioration.
Abbreviations

NDVI

Normalized Differences Vegetation Index

Conflicts of Interest
The authors declare no conflicts of interest.
References
[1] Toulmin, C (2009). Climate Change in Africa, hard copy, Philip Robinson library Newcastle University, UK.
[2] Osman-Elasha, B (2009). Livelihood and drought in Sudan; In Climate change and vulnerability, hard copy Newcastle University.
[3] Serigne T. K,. Louis, V. and Jens, M. (2006). Climate change and variability in the Sahel region: impacts and adaption strategies on in the agriculture sector. UNEP and ICRAF. Accessed online www.icraf.org
[4] Caminade C, Terray L (2010) Twentieth century Sahel rainfall variability as simulated by the ARPEGE AGCM, and future changes. Clim Dyn 35: 75-94.
[5] Suleiman, M. B. K. (2012). Contribution of nonwood forest products in the livelihood of rural communities at Dalanj Locality in South Kordofan State, M. Sc. Thesis College of Graduate Studies, SUST.
[6] NAP (2016). National Adaptation Plan. Minister of Environment, Forestryand Physical Development Khartoum, Sudan.
[7] Tarekegn, B. (2009). Pastoralism and Adaptation to climate change; In Environmental and Conflict in Africa, Refection on Sudan. Edited by Marcel Leroy, University for Peace.
[8] Gadallah, N. A. H, Hano A., and Yagoub Y. (2020). Characterizing Forest Cover Changes Based on Satellite Images cum Forest Dependents’ Data.
[9] UNEP - United Nation Environmental Program (Ed.). (2020). Sudan First State of Environment and Outlook Report 2020.
[10] Gadallah, N. A., Taha, I. S., Hano, A. I., Siddiga, A. A. H., and Bo, H. J. (2022). Integrated Approach for Assessment and Monitoring of Forests Conditions in the Drylands of Sudan. Arid Ecosyst 12, 142-153.
[11] Abdel Magid, T. D., Musa, M. G., and El Mubarak, S. M. (2015). The State of the Sudan Forests' Biodiversity for Food and Agriculture. Sudan’s country report to the state of world biodiversity for food and agriculture.
[12] Yagoub, Y., Li, Z., Musa, O., Anjum, M., Wang, F., Xu, C., and Bo, Z. (2017a). Investigation of Vegetation Cover Change in Sudan by Using Modis Data. Journal of Geographic Information System, 9, 279-292.
[13] Hussain, S., Mubeen, M., Ahmad, A., Masood, N., Hammad, H., Amjad, M., Imran, M., Usman, M., Farid, H., Fahad, S., Nasim, W., Javeed, H., Ali, M., Qaisrani, S., Farooq, A., Khalid, M., and Waleed, M. (2021). Satellite-based evaluation of temporal change in cultivated land in Southern Punjab (Multan region) through dynamics of vegetation and land surface temperature. Open Geosciences, Vol. 13 (Issue 1), pp. 1561-1577.
[14] Hussain A, O,. Kheiry, A, M. Yasin, E, H. (2022). Land-Use Land-Cover Change Detection Using Geospatial Techniques in Zalingei, Central Darfur, Sudan.
[15] Awad, S. S., Rabah, A. A., Ali, H. I., and Mahmoud, T. E. (2018). Acacia seyal gums in Sudan: Ecology and Economic Contribution. Gum Arabic: Structure, Properties, Application, and Economics. Academic Press.
[16] Li, W. (2020). Mapping Urban Impervious Surfaces by Using Spectral Mixture Analysis and Spectral Indices. Remote Sens. 12, 94.
[17] Hussain, S., Mubeen, M., Ahmad, A., Masood, N., Hammad, H., Amjad, M., Imran, M., Usman, M., Farid, H., Fahad, S., Nasim, W., Javeed, H., Ali, M., Qaisrani, S., Farooq, A., Khalid, M., and Waleed, M. (2021). Satellite-based evaluation of temporal change in cultivated land in Southern Punjab (Multan region) through dynamics of vegetation and land surface temperature. Open Geosciences, Vol. 13 (Issue 1), pp. 1561-1577.
[18] Gedefaw, M.; Denghua, Y.; Girma, A (2023). Assessing the Impacts of Land Use/Land Cover Changes on Water Resources of the Nile River.
[19] Ahmed, N, A. A, (2016). Assessment of Woody Vegetation and Natural Regeneration in Zalligei locality, Central Darfur PhD, Thesis College of forestry and range science. SUST. KH. Sudan.
[20] Ahmed, S. A., Kheiry, M. A., and Hassan, I. M., (2018). Impact of Vegetation Cover Changes on Gum Arabic Production Using Remote Sensing Applications in Gedarif State, Sudan. Gum Arabic: Structure, Properties, Application and Economics Gum 29-43:
Cite This Article
  • APA Style

    Yousif, A. A., Mohamed, M. M., Shazali, H. S. (2025). Spatial-Temporal Analysis of Vegetation and Land Cover Changes in Central Darfur Using Remote Sensing Data (1980-2020). American Journal of Life Sciences, 13(4), 117-128. https://doi.org/10.11648/j.ajls.20251304.12

    Copy | Download

    ACS Style

    Yousif, A. A.; Mohamed, M. M.; Shazali, H. S. Spatial-Temporal Analysis of Vegetation and Land Cover Changes in Central Darfur Using Remote Sensing Data (1980-2020). Am. J. Life Sci. 2025, 13(4), 117-128. doi: 10.11648/j.ajls.20251304.12

    Copy | Download

    AMA Style

    Yousif AA, Mohamed MM, Shazali HS. Spatial-Temporal Analysis of Vegetation and Land Cover Changes in Central Darfur Using Remote Sensing Data (1980-2020). Am J Life Sci. 2025;13(4):117-128. doi: 10.11648/j.ajls.20251304.12

    Copy | Download

  • @article{10.11648/j.ajls.20251304.12,
      author = {Alaaeldin Abdelrahman Yousif and Muna Mahjoub Mohamed and Hisham Salaheldein Shazali},
      title = {Spatial-Temporal Analysis of Vegetation and Land Cover Changes in Central Darfur Using Remote Sensing Data (1980-2020)
    },
      journal = {American Journal of Life Sciences},
      volume = {13},
      number = {4},
      pages = {117-128},
      doi = {10.11648/j.ajls.20251304.12},
      url = {https://doi.org/10.11648/j.ajls.20251304.12},
      eprint = {https://article.sciencepublishinggroup.com/pdf/10.11648.j.ajls.20251304.12},
      abstract = {The main research field of the present study is to use remote sensing for the detection of natural resources changes for the past 20 years due to climate change variability in most vulnerable areas in Zallingei, Central Darfur State (western Sudan). The natural resources covered some classes (vegetation, herbaceous, forest cover, bare lands and water bodies). Meteorological data covered 30 years (1980 - 2020) for temperature and rainfall as well as satellite imageries’ for the years, 1981, 2000 and 2020. The geospatial data were downloaded and an analysis using QGIS 3.22.1 and ERDAS 2014 software. The results showed that for the last four decades, the average temperature increased from 30.4 to 30.9°C, while the average rainfall decreased from 460 to 730 mm. The mean NDVI decreased from 0.28 to 0.20. Changes in natural resources in the 3 areas under study and for the years; 1980, 2000 and 2020 revealed that, For Abatta area, percentage changes in water bodies ranged between 4 - 7 and 6% for the corresponding years. Bare soil showed increases as: 25, 44, and 64%. For vegetation cover the range of decreases were; 34, 19 and 18%, herbaceous decreases were: 17, 16, 13%, while forests decreases were 24 to 16 and 15%. For Orukum area, Bare soil percentage changes were: 23 - 12 and 25% for the corresponding years, while water bodies changes ranged as: 20, 30, 16%. For vegetation cover changes were 18, 10, which increased to 38%, while herbaceous decreases ranged as: 32, 14 and 6%, the forest percentage changes ranged between 7, 17 and 6%. For Teraj area, percentage changes in water bodies decreased from 16 to 7% with small changes in bare soils changes (20, 17, and 20%). Vegetation cover percentage increases were: 19, 26 and 32%, while herbaceous changes varied as: 26, 40, and 18% with forest showing changes as: 20, 10, and 23%. There was a high negative (r = - 0.51) correlation between vegetation cover and forest, as well as with average temperature (r = -0.64) but high positive correlations between vegetation cover and herbaceous cover (r = 0.51). Bare soil showed high negative correlations with vegetation cover (r = - 0.54) and average temperature (r = - 0.83). Forests were highly positively correlated with vegetation cover (r = 0.51), but highly negatively correlated average temperature (r = - 0.98) and annual rainfall (r = - 0.82). Herbaceous vegetation was highly (r = 0.83) positively correlated with vegetation cover. Average temperature negatively correlated with annual rainfall (r = - 0.77).
    },
     year = {2025}
    }
    

    Copy | Download

  • TY  - JOUR
    T1  - Spatial-Temporal Analysis of Vegetation and Land Cover Changes in Central Darfur Using Remote Sensing Data (1980-2020)
    
    AU  - Alaaeldin Abdelrahman Yousif
    AU  - Muna Mahjoub Mohamed
    AU  - Hisham Salaheldein Shazali
    Y1  - 2025/09/23
    PY  - 2025
    N1  - https://doi.org/10.11648/j.ajls.20251304.12
    DO  - 10.11648/j.ajls.20251304.12
    T2  - American Journal of Life Sciences
    JF  - American Journal of Life Sciences
    JO  - American Journal of Life Sciences
    SP  - 117
    EP  - 128
    PB  - Science Publishing Group
    SN  - 2328-5737
    UR  - https://doi.org/10.11648/j.ajls.20251304.12
    AB  - The main research field of the present study is to use remote sensing for the detection of natural resources changes for the past 20 years due to climate change variability in most vulnerable areas in Zallingei, Central Darfur State (western Sudan). The natural resources covered some classes (vegetation, herbaceous, forest cover, bare lands and water bodies). Meteorological data covered 30 years (1980 - 2020) for temperature and rainfall as well as satellite imageries’ for the years, 1981, 2000 and 2020. The geospatial data were downloaded and an analysis using QGIS 3.22.1 and ERDAS 2014 software. The results showed that for the last four decades, the average temperature increased from 30.4 to 30.9°C, while the average rainfall decreased from 460 to 730 mm. The mean NDVI decreased from 0.28 to 0.20. Changes in natural resources in the 3 areas under study and for the years; 1980, 2000 and 2020 revealed that, For Abatta area, percentage changes in water bodies ranged between 4 - 7 and 6% for the corresponding years. Bare soil showed increases as: 25, 44, and 64%. For vegetation cover the range of decreases were; 34, 19 and 18%, herbaceous decreases were: 17, 16, 13%, while forests decreases were 24 to 16 and 15%. For Orukum area, Bare soil percentage changes were: 23 - 12 and 25% for the corresponding years, while water bodies changes ranged as: 20, 30, 16%. For vegetation cover changes were 18, 10, which increased to 38%, while herbaceous decreases ranged as: 32, 14 and 6%, the forest percentage changes ranged between 7, 17 and 6%. For Teraj area, percentage changes in water bodies decreased from 16 to 7% with small changes in bare soils changes (20, 17, and 20%). Vegetation cover percentage increases were: 19, 26 and 32%, while herbaceous changes varied as: 26, 40, and 18% with forest showing changes as: 20, 10, and 23%. There was a high negative (r = - 0.51) correlation between vegetation cover and forest, as well as with average temperature (r = -0.64) but high positive correlations between vegetation cover and herbaceous cover (r = 0.51). Bare soil showed high negative correlations with vegetation cover (r = - 0.54) and average temperature (r = - 0.83). Forests were highly positively correlated with vegetation cover (r = 0.51), but highly negatively correlated average temperature (r = - 0.98) and annual rainfall (r = - 0.82). Herbaceous vegetation was highly (r = 0.83) positively correlated with vegetation cover. Average temperature negatively correlated with annual rainfall (r = - 0.77).
    
    VL  - 13
    IS  - 4
    ER  - 

    Copy | Download

Author Information
  • Abstract
  • Keywords
  • Document Sections

    1. 1. Introduction
    2. 2. Materials and Methods
    3. 3. Results
    4. 4. Discussion
    5. 5. Conclusions
    Show Full Outline
  • Abbreviations
  • Conflicts of Interest
  • References
  • Cite This Article
  • Author Information