1. Introduction
Mental health is a crucial aspect of overall well-being, yet it is often overlooked in many healthcare systems, particularly in developing countries like Nigeria. The World Health Organization (WHO) defines mental health as "a state of well-being in which an individual realizes their abilities, can cope with normal life stresses, works productively, and contributes to their community"
| [1] | Wada, Y. H., Rajwani, L., Anyam, E., Karikari, E., Njikizana, M., Srour, L., & Khalid, G. M. (2021). Global mental health and COVID-19: Moving beyond crisis response. The Lancet Global Health, 9(6), e548–e549.
https://doi.org/10.1016/S2214-109X(21)00091-4 |
[1]
. Despite increasing global awareness, mental health issues among students continue to pose significant challenges, affecting their academic performance, social interactions, and future career prospects.
Students experiencing mental health challenges often struggle with concentration, motivation, and adherence to school regulations, sometimes leading to disciplinary actions that further disrupt their education. Factors such as heavy academic workloads, societal expectations, and financial difficulties contribute to the mental health crisis among students. Unfortunately, many cases go undiagnosed and untreated due to limited awareness and inadequate mental health resources.
One frequently overlooked mental health condition is neurasthenia, first described by George Beard in 1869. It is characterised by persistent mental and physical fatigue, headaches, dizziness, muscular aches, inability to relax, irritability, sleep disturbance and cognitive difficulties
. The International Classification of Diseases (ICD-10) defines neurasthenia as a condition marked by distressing complaints of increased fatigue following mental effort or persistent bodily exhaustion after minimal activity. In Western medicine, it has largely been replaced by terms such as chronic fatigue syndrome (CFS) and depressive disorders
| [3] | Abbey, S. E., & Garfinkel, P. E. (1991). Neurasthenia and chronic fatigue syndrome: The role of culture in the making of a diagnosis. The American Journal of Psychiatry, 148(12), 1638–1646. https://doi.org/10.1176/ajp.148.12.1638 |
[3]
. However, in countries like China and some other parts of Asia, neurasthenia remains a recognised mental health condition
| [4] | Myeong, L. H., Yunna, K., & Seung-Hun, C. (2017). Review on diagnostic criteria of neurasthenia: Suggesting pathway of culture-bound diseases. Journal of Pharmacopuncture, 20(4), 230–234. https://doi.org/10.3831/kpi.2017.20.230 |
[4]
.
In Nigeria, research specifically on neurasthenia is scarce. However, its symptoms closely align with Brain Fag Syndrome (BFS), a culture-specific disorder first identified by Raymond Prince in 1960. BFS primarily affects students and presents symptoms such as difficulty thinking, headaches, memory problems, and trouble focusing often triggered by intense academic pressure
| [5] | Aghukwa, C., Baguda, A. S., Fawaz, B., Aminu, I. S., & Gudaji, M. (2024). The brain fag syndrome and its associations: A study among students of Bayero University Kano. The Nigerian Health Journal, 24(2).
https://doi.org/10.60787/tnhj.v24i2.813 |
[5]
. Given the rigorous nature of Nigeria’s education system, many students exhibit signs of both BFS and neurasthenia, yet these conditions are rarely diagnosed or treated appropriately.
Despite its prevalence, there is limited research on the long-term effects of this disorder on students' academic performance and well-being. A major challenge in addressing neurasthenia is the lack of standard diagnostic tools, leading to under-reporting and misdiagnosis. This gap prevents students from receiving the necessary psychological and medical support. Prolonged academic stress and mental exhaustion can have serious consequences, including social withdrawal, academic failure, and, in extreme cases, suicidal tendencies.
Current methods for predicting mental health conditions rely on statistical techniques, machine learning classifiers, and deep learning models
| [6] | Madububambachu, U., Ukpebor, A., & Ihezue, U. (2024). Machine learning techniques to predict mental health diagnoses: A systematic literature review. Clinical Practice & Epidemiology in Mental Health, 20, e5688240607.
https://doi.org/10.2174/0117450179315688240607052117 |
[6]
. Statistical models such as logistic regression provide basic risk assessments but fail to capture the complexity of mental health conditions
| [7] | Deb, A., Samadder, B., Chowdhury, S., Das, S., & Banerjee, S. (2023). Measuring mental health condition using logistic regression. International Journal of Engineering Technology and Management Sciences, 7(2), 40.
https://doi.org/10.46647/ijetms.2023.v07i02.040 |
[7]
. Machine learning approaches, including Support Vector Machines (SVM) and Random Forest, offer improved predictive accuracy
| [6] | Madububambachu, U., Ukpebor, A., & Ihezue, U. (2024). Machine learning techniques to predict mental health diagnoses: A systematic literature review. Clinical Practice & Epidemiology in Mental Health, 20, e5688240607.
https://doi.org/10.2174/0117450179315688240607052117 |
[6]
. More advanced deep learning techniques, such as recurrent neural networks and transformer-based models, can identify intricate psychological and behavioural patterns. However, these models require large, diverse datasets and significant computational resources
| [6] | Madububambachu, U., Ukpebor, A., & Ihezue, U. (2024). Machine learning techniques to predict mental health diagnoses: A systematic literature review. Clinical Practice & Epidemiology in Mental Health, 20, e5688240607.
https://doi.org/10.2174/0117450179315688240607052117 |
| [8] | Arji, G., Erfannia, L., Alirezaei, S., & Hemmat, M. (2023). A systematic literature review and analysis of deep learning algorithms in mental disorders. Informatics in Medicine Unlocked, 41, 101284.
https://doi.org/10.1016/j.imu.2023.101284 |
[6, 8]
.
As global attention on mental health increases, it is essential to address the specific challenges faced by Nigerian university students. This study bridged the gap by developing a fuzzy logic-based model to predict the likelihood of neurasthenia among Nigerian university students. By identifying key risk factors, this research seeks to enhance mental health policies, improve academic support systems, and promote student well-being.
2. Related Works
For the prediction of neurasthenia and related mental health conditions, different computational approaches have been applied, ranging from traditional statistical models to advanced machine learning and fuzzy logic techniques. These studies aim to improve early detection, enhance interpretability, and support effective decision-making in clinical and non-clinical settings. The following section reviews a set of related works, highlighting their scope, strengths, limitations, and the gaps that this study addressed.
Hussain
et al. developed a predictive model for identifying neurasthenia in post-COVID patients using a variety of machine learning algorithms including Random Forest, Decision Trees, Naive Bayes, Logistic Regression, Gradient Boost, Support Vector Machines (SVM), and AdaBoost, along with PCA for dimensionality reduction. Among these, the Random Forest classifier outperformed the others with an accuracy of 92%. The study was, however, limited to post-COVID patients and did not extend to non-clinical populations like students
| [9] | Hussain, F., Shofiq, M., Sarkar, M. J., & Ferdosi, B. J. (2023). A machine learning model for predicting neurasthenia in post-COVID patients based on their baseline characteristics. In Proceedings of the 2023 International Conference on Neural Computing and Information Management (NCIM) (pp. 10212690). IEEE. https://doi.org/10.1109/NCIM59001.2023.10212690 |
[9]
. This study addresses this gap by focusing on, a population where academic stress and fatigue are more relevant risk factors for neurasthenia.
Dang
et al. compared neurasthenia and major depressive disorder (MDD) using EEG data to assess neurophysiological differences between the two conditions. The study included 305 neurasthenia patients and 45 MDD patients and found that individuals with neurasthenia had significantly lower theta brainwave connectivity and reported more somatic symptoms than emotional ones. Classification models such as Random Forest, Logistic Regression, SVM, and K-Nearest Neighbors were applied to distinguish between both conditions. Random Forest yielded the highest accuracy of 93%, with an AUC of 0.97. However, the study was retrospective in design and involved a smaller MDD sample size, which limited its generalizability.
| [10] | Dang, G., Zhu, L., Lian, C., Zeng, S., Shi, X., Pei, Z., Lan, X., Shi, J. Q., Yan, N., Guo, Y., & Su, X. (2025). Are neurasthenia and depression the same disease entity? An electroencephalography study. BMC Psychiatry, 25, 2468.
https://doi.org/10.1186/s12888-025-06468-1 |
[10]
Unlike this study, which does not rely on neurophysiological data but instead uses non-invasive, easily collectable academic and lifestyle risk factors, making it more practical for early detection in student populations.
Dooshima
et al. proposed a predictive model for assessing the risk of mental illness within the Nigerian context. The study utilized Decision Trees and Naive Bayes classifiers, with the Decision Tree model performing better at an accuracy of 83.3% compared to 76.7% for Naive Bayes
| [11] | Dooshima, M. P., Chidozie, E. N., Ademola, B. J., Sekoni, O. O., & Idowu, P. A. (2018). A predictive model for the risk of mental illness in Nigeria using data mining. International Journal of Immunology, 6(1), 5–16.
https://doi.org/10.11648/j.iji.20180601.12 |
[11]
. The model was effective in identifying high-risk individuals based on selected attributes but was restricted in scope to general mental illness rather than specific conditions such as neurasthenia. This study narrows this gap by focusing specifically on neurasthenia, providing a condition-specific model rather than a generalized one.
Brathwaite
et al. focused on predicting the risk of future depression among school-attending adolescents in Nigeria. They employed logistic regression with penalized maximum likelihood estimation to build their model, which was originally developed from a 1993 Brazilian adolescent cohort study involving 11 predictors. The model was later adapted by removing four predictors not available in the Nigerian dataset
| [12] | Brathwaite, R., Rocha, T. B.-M., Kieling, C., Kohrt, B. A., Mondelli, V., Adewuya, A. O., & Fisher, H. L. (2020). Predicting the risk of future depression among school-attending adolescents in Nigeria using a model developed in Brazil. Psychiatry Research, 294, 113511.
https://doi.org/10.1016/j.psychres.2020.113511 |
[12]
. This study on a fuzzy logic model specifically tailored to neurasthenia among university students in Nigeria.
Ahmed
et al. developed a fuzzy logic–based system for identifying the likelihood of COVID-19 in patients based on neurological symptoms such as headache, anomia-dysguesia, fatigue, and dizziness. Using triangular membership functions and statistical analysis of thousands of clinical cases, the model achieved 95% accuracy when validated against real clinical data
| [13] | Ahmed, M. A. O., Azim, G. S. A., & Elsayed, Y. (2024). Prediction of COVID-19 based on neurological manifestations using a fuzzy logic system. Egyptian Journal of Neurology, Psychiatry and Neurosurgery, 60(1), 141.
https://doi.org/10.1186/s41983-024-00916-7 |
[13]
. The study was limited to COVID-19 patients and did not extend to broader mental health applications such as neurasthenia. This study extends fuzzy logic applications to neurasthenia prediction, adapting the technique for academic and psychological risk factors in students rather than clinical viral cases.
Hudon, proposed a hybrid fuzzy logic–machine learning model to predict outcomes of involuntary psychiatric treatment orders in Quebec. The system combined a Mamdani-type fuzzy inference system with a Random Forest classifier, achieving 98.1% accuracy, 93.3% precision, 100% recall, and a 96.6 F1 score
| [14] | Hudon, A. (2025). A hybrid fuzzy logic–Random Forest model to predict psychiatric treatment order outcomes: An interpretable tool for legal decision support. Frontiers in Artificial Intelligence, 8, 1606250. https://doi.org/10.3389/frai.2025.1606250 |
[14]
. The model demonstrated interpretability and highlighted influential predictors such as duration of court orders and age. However, the study was restricted to legal psychiatric decisions and has not been applied to student populations or early mental health prediction. This study fills this gap by applying fuzzy logic in the context of preventive student mental health care, particularly for neurasthenia.
Saha
et al. designed a fuzzy inference model for predicting depression severity based on emotional states and daily activities, such as sleep patterns and pessimistic thinking. Using linguistic membership functions (poor, mediocre, average, decent, and good) and fuzzy rules, the model classified depression levels with 94% accuracy. While effective for depression detection, the study was limited to depression data collected via surveys and did not address neurasthenia or related fatigue-based disorders
| [15] | Saha, U., Hossain, S. M. M., & Sarker, I. H. (2024). Predicting depression level based on human activities and feelings: A fuzzy logic-based analysis. Data Science and Management, 4, 11–19. https://doi.org/10.1016/j.dsm.2024.11.003 |
[15]
. This study builds on this by applying fuzzy logic to neurasthenia, using academic, psychological, and lifestyle-related factors that are highly relevant to Nigerian students.
3. Methods
To develop a predictive model for neurasthenia, several risk factors were identified through a comprehensive review of literature on mental health, neurasthenia, and related conditions like Brain Fag Syndrome (BFS), which is prevalent among Nigerian students. Each identified risk factor was assessed for its relationship with neurasthenia, with some factors increasing the likelihood and others potentially mitigating it.
Crisp values were assigned to each risk factor to quantify user responses, with higher values indicating a greater association with neurasthenia and lower values indicating a reduced likelihood. These crisp values were mapped to linguistic variables, which served as nominal tags for formulating fuzzy membership functions. The risk factors identified included academic stress, sleep quality, socioeconomic status, and others, reflecting the academic and social pressures faced by Nigerian students.
3.1. Description of Identified Risk Factors
The identified risk factors associated with neurasthenia were described to clarify their impact on the likelihood of the condition. The likelihood of neurasthenia was determined as a cumulative effect of the values assigned to each risk factor. The risk factors associations with neurasthenia include. academic stress, sleep quality, socioeconomic status, study habits, psychostimulant use, and emotional distress,
3.2. Identification of Crisp and Linguistic Values of Associated Variables
Following the identification of risk factors, linguistic variables and crisp values were defined for each.
Table 1 summarizes the crisp values and linguistic variables for each risk factor. Crisp values of 0, 1, and 2 were assigned, with 2 representing the highest association with neurasthenia and 0 the lowest. Each risk factor was discretized into three linguistic variables to facilitate fuzzification.
Table 1. Identification of Crisp and Linguistic Values of Risk Factors.
Risk Factor | Linguistic Variable | Crisp Value |
Academic Stress | Low | 0 |
| Moderate | 1 |
| High | 2 |
Sleep Quality | Poor | 0 |
| Average | 1 |
| Good | 2 |
Socioeconomic Status | Low | 0 |
| Middle | 1 |
| High | 2 |
Study Habits | Poor | 0 |
| Mixed | 1 |
| Structured | 2 |
Psychostimulants use | None | 0 |
| Occasional | 1 |
| Regular | 2 |
Emotional Distress | Low | 0 |
| Moderate | 1 |
| High | 2 |
The risk factors were classified as follows: academic stress was divided into low, moderate, and high; sleep quality into good, average, and poor; socioeconomic status into high, middle, and low; study habits into structured, mixed, and poor; psychostimulant use into none, occasional, and regular; and emotional distress into low, moderate, and high. These classifications guided the formulation of the fuzzy logic model.
3.3. Method of Fuzzy Logic Model Formulation for Likelihood of Neurasthenia
The predictive model for the likelihood of Neurasthenia in Nigerian students was formulated using the MATLAB Fuzzy Logic Toolbox (R2024b). Each identified risk factor was fuzzified using triangular membership functions. These functions require three parameters: the left-hand base (a), the central apex (b), and the right-hand base (c), The triangular membership function provides a simple way to convert crisp input into fuzzy values. Three fuzzy sets were defined for each input variable corresponding to crisp values 0, 1, and 2. The development of the Fuzzy Inference System (FIS) model involved four key subprocesses: Fuzzification, Rule Production, Aggregation, and Defuzzification. The FIS model was designed to accept user inputs corresponding to the identified risk factors of Neurasthenia in Nigeria.
Since each risk factor had three linguistic variables, three triangular membership functions were formulated for each, based on the mathematical expression in Equation (
1):
(1)
Crisp intervals for fuzzification:
0 → (-0.5, 0, 0.5)
1 → (0.5, 1, 1.5)
2 → (1.5, 2, 2.5)
3.3.1. Membership Functions of the Fuzzy Inference System Model
In fuzzy logic, a membership function maps input values to a degree of membership within the universe of discourse, ranging between 0 and 1. The shape of the membership function is chosen based on simplicity, computational efficiency, and suitability for the problem. For this study, the triangular membership function, as implemented in the MATLAB Fuzzy Logic Toolbox, was used for all variables. The triangular membership function in MATLAB is expressed as:
or more specifically as:
The mathematical representation of a triangular membership function with base points and , and an apex at (where ) such that , and are real numbers and is given by:
(4)
Alternatively, this can be expressed more compactly as:
(5)
Here, and define the base of the triangle, while represents the peak. In fuzzy logic, a fuzzy set extends the concept of a classical set. If is the universe of discourse and its elements are denoted by , a fuzzy set in is defined as a set of ordered pairs:
where is the membership function of in , mapping each element of to a membership value between 0 and 1. This study leverages these principles to predict the likelihood of Neurasthenia in Nigerian students.
3.3.2. Fuzzification Process in the Fuzzy Logic Model
Fuzzification converts crisp input data into degrees of membership by mapping each input value to a membership function. In this study, the triangular membership function (Equation (
1)) from the MATLAB Fuzzy Logic Toolbox was used to define the membership degrees for each of the six (6) input variables. During fuzzification, each input is evaluated against the conditions of the fuzzy rules to determine its degree of fit.
3.3.3. Rule Production for the Fuzzy Logic Model
At this stage, the truth value of each fuzzy rule was computed and applied to the corresponding output. The rule-based system for the Neurasthenia likelihood prediction model uses 6input variables and one output variable as the conditions and conclusion of the rules.
To decide how true a rule is, the fuzzy logic system looks at the fuzzified membership found, and that value is the firing strength (denoted by
) of the rule. If multiple inputs are combined with AND, MATLAB takes the minimum as stated in equation (
7) below.
(7)
A typical rule inferred is as follows:
IF (Academic_Stress = “Low”) AND (Sleep_Quality = “Good”) AND (Socioeconomic_Status = “High”) AND (Study_Habits = “Structured”) AND (Psychostimulant_Use = “None”) AND (Emotional_Distress= “Low”) THEN (Likelihood_of_Neurasthenia = “Low Risk”)
Given the number of membership functions for each input variable:
Academic Stress: 3 (Low, Moderate, High)
Emotional Distress: 3 (Low, Moderate, High)
Socioeconomic Status: 3 (Low, Middle, High)
Psychostimulant Use: 3 (None, Occassional, Regular)
Sleep Quality: 3 (Poor, Average, Good)
Study Habits: 3 (Poor, Mixed, Structured)
The total number of possible rules are:
Therefore, 729 rules were created to determine the likelihood of Neurasthenia. The rule production process is summarized as:
Rule Production: If (var 1 = label) AND (var 2 = label) AND... AND (var = label) THEN (Neurasthenia Outcome = label)
Academic Stress:
Emotional Distress:
Socioeconomic Status:
Psychostimulant Use:
Sleep Quality:
Study Habits:
Table 2. Description of Crisp Intervals Used During Fuzzy Model Formulation.
Crisp value | Interval | a | b | c |
0 | (-0.5, 0.5) | -0.5 | 0 | 0.5 |
1 | (0.5, 1.5) | 0.5 | 1 | 1.5 |
2 | (1.5, 2.5) | 1.5 | 2 | 2.5 |
Table 3. Formulation of the Likelihood of Neurasthenia.
Target Class | Interval | a | b | c |
Low Risk | (1.5, 2.5) | 1.5 | 2 | 2.5 |
Moderate Risk | (0.5, 1.5) | 0.5 | 1 | 1.5 |
High Risk | (-0.5, 0.5) | -0.5 | 0 | 0.5 |
3.4. Simulation Environment
The predictive model for the likelihood of Neurasthenia in Nigerian students was simulated using the MATLAB Fuzzy Logic Toolbox (R2024b). MATLAB is a high-performance language for technical computing, integrating computation, visualization, and programming in an easy-to-use environment where problems and solutions are expressed in familiar mathematical notation. Toolboxes are comprehensive collections of MATLAB functions, commands, and solvers that expand the MATLAB environment to solve particular classes of problems. The Fuzzy Logic Toolbox™ provides MATLAB functions, graphical tools, and a Simulink block for analyzing, designing, and simulating systems based on fuzzy logic.
4. Results and Discussion
This section presents the results of the formulation of the fuzzy logic model using triangular membership functions based on the crisp intervals defined for each linguistic variable identified in this study. In this research, a Fuzzy Inference System (FIS) was developed to predict the likelihood of neurasthenia in Nigerian university students. The development process included identification of risk factors, fuzzification of inputs, rule-base creation, and model simulation in MATLAB.
4.1. Results of the Identification of Variables Used for Risk Assessment
Using the description of the crisp intervals defined for each risk factor and the target class as presented in
Table 4 below, the table shows each risk factor alongside the linguistic variables that were used to formulate the labels. As shown in the table, their respective labels were defined using crisp intervals such that the values 0, 1, and 2 were used as centers for each input variable, while the values 0, 1, 2 were used as centers for the output variable describing the likelihood of neurasthenia.
For example, academic stress was formulated using triangular membership functions with centers 0, 1, and 2 for the categories Low, Moderate, and High, respectively. Similarly, sleep quality was defined with centers 0, 1, and 2 corresponding to Good, Average, and Poor sleep. Socioeconomic status was formulated using the triangular membership function with centers 0, 1, and 2 for Low, Middle, and High. Study habits were was formulated using the triangular membership function with centers 0, 1, and 2 for Poor, Mixed, and Structured. Psychostimulant use was formulated using the triangular membership function centers 0, 1, and 2 for None, Occasional, and Regular, while emotional distress was formulated using the triangular membership function with centers 0, 1, and 2 for Low, Moderate, and High. Finally, the output variable (risk of neurasthenia) was formulated using triangular membership functions with centers 2, 1, 0 corresponding to Low likelihood, Moderate likelihood, and High likelihood of Neurasthenia, respectively.
Table 4. Linguistic Variable and Fuzzy Interval of Risk Factors.
Risk Factor | Linguistic Variable | Fuzzy Interval |
Academic Stress | Low | [-0.5, 0, 0.5] |
| Moderate | [0.5, 1, 1.5] |
| High | [1.5, 2, 2.5] |
Sleep Quality | Poor | [-0.5, 0, 0.5] |
| Average | [0.5, 1, 1.5] |
| Good | [1.5, 2, 2.5] |
Socioeconomic Status | Low | [-0.5, 0, 0.5] |
| Middle | [0.5, 1, 1.5] |
| High | [1.5, 2, 2.5] |
Study Habits | Poor | [-0.5, 0, 0.5] |
| Mixed | [0.5, 1, 1.5] |
| Structured | [1.5, 2, 2.5] |
Psychostimulants use | None | [-0.5, 0, 0.5] |
| Occasional | [0.5, 1, 1.5] |
| Regular | [1.5, 2, 2.5] |
Emotional Distress | Low | [-0.5, 0, 0.5] |
| Moderate | [0.5, 1, 1.5] |
| High | [1.5, 2, 2.5] |
Result | High likelihood | [-0.5, 0, 0.5] |
| Moderate likelihood | [0.5, 1, 1.5] |
| Low likelihood | [1.5, 2, 2.5] |
4.2. Results of the Fuzzy Logic Model Formulation
This section presents the results of the formulation of the fuzzy logic model using triangular membership functions based on the crisp intervals defined for each linguistic variable identified in this study. The development process involved using three (3) labels as membership functions for each input variable. The allocation of crisp values was based on the increasing effect of the identified factors. The triangular membership function for each linguistic variable is expressed mathematically in equation (
8).
Crisp-label_0(x;-0.5,0,0.5)=(8)
Crisp-label_1(x;0.5,1,1.5)=(9)
Crisp-label_2(x;1.5,2,2.5)=(10)
4.3. Result of the Simulation for the Formulated Fuzzy Logic Model
The fuzzy model was simulated using MATLAB R2024b Fuzzy Logic Toolbox. The FIS contained six input variables and one output variable (neurasthenia likelihood). Membership functions were created for each input using the intervals defined above.
Using the triangular membership functions stated in equations (
8) to (
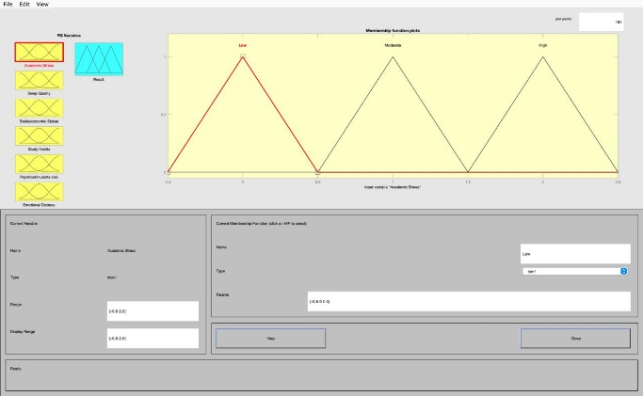
10), the labels of the identified risk factors were formulated. Therefore, the results of the formulation of the model for the academic stress of student is shown in
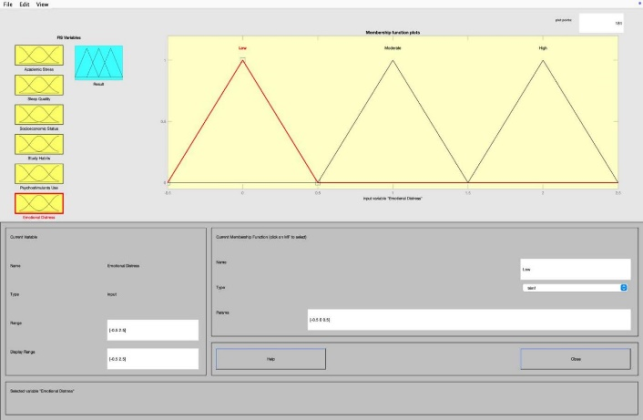
Figure 1 such that the interval [-0.5, 0.5] was used to model low stress, [0.5, 1.5] was used to model moderate stress while [1.5, 2.5] was used to model high academic stress level. The results of the formulation of the model for the student’s Emotional distress is shown in
Figure 2 such that the interval [-0.5, 0.5] was used to model low distress, [0.5, 1.5] was used to model moderate distress while [1.5, 2.5] was used to model high distress level.
The results of the formulation of the model for the student’s Socioeconomic status is shown in
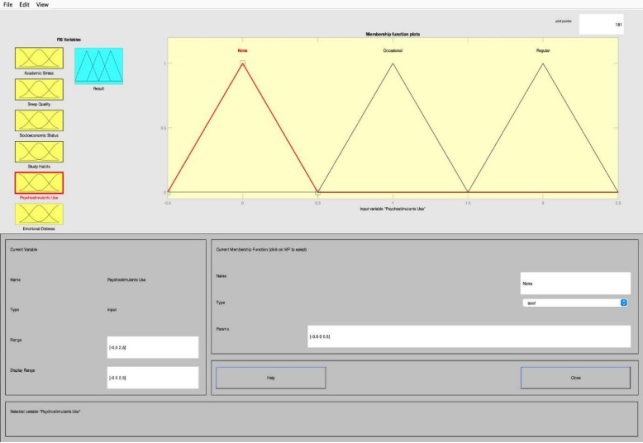
Figure 3 such that the interval [-0.5, 0.5] was used to model low, [0.5, 1.5] was used to model middle while [1.5, 2.5] was used to model high status. The results of the formulation of the model for the student’s Psychostimulant use is shown in
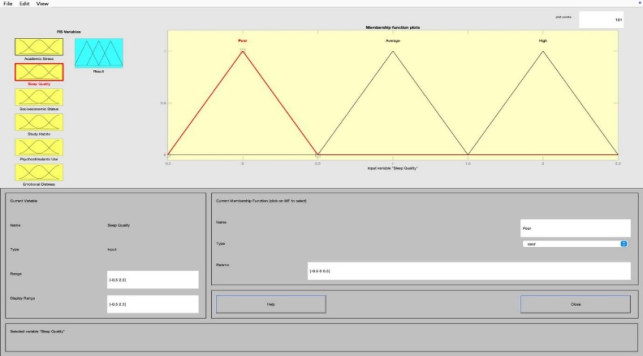
Figure 4 such that the interval [-0.5, 0.5] was used to model none, [0.5, 1.5] was used to model occasional while [1.5, 2.5] was used to model regular. The results of the formulation of the model for the student’s Sleep quality is shown in
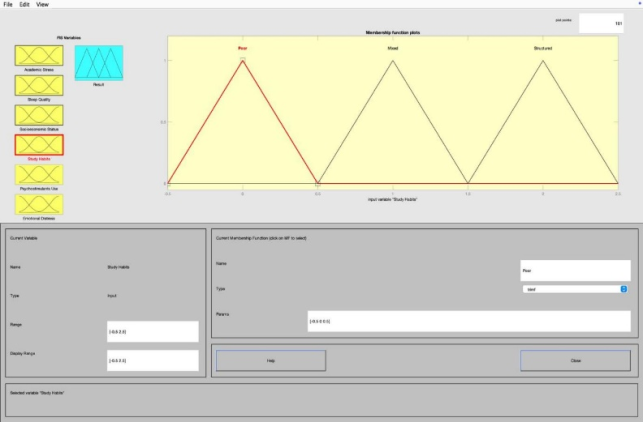
Figure 5 such that the interval [-0.5, 0.5] was used to model poor, [0.5, 1.5] was used to model average while [1.5, 2.5] was used to model high. The results of the formulation of the model for the student’s Study habits is shown in
Figure 6 such that the interval [-0.5, 0.5] was used to model poor, [0.5, 1.5] was used to model mixed while [1.5, 2.5] was used to model structured. Using the 3 triangular membership functions stated in equations (
8) to (
10), the labels of the target class used to define the likelihood of Neurasthenia was formulated.
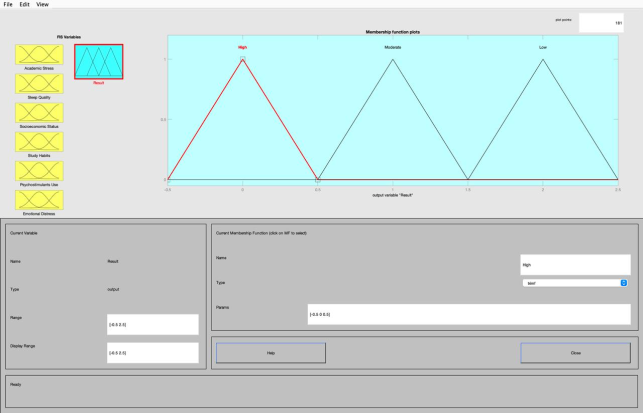
Figure 7 presents the formulation of the output variable, Neurasthenia Likelihood, within the fuzzy inference system (FIS) developed to predict the likelihood of neurasthenia using MATLAB’s Fuzzy Logic Toolbox. The output variable is represented with triangular membership functions across three fuzzy sets: High Likelihood spanning [−0.5, 0, 0.5], Moderate Likelihood covering [0.5, 1, 1.5], and Low Likelihood extending across [1.5, 2, 2.5]. These functions provide smooth transitions between categories, reflecting the uncertainty inherent in mental health prediction. The plot illustrates the membership degree (0–1) against the likelihood values, with the FIS editor displaying the parameters and properties of each membership function. This formulation represents the final defuzzification step of the Mamdani fuzzy inference system, where the centroid method aggregates outputs from 729 rules derived from six input variables (Academic Stress, Sleep Quality, Socioeconomic Status, Study Habits, Psychostimulant Use, and Emotional Distress) into a crisp likelihood classification.
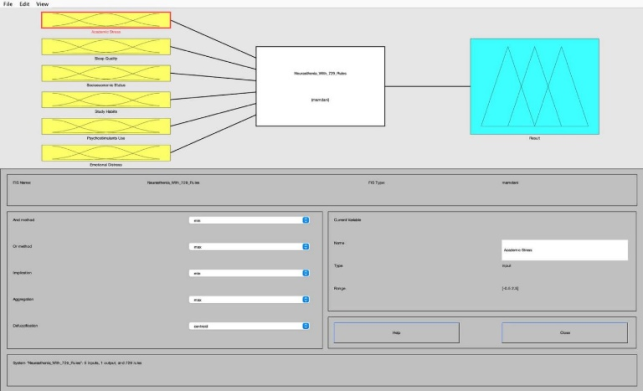
Figure 8 depicts the Fuzzy Inference System (FIS) model constructed for classifying the likelihood of neurasthenia using the MATLAB Fuzzy Logic Toolbox (R2024b). The left section of the figure lists the six input variables, represented as rectangular blocks, which include Academic Stress, Sleep Quality, Socioeconomic Status, Study Habits, Psychostimulant Use, and Emotional Distress. Each input is connected by arrows to the central FIS block labeled “Neurasthenia-With-729-Rules,” indicating the flow of data from the inputs into the fuzzy inference engine. This block encapsulates the fuzzification, rule evaluation, aggregation, and defuzzification processes, with the “Mamdani” type specified, signifying the use of the Mamdani inference method. The FIS block’s properties are detailed in the bottom panel, including and Method (“min”), Or Method (“max”), Implication (“min”), Aggregation (“max”), and Defuzzification (“centroid”), which are standard configurations for handling uncertainty in fuzzy predictive models. On the right side, the membership function plot for the output variable “Neurasthenia Likelihood” is shown, featuring three triangular membership functions (trimf) labeled Low, Moderate, and High, spanning the range [0 2]. The High MF is defined as [-0.5 0 0.5], peaking at 0; the Moderate MF as [0.5 1 1.5], peaking at 1; and the Low MF as [1.5 2 2.5], peaking at 2.
The bottom sections include FIS properties, the current variable selection (e.g., “Academic Stress” as Input), and membership function editor controls for adjusting parameters such as Name, Type, Range, and Help/Close options. Overall, this figure illustrates the system’s architecture, highlighting how multiple risk factors are processed through fuzzy logic to predict the likelihood of neurasthenia, thereby providing a clear visual overview of how inputs, rules, and output classification are integrated into the model.
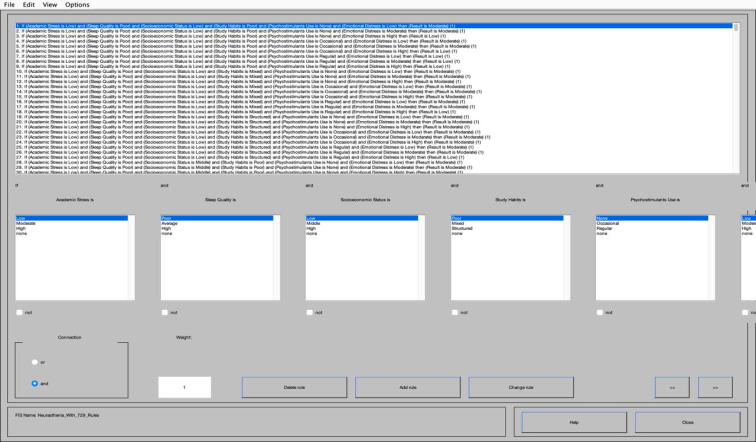
Figure 9 illustrates the Fuzzy Logic Rule Editor within MATLAB’s Fuzzy Logic Toolbox, used to manage the rule base for predicting the likelihood of neurasthenia. A total of 729 rules were formulated to capture the relationships between the six identified risk factors: Academic Stress, Sleep Quality, Socioeconomic Status, Study Habits, Psychostimulant Use, and Emotional Distress and the output variable Neurasthenia Likelihood (Low, Moderate, or High). Each rule follows an “if–then” structure, for example: “If Academic Stress is High and Sleep Quality is Poor and Socioeconomic Status is Low, then Neurasthenia Likelihood is High.” The rule editor presents these rules in a tabular form, listing rule numbers, antecedents (input conditions), and consequents (output classifications), with tools available to add, modify, or validate rules. This extensive rule base ensures that the model can accommodate diverse combinations of student profiles, effectively encoding expert reasoning into the fuzzy inference system.
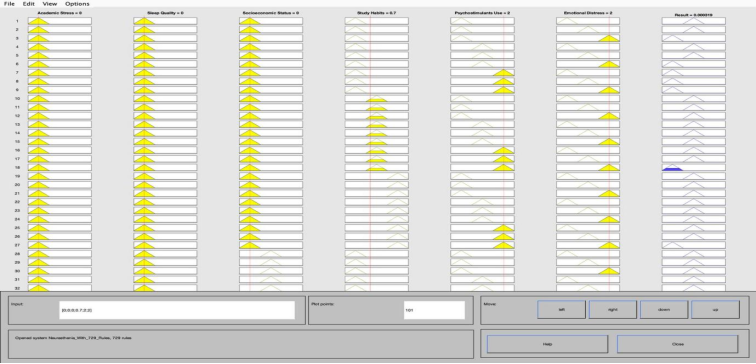
Figure 10 presents the Rule Viewer interface, demonstrating how the fuzzy inference system (FIS) processes specific input values to predict the likelihood of neurasthenia. The interface arranges the six input variables (Academic Stress, Sleep Quality, Socioeconomic Status, Study Habits, Psychostimulant Use, and Emotional Distress) into columns, with the final column representing the output variable Neurasthenia Likelihood (Low, Moderate, or High). Input sliders allow crisp values to be entered such as [0, 0, 0, 0.7, 2, 2] representing Low Academic Stress, Poor Sleep, Low Socioeconomic Status, Poor Study Habits, Regular Psychostimulant Use, and High Emotional Distress. These inputs are then fuzzified into degrees of membership, with activated linguistic terms highlighted. The central grid shows which rules were triggered based on these conditions, and the bottom panel displays the aggregated output membership function. The red vertical line marks the crisp output derived through centroid defuzzification, corresponding to the final likelihood classification. This figure provides a transparent view of how the model integrates multiple risk factors into a single predictive outcome, demonstrating both interpretability and practical utility. The results of the test showed that the result of the likelihood of Neurasthenia was High owing to the values shown for the likelihood of Neurasthenia. This results were consistent with the results presented in rules provided to the inference engine by the expert.
Figure 1. Formulation of the student's Academic Stress.
Figure 2. Formulation of the student's Emotional Distress.
Figure 3. Formulation of the student's Socioeconomic status.
Figure 4. Formulation of the student's Psychostimulant Use.
Figure 5. Formulation of the student's Sleep Quality.
Figure 6. Formulation of the student's Study Habits.
Figure 7. Formulation of the likelihood of Neurasthenia.
Figure 8. Fuzzy Logic Model for the Classification of likelihood of Neurasthenia.
4.4. Discussion
As stated earlier in this study, the fuzzy logic model for the likelihood of Neurasthenia was required to manipulate the values of the identified risk factors by using IF-THEN rules to construct a relationship between the risk factors and the likelihood of Neurasthenia. This was done by identifying all the risk factors alongside their respective values which was 3 for each risk factors. The fuzzification process employed triangular membership functions to map crisp inputs into fuzzy values. Each input factor was modeled with three overlapping membership functions, while the output variable was modeled with three membership functions corresponding to the three risk levels. The fuzzy inference system was then constructed in MATLAB R2024b using these definitions and a rule base generated from combinations of input variables.
The fuzzy logic model constructed in this study was designed to evaluate the likelihood of neurasthenia based on six input risk factors. Each factor was represented by triangular membership functions defined over crisp intervals [0, 2], corresponding to Low, Moderate, and High categories. The overlapping ranges ensured that the model could capture uncertainty at intermediate values, reflecting the gradual transitions that occur in real-world student experiences. The output variable, likelihood of neurasthenia, was likewise defined with three triangular membership functions representing Low likelihood, Moderate likelihood, and High likelihood. The discussion below interprets the behavior of the model across the defined crisp values and explains how each range contributes to prediction outcomes.
When the crisp input or output value is at 0, it coincides with the peak of the first triangular membership function defined as [-0.5, 0, 0.5]. At this point, the membership degree is 1 for the lowest linguistic category (e.g., Low Stress, Good Sleep, High Socioeconomic Status, Structured Study Habits, No Stimulant Use, or Low Emotional Distress) and 0 for all others. This indicates complete and unambiguous belonging to the most favorable category for protective factors, or the least severe category for risk factors. For example, an academic stress level of 0 represents a student experiencing little to no academic pressure, contributing strongly to Low Risk of neurasthenia. Similarly, a value of 0 for stimulant use implies abstinence, which protects against fatigue and dependence. At this crisp point, the value contributes fully to rules associated with the first category and excludes all others.
When the crisp value is at 0.5, the input lies within the overlap between the first and second triangular membership functions, defined as [0, 0.5, 1] for the first slope and [0.5, 1, 1.5] for the second. At this position, the membership degree is shared between the Low and Moderate categories, usually split around 0.5 each. This partial classification reflects uncertainty where the variable cannot be assigned exclusively to one category. For instance, a sleep quality value of 0.5 suggests a student whose rest is inconsistent, sometimes restorative, sometimes disrupted, placing them partly in the “Good” group but also partly in “Average.” Similarly, academic stress at 0.5 indicates occasional or mild stress, neither entirely absent nor fully moderate. This overlap allows the model to handle real-life ambiguity, capturing intermediate states instead of enforcing rigid cutoffs.
When the crisp value is at 1, it corresponds to the peak of the middle triangular membership function [0.5, 1, 1.5]. At this point, the membership degree is 1 for the Moderate category (e.g., Moderate Stress, Average Sleep, Middle Socioeconomic Status, Mixed Study Habits, Occasional Stimulant Use, or Moderate Emotional Distress) and 0 for all others. This represents a balanced state between extremes, where the risk factor is present but not severe. For instance, a socioeconomic status value of 1 describes students from middle-income backgrounds who face some financial challenges but are not under severe hardship. Similarly, academic stress at 1 indicates a typical workload that is demanding but manageable. At this stage, the model consistently places students in the Moderate Risk category, capturing transitional states that neither guarantee safety nor indicate crisis.
When the crisp value is at 1.5, the variable falls within the overlap between the middle and highest triangular membership functions, defined as [0.5, 1.5, 2.5] for the latter. At this point, the membership is divided between the Moderate and High categories, creating a condition of partial classification. For example, study habits at 1.5 reflect students who are increasingly disorganized, leaning toward poor study practices but retaining traces of structure. Similarly, stimulant use at 1.5 indicates frequent reliance on substances, leaning toward regular dependence but not fully established. Emotional distress at 1.5 reflects students experiencing frequent anxiety and irritability, bordering on severe symptoms. These intermediate values represent the “warning zone” in the model, where the risk is elevated but not absolute, allowing the system to capture the gradual escalation from manageable conditions to crisis states.
Figure 9. Inference Engine of Fuzzy Logic Model.
Figure 10. Rule Viewer showing the Model Response to Input.
Finally, when the crisp value is at 2, it coincides with the peak of the rightmost triangular membership function [1.5, 2, 2.5]. At this point, the membership degree is 1 for the highest category (e.g., High Stress, Poor Sleep, Low Socioeconomic Status, Poor Study Habits, Regular Stimulant Use, or High Emotional Distress) and 0 for all others. This represents complete belonging to the most adverse state for each risk factor. For example, academic stress at 2 denotes overwhelming pressure from exams, assignments, and expectations, while sleep quality at 2 indicates chronic deprivation and exhaustion. Emotional distress at 2 describes severe symptoms such as persistent anxiety and inability to concentrate, aligning strongly with neurasthenia diagnostic features. At this point, the model consistently classifies students as High Risk of neurasthenia, reflecting the cumulative effect of severe risk factors.
Overall, this behavior across ranges [0, 0.5, 1, 1.5, 2] demonstrates the strength of fuzzy logic in handling uncertainty and gradual transitions. Unlike rigid classification systems, the fuzzy inference system ensures smooth movement between categories, reflecting the fluid nature of human experiences such as stress or sleep quality. The overlapping membership functions prevent abrupt jumps and instead represent the reality that students often exist in “in-between” states. When inputs cluster around favorable values (0–0.5), the model consistently predicts Low Risk. Intermediate conditions (0.5–1.5) produce Moderate Risk, while adverse values (1.5–2) converge on High Risk. This flexibility highlights the interpretability and robustness of the fuzzy model for predicting neurasthenia likelihood.
The source code of the Fuzzy Logic Model that was implemented for the likelihood of Neurasthenia will be available on request. The source code showed the number of inputs and outputs alongside their respective number (and type) of membership functions used to formulate the inputs and outputs. The source code also presents the description of the names and the crisp intervals for each triangular membership function that was used to formulate the fuzzy logic model for the likelihood of Neurasthenia.