The spectral behavior of 3-aminophenol (3AP) with α-cyclodextrin (α-CD), β-cyclodextrin (β-CD) in pH ~2, pH ~7, pH ~11 and copper nano was investigated using UV–visible absorption, steady-state and time-resolved fluorescence, PM3 calculations, SEM, DSC, FTIR, XRD, and 1H NMR techniques. 3AP exhibited a single emission band at the same wavelength in α-CD at pH ~2 and pH ~7, whereas dual emission was observed at pH ~11. Across all solvents, the absorption and emission maxima of 3AP resembled those of 3-anisidine. In β-CD, the emission intensity at pH ~7 and pH ~11 decreased at the shorter-wavelength (normal emission) band and increased at the longer-wavelength band, suggesting the presence of an intramolecular charge-transfer (ICT) process in 3AP. The lifetimes of the inclusion complexes were longer than that of the free 2AP molecule. The geometrical restriction of the α-CD cavity likely limits the free rotation of the amino and hydroxyl groups, thereby enhancing the intensity of the IPT emission. The calculated HOMO–LUMO energy gap, total energy, free energy, enthalpy, entropy, dipole moment, and zero-point vibrational energy of the CD: 3AP complex differed significantly from those of the isolated 2AP, α-CD and β-CD molecules, and both the vertical and horizontal bond lengths between the amino and hydroxy groups are smaller than the β-CD cavity size confirming the formation of an inclusion complex. The lifetimes of the 3AP–CD inclusion complexes were longer than that of free 3AP. SEM-EDX analysis confirmed the presence of 48% carbon, 47.3% oxygen, and 3.3% copper in the nanomaterials. In DSC, XRD, and FTIR analyses, new peaks appeared along with a substantial reduction in the intensity of characteristic bands for the nano Cu-3AP-CD complex, indicating successful complex formation and structural modification.
| Published in | American Journal of Quantum Chemistry and Molecular Spectroscopy (Volume 10, Issue 1) |
| DOI | 10.11648/j.ajqcms.20261001.13 |
| Page(s) | 24-34 |
| Creative Commons |
This is an Open Access article, distributed under the terms of the Creative Commons Attribution 4.0 International License (http://creativecommons.org/licenses/by/4.0/), which permits unrestricted use, distribution and reproduction in any medium or format, provided the original work is properly cited. |
| Copyright |
Copyright © The Author(s), 2026. Published by Science Publishing Group |
3-Aminophenol, Copper Nano, Cyclodextrin, Inclusion Complex, Nanomaterials
Concentration of CD x10-3 mol/dm3 | pH -3.0 | pH - 7 | pH - 11 | |||||||||
|---|---|---|---|---|---|---|---|---|---|---|---|---|
abs | log | flu | τ | abs | log | flu | τ | abs | log | flu | τ | |
3AP only (in water) | 272 212 | 3.43 | 300 | 0.30 | 283 232 210 | 3.49 | 337 | 0.33 | 286 216 | 3.48 | 338 | 0.29 |
0.2 α-CD | 271 212 | 3.46 | 300 | 0.39 | 282 231 210 | 3.50 | 337 | 0.40 | 286 219 | 3.53 | 338 | 0.40 |
1.0 α-CD | 270 212 | 3.51 | 300 | 0.48 | 282 230 210 | 3.58 | 336 | 0.54 | 289 221 | 3.58 | 339 431 | 0.51 0.19 |
0.2 β-CD | 271 213 | 3.48 | 300 | 0.41 | 278 231 212 | 3.49 | 337 | 0.46 | 288 218 | 3.53 | 339 443 | 0.34 |
1.0 β-CD | 272 217 | 3.54 | 306 | 0.50 | 273 218 | 3.63 | 337 430 | 0.54 0.22 | 289 227 | 3.64 | 355 443 | 0.55 0.25 |
Excitation wavelength (nm) | 270 | 280 | 270 | |||||||||
K (1: 1) x105 dm3/mol | 78 | 196 | 65 | 198 | 86 | 371 | ||||||
G (kcalmol-1) | -10.97 | -13.29 | -10.51 | -13.32 | -11.22 | -14.90 | ||||||
K (1: 1) x105 dm3/mol | 86 | 285 | 104 | 204 | 115 | 486 | ||||||
G (kcalmol-1) | -11.22 | -14.24 | -11.70 | -13.39 | -11.95 | -15.58 | ||||||
Properties | 3AP | α-CD | β-CD | 3AP: α-CD | 3AP: β-CD |
|---|---|---|---|---|---|
EHOMO (eV) | -8.55 | -10.37 | -10.35 | -8.06 | -8.18 |
ELUMO (eV) | 0.35 | 1.26 | 1.23 | 0.79 | 0.88 |
EHOMO – ELUMO (eV) | -8.91 | -11.63 | -11.58 | -8.85 | -9.06 |
Dipole moment (D) | 2.96 | 11.34 | 12.29 | 12.14 | 12.32 |
E* | -25.79 | -1247.62 | -1457.63 | -1361.34 | -1535.61 |
E* | -187.94 | -52.2 | |||
G* | 50.04 | -676.37 | -789.52 | -586.12 | -668.12 |
ΔG* | -40.18 | -50.62 | |||
H* | 74.52 | -570.84 | -667.55 | -516.79 | -610.84 |
ΔH | -20.47 | -17.81 | |||
S** | 0.082 | 0.353 | 0.409 | 0.461 | 0.482 |
ΔS** | 0.026 | -0.009 | |||
ZPE* | 65.84 | 635.09 | 740.56 | 703.62 | 781.83 |
Mullikan charge | 0.00 | 0.00 | 0.00 | 0.00 | 0.00 |
Protons | 3AP (δ) | Cu: 3AP: α-CD | Cu: 3AP: β-CD |
|---|---|---|---|
Ha -OH | 8.83 | 5.73 | 5.75 |
Hb - Meta to OH | 6.78 | 5.66 | 5.69 |
Hc - In between to OH and NH2 | 6.02 | 4.80 | 4.82 |
Hd - Ortho OH | 6.01 | 4.46 | 4.49 |
He- Ortho to NH2 | 5.94 | 2.8 | 2.51 |
Hf -NH2 | 4.85 | 1.20 | 1.23 |
FTIR | Fourier Transform Infrared Spectroscopy |
DTA | Differential Thermal Analysis |
XRD | X-ray Diffraction |
SEM | Scanning Electron Microscopy |
HOMO | Highest Occupied Molecular Orbital |
LUMO | Lowest Unoccupied Molecular Orbital |
3AP | 3-aminophenol |
Ag NPs | Silver Nanoparticles |
α-CD | Alpha Cyclodextrin |
β-CD | Beta Cyclodextrin |
PM3 | Parametric Method 3 |
ΔE | Iinternal Energy Change |
ΔH | Enthalpy Change |
ΔG | Free Energy Change |
ΔS | Entropy Change |
| [1] | S. Akkın, G. Varan, D. Aksüt, M. Malanga, A. Ercan, M. Şen, et al., A different approach to immunochemotherapy for colon cancer: Development of nanoplexes of cyclodextrins and interleukin-2 loaded with 5-FU, Int. J. Pharm. 623(2022) 121940. |
| [2] | N. A. Alhakamy, S. M. Badr-Eldin, O. A. A. Ahmed, H. M. Aldawsari, S. Z. Okbazghi, M. A. Alfaleh, et al., Green nanoemulsion stabilized by in situ self-assembled natural oil/native cyclodextrin complexes: An eco-friendly approach for enhancing anticancer activity of costunolide against lung cancer cells, Pharmaceutics 14(2022) 227. |
| [3] | K. Zheng, X. Liu, H. Liu, D. Dong, L. Li, L. Jiang, et al., Novel pH-triggered doxorubicin-releasing nanoparticles self-assembled by functionalized β-cyclodextrin and amphiphilic phthalocyanine for anticancer therapy, ACS Appl. Mater. Interfaces 13(2021) 10674-10688. |
| [4] | Y. Zhang, X. Li, X. Chen, Y. Zhang, Y. Deng, Y. Yu, et al., Construction of ultrasmall gold nanoparticles based contrast agent via host-guest interaction for tumor-targeted magnetic resonance imaging, Mater. Des. 217(2022) 110620. |
| [5] | R. Zhang, X. You, M. Luo, X. Zhang, Y. Fang, H. Huang, et al., Poly(β-cyclodextrin)/platinum prodrug supramolecular nano system for enhanced cancer therapy: Synthesis and in vivo study, Carbohydr. Polym. 292(2022) 119695. |
| [6] | Y. Yuan, T. Nie, Y. Fang, X. You, H. Huang, J. Wu, Stimuli-responsive cyclodextrin-based supramolecular assemblies as drug carriers, J. Mater. Chem. B 10(2022) 2077-2096. |
| [7] | H. M. Ameen, S. Kunsági-Máté, L. Szente, B. Lemli, Encapsulation of sulfamethazine by native and randomly methylated β-cyclodextrins: The role of the dipole properties of guests. Spectrochim. Acta A 225(2020) 117475. |
| [8] | M. Jamrógiewicz, K. Milewska, Sacharides and their derivatives as pharmaceutical additives Spectrochim. Acta A 219 (2019) 346. |
| [9] | M. A. Chouker, H. Abdallah, A. Zeiz, M. H. El-Dakdouki, Host-guest inclusion complex of quinoxaline-1,4-dioxide derivative with 2-hydroxypropyl-β-cyclodextrin: Preparation, characterization, and antibacterial activity. J. Mol. Struct. (2021) 130273. |
| [10] | M. Levine, B. R. Smith, Tuning fluorescence energy transfer for carcinogen detection and medical diagnostics. J. Fluoresc. 30(2020) 1015. |
| [11] | I. Lafifi, L. Nouar, F. Madi, A. Guendouzi, M. Cheriet, N. Boulaha, B. Houari, Computational study of inclusion complex of L-Glutamine/β-Cyclodextrin: Electronic and intermolecular interactions investigations. J. Mol. Struct. 1206 (2020) 127740. |
| [12] | M. Akhondi, E. Jamalizadeh, A. Mohebbi, MD and DFT calculations on the structural variations of amino-cyclodextrin as a pH-sensitive carrier for smart carriage and release of Doxorubicin. J. Mol. Struct. 1230(2021) 129855. |
| [13] | A. Obaid, A. Khairani, M. Jamil, S. Prabu, S. M. Saharin, S. Mohamad, Spectroscopic studies for the inclusion complexation of ketoprofen enantiomers with β-cyclodextrin. Spectrochim. Acta A 225(2020) 118674. |
| [14] | Gu Alice, Wheate Nial, Macrocycles as drug-enhancing excipients in pharmaceutical formulations, J. Incl. Phenom. Macrocycl. Chem. 100(2021) 55-69. |
| [15] | Hui He, Chuchu Xie, Liu Yao, Ge Ning, Yonghong Wang, A novel β-cyclodextrin functionalized fluorescent probe for selective detection of metal ions in aqueous solution, J. Fluoresc. 31(2021) 63-71. |
| [16] | A. Mani, P. Ramasamy, A. Antony Muthu Prabhu, N. Rajendiran, Investigation of Ag and Ag/Co bimetallic nanoparticles with naproxen-cyclodextrin inclusion complex. J. Molecular Structure, 1284(2023) 135301-10. |
| [17] | A. Mani, G. Venkatesh, P. Senthilraja, N. Rajendiran, Synthesis and Characterisation of Ag-Co-Venlafaxine-Cyclodextrin Nanorods, European J Advanced Chemistry Research, 5(2024) 9-16. |
| [18] | A. Mani, P. Ramasamy, A. Antony Muthu Prabhu, P. Senthilraja, N. Rajendiran, Synthesis and Analysis of Ag/Olanzapine/Cyclodextrin and Ag/Co/Olanzapine /Cyclodextrin Inclusion Complex Nanorods. Physics and Chemistry of Liquids, 62(2024) 196-209. |
| [19] | A. Mani, P. Ramasamy, A. Antony Muthu Prabhu, P. Senthilraja, N. Rajendiran, Synthesis and Characterisation of Ag/Co/Chloroquine/Cyclodextrin Inclusion Complex Nanomaterials. J Sol-Gel Science and Technology 115(2025) 844-856. |
| [20] | N. Rajendiran, A. Mani, M. Venkatesan, B. Sneha, E. Nivetha, P. Senthilraja, Spectral, Microscopic, Antibacterial and Anticancer Activity of Pyrimethamine drug with Ag nano, DNA, RNA, BSA, Dendrimer, and Cyclodextrins, J Solution Chem, In press. |
| [21] | J. Prema Kumari, A. Antony Muthu Prabhu, G. Venkatesh, V. K. Subramanian, N. Rajendiran, Spectral characteristics of sulfadiazine, sulfisomidine: Effect of solvents, pH and β-CD. Physics and Chemistry of Liquids, 49(2011) 108-132. |
| [22] | N. Rajendiran, R. K. Sankaranarayanan, Azo dye/Cyclodextrin: New findings of identical nanorods through 2: 2 inclusion complexes. Carbohydrate Polymers, 106 (2014) 422-431. |
| [23] | N. Rajendiran, M. Swaminathan, Luminescence characteristics of 4,4’-diaminodiphenyl methane in different solvents and at various pH. Spectrochim. Acta, 52A (1996) 1785-1792. |
| [24] | M. Jude Jenita, G. Venkatesh, V. K. Subramanian, N. Rajendiran, Twisted Intramolecular Charge Transfer effects on fast violet B and fast blue RR: Effect of HP-α-CD and HP-β-CDs. J.Molecular Liquids, 178(2013) 160-167. |
| [25] | N. Rajendiran, M. Swaminathan, Photophysical behaviour of 4,4-dihydroxydiphenyl sulphone Indian J. Chemistry, 35A (1996) 385-389. |
| [26] | N. Rajendiran, R. K. Sankaranarayanan, J. Saravanan, Nanochain and vesicles formed by inclusion complexation of 4, 4’-diamino benzanilide with Cyclodextrins. J. Experimental Nanoscience, 10(2015) 880-899. |
| [27] | N. Rajendiran, R. K. Sankaranarayanan, J. Saravanan, Nanostructures formed by cyclodextrin covered amino benzophenones through supramolecular self assembly, Spectrochim Acta, 127A(2014) 52-60. |
| [28] | R. S. Sarpal, S. K. Dogra, Prototropism in aminophenols and anisidines: A reinvestigation. J. Photochem. 38(1987) 263-276. |
| [29] | N. Rajendiran, M. Swaminathan, Luminescence characteristics of 4,4′-diaminodiphenyl methane in different solvents and at various pH. Spectrochim. Acta A 52(1996) 1785-1792. |
| [30] | R. K. Sankaranarayanan, A. Antony Muthu Prabhu, N. Rajendiran, Inclusion complexation of 3,5-dihydroxy benzoic acid with β-CD at different pH. Indian J. Chemistry, 48A (2009) 1515-1521. |
| [31] | R. K. Sankaranarayanan, A. Antony Muthu Prabhu, N. Rajendiran, A Study on the inclusion complexation of 3,4,5-trihydroxybenzoic acid with β-CD at different pH. J.Inclusion Phenomena and Macrocyclic Chemistry, 67(2010) 461-470, |
| [32] | J. Prema Kumari, A. Antony Muthu Prabhu, G. Venkatesh, V. K. Subramanian, N. Rajendiran, Effect of solvents and pH on β-CD Inclusion complexation of 2,4-dihydroxy azobenzene and 4-hydroxy azobenzene. J. Solution Chemistry, 40 (2011) 327-347. |
| [33] | T. Stalin, P. Vasantharani, B. Shanthi, A. Sekar, N. Rajendiran, Inclusion complex of 1,2,3-trihydroxybenzene with α- and β-cyclodextrins. Indian J Chemistry, 45A (2006) 1113-1120. |
| [34] | A. Antony Muthu Prabhu, N. Rajendiran, Encapsulation of labetalol, and pseudoephedrine in β-CD cavity: Spectral and molecular modeling studies. J. Fluorescence, 22(2012) 1461-1474. |
| [35] | T. Stalin, R. Anithadevi, N. Rajendiran, Spectral characteristics of ortho, meta and para dihydroxybenzenes in different solvents, pH and β-cyclodextrin. Spectrochim. Acta A 61(2005) 2495 -510. |
| [36] | N. Rajendiran, R. K. Sankaranarayanan, J. Saravanan, A study of supramolecular host-guest interaction of dothiepin and doxepin drugs with cyclodextrin macrocycles. J Molecular Structure, 1067(2014) 252-260. |
| [37] | A. Douhal, Ultrafast guest dynamics in cyclodextrin nanocavities. Chem. Rev. 104(2004) 1955-1976. |
| [38] | G. González-Gaitano, P. Rodríguez, J. R. Isasi, M. Fuentes, G. Tardajos, M. Sánchez, The aggregation of cyclodextrins as studied by photon correlation spectroscopy. J. Incl. Phenom. Macrocycl. Chem. 44(2002) 101-105. |
| [39] | D. R. T. Jonathan, W. Steed, K. J. Wallace, Core Concepts in Supramolecular Chemistry and Nanotechnology. John Wiley & Sons, Ltd, (2007). |
| [40] | V. Villari, A. Mazzaglia, R. Darcy, C. M. O’Driscoll, N. Micali, Nanostructures of cationic amphiphilic cyclodextrin complexes with DNA. Biomacromolecules 14(2013) 811-817. |
| [41] | R. Yazdanparast, M. A. Esmaeili, R. Khodarahmi, Protein Refolding Assisted by Molecular Tube-Based α-Cyclodextrin as an Artificial Chaperone, Biochemistry 71(2006) 1298. |
| [42] | V. Mahalingam, S. Onclin, M. Peter, B. J. Ravoo, J. Huskens, D. N. Reinhoudt, Directed Self-Assembly of Functionalised Silica Nanoparticles on Molecular Printboards through Multivalent Supramolecular Interactions, Langmuir 20 (2004) 11756. |
| [43] | R. Challa, A. Ahuja, J. Ali, R. K. Khar, Cyclodextrins in drug delivery: an updated review. AAPS Pharm Sci Tech. 6 (2005) 329-357. |
| [44] | K. Rotkiewicz, W. Rubaszewska, Intramolecular electron-transfer excited state in 6-cyanobenzquinuclidine, Chem. Phys. Lett. 70(1980) 444. HYPERLINK |
APA Style
Rajendiran, N., Mani, A., Ramasamy, P. (2026). Preparation of Copper –3-Aminophenol–Cyclodextrin Nanomaterials and Study of 3-Aminophenol–Cyclodextrin Inclusion Complexes at Different pH Conditions. American Journal of Quantum Chemistry and Molecular Spectroscopy, 10(1), 24-34. https://doi.org/10.11648/j.ajqcms.20261001.13
ACS Style
Rajendiran, N.; Mani, A.; Ramasamy, P. Preparation of Copper –3-Aminophenol–Cyclodextrin Nanomaterials and Study of 3-Aminophenol–Cyclodextrin Inclusion Complexes at Different pH Conditions. Am. J. Quantum Chem. Mol. Spectrosc. 2026, 10(1), 24-34. doi: 10.11648/j.ajqcms.20261001.13
@article{10.11648/j.ajqcms.20261001.13,
  author = {Narayanasamy Rajendiran and Ayyadurai Mani and Palanichamy Ramasamy},
  title = {Preparation of Copper –3-Aminophenol–Cyclodextrin Nanomaterials and Study of 3-Aminophenol–Cyclodextrin Inclusion Complexes at Different pH Conditions},
  journal = {American Journal of Quantum Chemistry and Molecular Spectroscopy},
  volume = {10},
  number = {1},
  pages = {24-34},
  doi = {10.11648/j.ajqcms.20261001.13},
  url = {https://doi.org/10.11648/j.ajqcms.20261001.13},
  eprint = {https://article.sciencepublishinggroup.com/pdf/10.11648.j.ajqcms.20261001.13},
  abstract = {The spectral behavior of 3-aminophenol (3AP) with α-cyclodextrin (α-CD), β-cyclodextrin (β-CD) in pH ~2, pH ~7, pH ~11 and copper nano was investigated using UV–visible absorption, steady-state and time-resolved fluorescence, PM3 calculations, SEM, DSC, FTIR, XRD, and 1H NMR techniques. 3AP exhibited a single emission band at the same wavelength in α-CD at pH ~2 and pH ~7, whereas dual emission was observed at pH ~11. Across all solvents, the absorption and emission maxima of 3AP resembled those of 3-anisidine. In β-CD, the emission intensity at pH ~7 and pH ~11 decreased at the shorter-wavelength (normal emission) band and increased at the longer-wavelength band, suggesting the presence of an intramolecular charge-transfer (ICT) process in 3AP. The lifetimes of the inclusion complexes were longer than that of the free 2AP molecule. The geometrical restriction of the α-CD cavity likely limits the free rotation of the amino and hydroxyl groups, thereby enhancing the intensity of the IPT emission. The calculated HOMO–LUMO energy gap, total energy, free energy, enthalpy, entropy, dipole moment, and zero-point vibrational energy of the CD: 3AP complex differed significantly from those of the isolated 2AP, α-CD and β-CD molecules, and both the vertical and horizontal bond lengths between the amino and hydroxy groups are smaller than the β-CD cavity size confirming the formation of an inclusion complex. The lifetimes of the 3AP–CD inclusion complexes were longer than that of free 3AP. SEM-EDX analysis confirmed the presence of 48% carbon, 47.3% oxygen, and 3.3% copper in the nanomaterials. In DSC, XRD, and FTIR analyses, new peaks appeared along with a substantial reduction in the intensity of characteristic bands for the nano Cu-3AP-CD complex, indicating successful complex formation and structural modification.},
 year = {2026}
}
TY  - JOUR
T1  - Preparation of Copper –3-Aminophenol–Cyclodextrin Nanomaterials and Study of 3-Aminophenol–Cyclodextrin Inclusion Complexes at Different pH Conditions
AU  - Narayanasamy Rajendiran
AU  - Ayyadurai Mani
AU  - Palanichamy Ramasamy
Y1  - 2026/04/02
PY  - 2026
N1  - https://doi.org/10.11648/j.ajqcms.20261001.13
DO  - 10.11648/j.ajqcms.20261001.13
T2  - American Journal of Quantum Chemistry and Molecular Spectroscopy
JF  - American Journal of Quantum Chemistry and Molecular Spectroscopy
JO  - American Journal of Quantum Chemistry and Molecular Spectroscopy
SP  - 24
EP  - 34
PB  - Science Publishing Group
SN  - 2994-7308
UR  - https://doi.org/10.11648/j.ajqcms.20261001.13
AB  - The spectral behavior of 3-aminophenol (3AP) with α-cyclodextrin (α-CD), β-cyclodextrin (β-CD) in pH ~2, pH ~7, pH ~11 and copper nano was investigated using UV–visible absorption, steady-state and time-resolved fluorescence, PM3 calculations, SEM, DSC, FTIR, XRD, and 1H NMR techniques. 3AP exhibited a single emission band at the same wavelength in α-CD at pH ~2 and pH ~7, whereas dual emission was observed at pH ~11. Across all solvents, the absorption and emission maxima of 3AP resembled those of 3-anisidine. In β-CD, the emission intensity at pH ~7 and pH ~11 decreased at the shorter-wavelength (normal emission) band and increased at the longer-wavelength band, suggesting the presence of an intramolecular charge-transfer (ICT) process in 3AP. The lifetimes of the inclusion complexes were longer than that of the free 2AP molecule. The geometrical restriction of the α-CD cavity likely limits the free rotation of the amino and hydroxyl groups, thereby enhancing the intensity of the IPT emission. The calculated HOMO–LUMO energy gap, total energy, free energy, enthalpy, entropy, dipole moment, and zero-point vibrational energy of the CD: 3AP complex differed significantly from those of the isolated 2AP, α-CD and β-CD molecules, and both the vertical and horizontal bond lengths between the amino and hydroxy groups are smaller than the β-CD cavity size confirming the formation of an inclusion complex. The lifetimes of the 3AP–CD inclusion complexes were longer than that of free 3AP. SEM-EDX analysis confirmed the presence of 48% carbon, 47.3% oxygen, and 3.3% copper in the nanomaterials. In DSC, XRD, and FTIR analyses, new peaks appeared along with a substantial reduction in the intensity of characteristic bands for the nano Cu-3AP-CD complex, indicating successful complex formation and structural modification.
VL  - 10
IS  - 1
ER  -
Department of Chemistry, Annamalai University, Annamalai Nagar, India
Center for Advanced Energy Materials, SRM TRP Engineering College, Tiruchy, India
Molecular Biophysics Unit, Indian Institute of Science, Bangalore, India
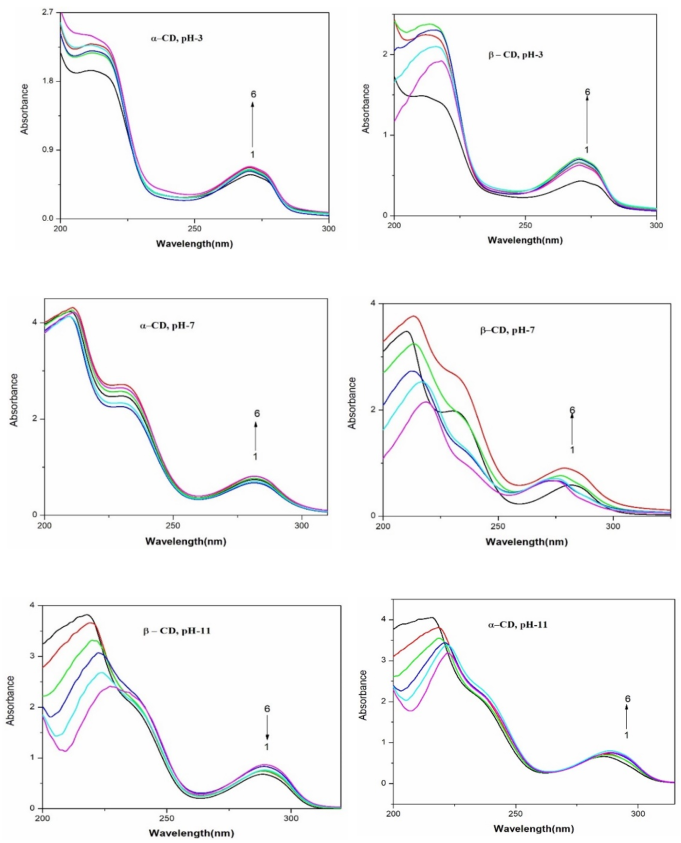
Figure 1. Absorbance spectra of 3AP in different α-CD and β-CD concentrations (mol/dm3): (1) 0, (2) 0.002, (3) 0.004, (4) 0.006, (5) 0.008 and (6) 0.01.
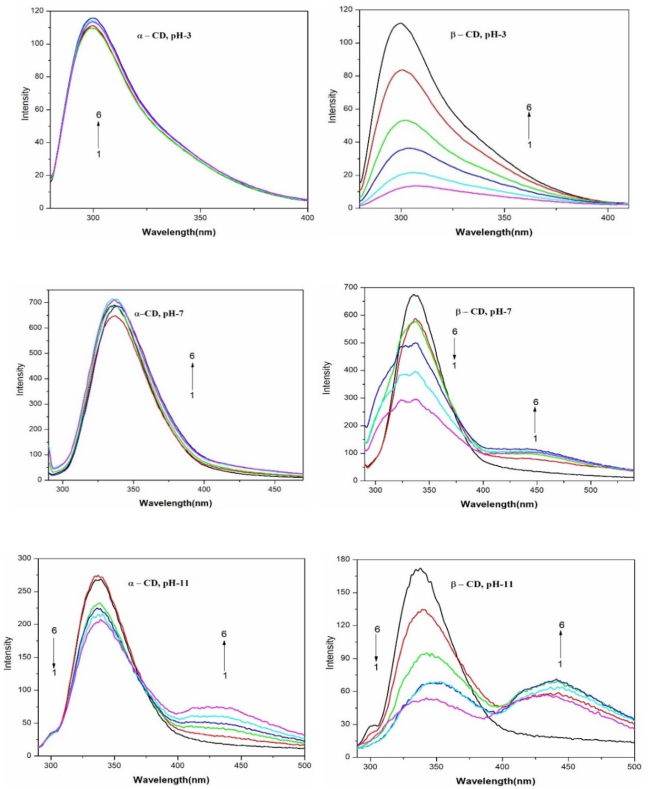
Figure 2. Fluorescence spectra of 3AP in different α-CD and β-CD concentrations (mol/dm3): (1) 0, (2) 0.002, (3) 0.004, (4) 0.006, (5) 0.008 and (6) 0.01.
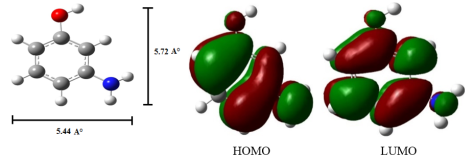
Figure 3. PM3 optimized structures of (a, b) 3AP (c, d) HOMO, LUMO of 3AP.
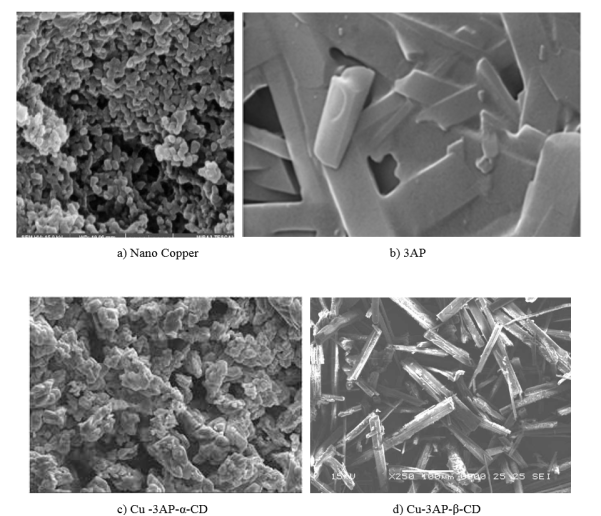
Figure 4. SEM images for a) Cu nano, b) 3AP, c) Cu: 3AP: α-CD and d) Cu: 3AP: β-CD.
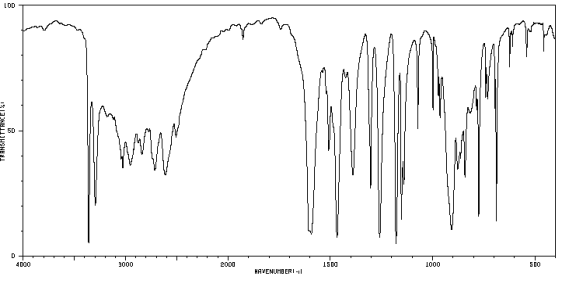
Figure 5. 12 FTIR spectra of 2AP.
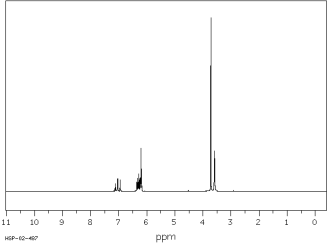
Figure 6. 1H-NMR spectra of 3AP.
Information

