1. Introduction
The Paris Agreement of 2015 urging the restrain of global warming well down below 2°C and the International Maritime Organization’s (IMO) aim to completely obliterate Green House Gas (GHG) emissions from vessels by 2050, pressures the marine industry to scrutinize technological and operational-based measures to achieve the set target
| [1] | Odokwo, V. E., Theophilus-Johnson, K., Nitonye, S., & Ogbonnaya, E. A. (2022). Influence of Optimized Propulsive Efficiencies on Decarbonization of Ship Emission. Journal of Newviews in Engineering and Technology (JNET), 4(2), 18-28. http://www.rsujnet.org/index.php/publications/2022-edition |
| [2] | Robalo-Cabrera, I., Alcayde, A., Filgueira-Vizoso, A., Castro-Santos, L., García-Diez, A. I., & Manzano-Agugliaro, F. (2025). Shipping sector decarbonisation measures: A review. Sustainable Energy Technologies and Assessments, 82, 104549. https://doi.org/10.1016/j.seta.2025.104549 |
[1, 2]
. Approximately 300 million tonnes of various categories of fossil fuels are utilized by global shipping annually
. Experts have projected that by 2050, GHG emission will be 250% higher compared to 2012 level because of an increase in global shipping activities
| [2] | Robalo-Cabrera, I., Alcayde, A., Filgueira-Vizoso, A., Castro-Santos, L., García-Diez, A. I., & Manzano-Agugliaro, F. (2025). Shipping sector decarbonisation measures: A review. Sustainable Energy Technologies and Assessments, 82, 104549. https://doi.org/10.1016/j.seta.2025.104549 |
[2]
. Sequel to the anticipated continuous increase in emission towards 2050, international organizations and regulatory bodies have set decarbonization targets. Nevertheless, the maritime sector has not shown any remarkable reduction in GHG emission so far, though there appears to be a stabilization in emissions from the sector after targets were sets by IMO according to
. This makes IMO’s 50% emission drop target ambitious and put the policy in peril. To achieve IMO’s mitigation feat, the adaptation of various technologies, energy-efficiency measures and carbon-neutral fuels are sacrosanct. Noteworthily, most of these technologies projected to scale down emission are yet to be developed and the few available ones are meant for new vessels
| [5] | Kolios, A. (2024). Retrofitting technologies for eco-friendly ship structures: a risk analysis perspective. Journal of Marine Science and Engineering, 12(4), 679.
https://doi.org/10.3390/jmse12040679 |
[5]
Therefore, an informed and concerted effort are essential to keep existing ships in compliance with IMO’s decarbonization goal, especially when adopting technologies or employing alternative fuels that represents a paradigm shift towards green energy sources for addressing atmospheric filth
| [6] | Buonomano, A., Del Papa, G., Giuzio, G. F., Maka, R., Palombo, A., & Russo, G. (2025). Design and retrofit towards zero-emission ships: Decarbonization solutions for sustainable shipping. Renewable and Sustainable Energy Reviews, 213, 115384. https://doi.org/10.1016/j.rser.2025.115384 |
[6]
.
Owing to the availability of lower-grade WH onboard in large quantities, the application of immature energy-efficiency related technologies to harness these energy sources is a captivating area that embodies a substantial yet underutilized prospect for improving ships energy efficiency and emission reduction
| [7] | Alharbi, S., Alanazi, N., Alharbi, M., Alshammari, M. H., Pesyridis, A., & Alshammari, F. (2026). Balancing Efficiency and Economics in Organic Rankine Cycles with Multistage Turbines for Sustainable Waste Heat Utilization. Journal of Marine Science and Engineering, 14(3), 264.
https://doi.org/10.3390/jmse14030264 |
[7]
. Temperatures of MDE exhaust gas down-stream of the turbochargers basically is around the range of 200-400°C. Charge-air and jacket cooling water paths typically operate within the range of 70 and 120°C
| [8] | Zhu, S., Feng, J., Tang, Y., Bai, S., & Deng, K. (2023). Influence of ambient conditions on the marine two-stroke engine integrated with a bottoming Rankine cycle system: Energy and exergy analyses. Applied Thermal Engineering, 219, 119601.
https://doi.org/10.1016/j.applthermaleng.2022.119601 |
[8]
. Meanwhile, these temperature echelons are typically inapt for normal steam Rankine cycles, but properly aligns with the operating features of Organic Working Fluids (OWF)
| [9] | Kareem, A. F., Akroot, A., Abdul Wahhab, H. A., Talal, W., Ghazal, R. M., & Alfaris, A. (2023). Exergo-economic and parametric analysis of waste heat recovery from taji gas turbines power plant using Rankine Cycle and Organic Rankine Cycle. Sustainability, 15(12), 9376.
https://doi.org/10.3390/su15129376 |
[9]
.
The retrieval of lower-grade WH to useful energy in ships is adjudicated an effective approach to boost the total energy efficiency onboard
| [10] | Konur, O. (2021). Application of organic Rankine cycle (ORC) system to marine vessels (Doctoral dissertation, Dokuz Eylul Universitesi (Turkey)). |
[10]
and research towards ways to achieve this feat have been pushed. An important area of attention is the use of WH Recovery System (WHRS)
| [11] | Mondejara, M. E., Andreasena, J. G., Pierobona, L., Larsenc, U., Thernb, M. & Haglind, F. (2018). A review of the use of organic Rankine cycle power systems for maritime applications. Renewable and Sustainable Energy. 91(1), 126-15.
https://doi.org/10.1016/j.rser.2018.03.074 |
[11]
. The shipping sector is under intense scrutiny to mitigate its environmental footmark and a strategic approach to accomplish this sustainably is the retrofitting of existing ships with eco- friendly technologies
| [5] | Kolios, A. (2024). Retrofitting technologies for eco-friendly ship structures: a risk analysis perspective. Journal of Marine Science and Engineering, 12(4), 679.
https://doi.org/10.3390/jmse12040679 |
[5]
. For shipping to be fully decarbonized by 2050 as stipulated by IMO, over eighty thousand vessels in operation globally threatening green shipping have to be retrofitted
Retrofitting, from the marine perspective is the adjustment and up-grading of a vessel to optimize their eco-friendly and energy efficiency performance. Retrofitting contributes significantly to ship energy efficiency optimization, thus plummeting operational costs while buttressing the general competitiveness of shipping firms
| [5] | Kolios, A. (2024). Retrofitting technologies for eco-friendly ship structures: a risk analysis perspective. Journal of Marine Science and Engineering, 12(4), 679.
https://doi.org/10.3390/jmse12040679 |
[5]
. Retrofitting becomes imperative in the light of meeting the Environment, Social, and Governance (EGS) facet of shipping trade for sustainable development and this infers that a shipping firm is not only focused on financial gains only but also needs to identify the expectations of non-financial obligations from stakeholders to avoid being penalized
| [13] | Junkeon Ahn, Samkyung Seong, Jieun Lee & Yeonjoo Yun (2023) Energy efficiency and decarbonization for container fleet in international shipping based on IMO regulatory frameworks: A case study for South Korea, Journal of International Maritime Safety, Environmental Affairs, and Shipping, 7: 2-3, 2247832, https://doi.org/10.1080/25725084.2023.2247832 |
[13]
. Therefore, existing ships in the maritime domain has to satisfy both the operational and technical procedures to achieve GHG emissions reduction to evade the ESG penalty.
Retrofitting a MDE and adopting energy-saving technologies onboard makes eco-efficient and decarbonized ships achievable
| [13] | Junkeon Ahn, Samkyung Seong, Jieun Lee & Yeonjoo Yun (2023) Energy efficiency and decarbonization for container fleet in international shipping based on IMO regulatory frameworks: A case study for South Korea, Journal of International Maritime Safety, Environmental Affairs, and Shipping, 7: 2-3, 2247832, https://doi.org/10.1080/25725084.2023.2247832 |
[13]
. Innovative energy-saving technologies and WHRS to boost ship’s energy efficiency include but not limited to air lubrication system, wind-assisted propulsion, and an ORC plant
| [14] | IMO. (2019b). Revised proposal for goal-based energy effi ciency improvement measure utilizing energy efficiency existing-ship index (EEXI) (ISWG-GHG 6/2/3). |
[14]
. The ORC system is appraised to be a phenomenal technology for changing lower grade WH into beneficial power utilizing suitable OWF
| [15] | Alshammari, F.; Alatawi, I.; Alshammari, A. S. Impact of turbine characteristics on low temperature organic Rankine cycles operating with zeotropic and azeotropic mixtures. Case Stud. Therm. Eng. 2024, 59, 104463.
https://doi.org/10.1016/j.csite.2024.104463 |
[15]
. ORC is capable of operating proficiently at moderate pressures and temperatures. ORC’s fairly small size, working flexibility, and its simplicity of integration with available thermal substructure makes ORC captivating for onboard installations
| [7] | Alharbi, S., Alanazi, N., Alharbi, M., Alshammari, M. H., Pesyridis, A., & Alshammari, F. (2026). Balancing Efficiency and Economics in Organic Rankine Cycles with Multistage Turbines for Sustainable Waste Heat Utilization. Journal of Marine Science and Engineering, 14(3), 264.
https://doi.org/10.3390/jmse14030264 |
[7].
Studies on decarbonization and energy efficiency onboard principally refers to the Energy Efficiency Design Index (EEDI) framework
| [13] | Junkeon Ahn, Samkyung Seong, Jieun Lee & Yeonjoo Yun (2023) Energy efficiency and decarbonization for container fleet in international shipping based on IMO regulatory frameworks: A case study for South Korea, Journal of International Maritime Safety, Environmental Affairs, and Shipping, 7: 2-3, 2247832, https://doi.org/10.1080/25725084.2023.2247832 |
[13]
. The EEDI in this context, is a metric that represents eco- efficiency and a means of quantifying CO
2 emission from ships in the maritime sector
| [16] | Ahn, J., Lee, S., Jeong, J., & Choi, Y. (2021). Comparative feasibility study of combined cycles for marine power system in a large container ship considering energy efficiency design index (EEDI). International Journal of Hydrogen Energy, 46, 31816-31827. https://doi.org/10.1016/j.ijhydene.2021.07.068 |
| [17] | Effiong, O. V., Alfred, O. E., & Nkoi, B. (2022). Modeling and simulation of ship propulsive efficiencies related characteristics with energy efficiency design index in focus. American Journal of Science, Engineering and Technology. 7 (2), 50-56. https://doi.org/10.11648/j.ajset.20220702.14 |
[16, 17]
. A review of available literatures show that good efforts have been dedicated to research in the field of ORC for application onboard.
| [10] | Konur, O. (2021). Application of organic Rankine cycle (ORC) system to marine vessels (Doctoral dissertation, Dokuz Eylul Universitesi (Turkey)). |
[10]
reviewed the implementation of ORC WHRS in maritime contexts, concluding that the ORC system utilizing jacket cooling water for preheating and exhaust gas for evaporation yielded a 10-15% reduction in fuel oil consumption when fuel oil with low-sulfur content was used by the vessels. Study by
| [18] | Ng, C., Tam, I. C., & Wu, D. (2020). Thermo-economic performance of an organic Rankine cycle system recovering waste heat onboard an offshore service vessel. Journal of Marine Science and Engineering, 8(5), 351;
https://doi.org/10.3390/jmse8050351 |
[18]
discovered that a 5200DWT multi-purpose platform supply vessel using an ORC unit to recuperate the WH from the vessel’s exhaust gas was capable of a 5-9% savings in fuel oil per annum, and also an ORC having a simple configuration, offered the best payback time for the venture/investment. The application of a fully automated ORC in a 13,600 TEU container ship was assessed in a study by
| [19] | Pallis, P. (2020). Experimental investigation and economic assessment of a fully automated ORC for waste heat recovery from marine engine jacket cooling water. Doctoral dissertation, (National Technical University of Athens, School of Mechanical Engineering, Thermal Energy Sector).
http://dx.doi.org/10.26240/heal.ntua.18484 |
[19].
The research concluded that ORC investment as a WHRS for harvesting WH from MDE jacket cooling water was economically advantageous in both North Sea and Mediterranean Sea routes. Multiple evaluation criteria and improvement of WHRS for huge MDE was investigated by
| [20] | Ouyang, T., Huang, G., Lu, Y., Liu, B., & Hu, X. (2021). Multi-criteria assessment and optimization of waste heat recovery for large marine diesel engines. Journal of Cleaner Production, 309, 127307. https://doi.org/10.1016/j.jclpro.2021.127307 |
[20]
. The approach adopted combined thermodynamics, economics and environment in the parametric analysis of a Dual-Pressure ORC (DPORC) unit with six (6) commonly used OWF. The results suggested that cyclopentane was the optimal OWF with an optimal performance of 60.24% exergy efficiency, 0.167 $/kWh electricity production cost. Also,
| [21] | Pallis, P., Varvagiannis, E., Braimakis, K., Roumpedakis, T., Leontaritis, A. D., & Karellas, S. (2021). Development, experimental testing and techno-economic assessment of a fully automated marine organic Rankine cycle prototype for jacket cooling water heat recovery. Eenergy, 228, 120596.
https://doi.org/10.1016/j.energy.2021.120596 |
[21]
reported a depreciated payback period of 11.54 and 10.31 years for the Mediterranean Sea and North Sea routes. This result was arrived from their study that appraised the techno-economic performance of a totally automated prototype of an ORC for harnessing jacket cooling water WH. Research by
| [22] | Gürgen, S., & Altın, İ. (2022). Investigation of the effect of the regenerative organic rankine cycle system on decarbonization for a bulk carrier. Turkish Journal of Maritime and Marine Sciences, 8(2), 90-103.
https://doi.org/10.52998/trjmms.1086444 |
[22]
adopted a MAN 8G60ME-C10.5 MDE rated 22,720 kW MCR as a case study. The MDE exhaust gas was utilized as the WH source and ten (10) different organic working fluids (OWF) were assessed. The research indicated that the maximum efficiency of the ORC systems using R245fa was 18.7% at an engine load of 35%.
| [23] | Chen, W.; Xue, S.; Lyu, L.; Luo, W.; Yu, W. (2023). Energy saving analysis of a marine main engine during the whole voyage utilizing an ORC system to recover waste heat. Journal of. Marine Science and. Engineering. 11(1), 103-111.
https://doi.org/10.3390/jmse11010103 |
[23]
concentrated on WH recovery utilizing the warmed ORC system and the basic ORC. At 100% MCR, the BORC system's maximum net power production was shown to be 445.3 kW, while the PORC systems was 491.3 kW. Additionally, the BORC and PORC systems' ideal thermal efficiencies were 12.84% and 12.71%, respectively. 456 and 510 tons of fuel were saved by the systems. The MDE WH potential for ORC coupling was addressed in a work by
| [24] | Stainchaouer, A., Schifflechner, C., Wieland, C., Sakalis, G., & Spliethoff, H. (2024). Evaluating long-term operational data of a very large crude carrier: Assessing the diesel engines waste heat potential for integrating ORC systems. Applied Thermal Engineering, 255(1), 123974.
https://doi.org/10.1016/j.applthermaleng.2024.123974 |
[24]
to analyze operative data of a tanker vessel. The primary engine's exhaust fumes were used to generate 530 kW of electricity, according to simulated data. When the auxiliary engine was merged with R245fa and R1233zd (E) utilized as OWF, respectively, this power increased to 653 kW and 741 kW, and a 4 to 7% annual reduction in CO
2 emissions was attained.
Despite the fact that outstanding research have been done on thermodynamic modeling and optimization, comprehensive economic viability analysis of ORC retrofit for maritime applications remain scarce. There are still a number of issues and knowledge deficits that must be resolved before shipowners' widespread adoption is promoted. Studies appraising economic viability of ORC retrofit onboard are scanty and have attracted relatively few attentions. This missing link is significant, as the commercial prospect of ORC feasibility onboard determines if the technology can transition from research and experimental studies to extensive onboard implementation
| [7] | Alharbi, S., Alanazi, N., Alharbi, M., Alshammari, M. H., Pesyridis, A., & Alshammari, F. (2026). Balancing Efficiency and Economics in Organic Rankine Cycles with Multistage Turbines for Sustainable Waste Heat Utilization. Journal of Marine Science and Engineering, 14(3), 264.
https://doi.org/10.3390/jmse14030264 |
[7]
Since investment choices are mostly determined by capital costs, operational overheads, and projected financial earnings, some financial indices like the LCOE, NPV, and Payback Period (PBP) offer vital standards for appraising affordability and attractiveness of an investment. Also, since WHRS systems normally operate within lean economic boundaries, optimal costing of the ORC retrofit will play a crucial role in ensuring its widespread acceptance in the maritime industry. This study therefore seeks to deliver a thorough assessment of ORC retrofit economic performance in order to bridge the gap between technical development and shipboard deployment for enhance ship operational, emission and energy efficiency. This will ensure that the projected solutions are not just eco-efficient, carbon neutral but also fiscally feasible.
2. Materials and Methods
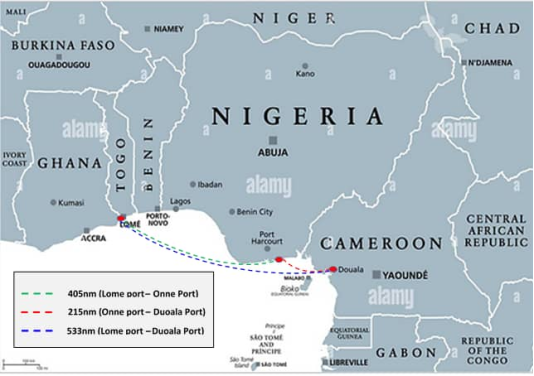
This study investigates the implementation of ORC-WHRS units aboard a tanker vessel MT BERNERS navigating between within the GoG. The Vessel is equipped with a 2 - stroke 7-cylinders in-line reversible turbocharged MDE having 4900kW power output at 100% Maximum Continuous Rating (MCR) at 170 rpm. The ship embarks on a total go-return trip of 1066 nm taking nearly 5 to 6 days voyage. The engine data log from a go-return journey, which takes between 120 and 144 hours to go between Duoala port in Cameroun and anchoring at Lome port in Togo, provided the data sets that serves as sources for the engine-based WHRS. This operational data was obtained every hour for a period of twelve (12) months, and are utilized for the energy analyses. The voyage route is shown in
Figure 1.
Figure 1. Voyage Route of MT Berners in the GoG.
2.1. ORC System Modelling
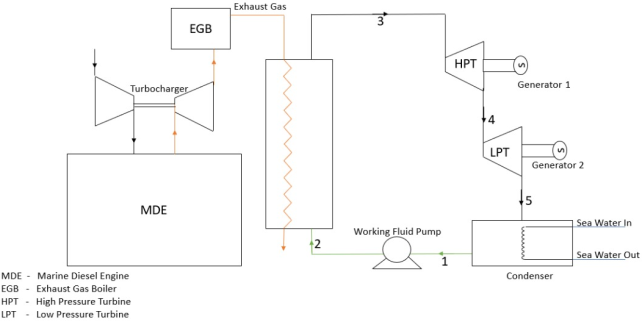
The ORC design for implementation on board the case study vessel - MT BERNERS as shown in
Figure 2 is design such that the OWF - R245fa (1,1,1,3,3-pentafluoropropane) is superheated by the thermal energy to a degree to aptly expands in both the High-Pressure Turbine (HPT) and a Low-Pressure Turbine (LPT) at high quality to generate the required energy for electricity or propulsion.
Figure 2. ORC schematic diagram for WHR onboard MT BERNERS.
Considering
Figure 2, the WH load from the evaporator,
, equation (
1) can be used to analyze the total heat load that the OWF can gain according to (Song
et al., 2015).
Where, : mass flowrate of heat source, : specific heat capacity of WH source, inlet and outlet temperatures of heat source.
The work done in pumping the OWF from state 1 to state 2 in
Figure 2 was achieved using the expressions given in equation (
2).
Where:
: pump efficiency,
: enthalpies of state 1 and state 2. The heat acquired by the OWF at the system's evaporator between state 2 and state 3, as depicted in
Figure 2, is examined utilizing the equation (
3) relationship:
In the turbine, the OWF undergoes isentropic expansion, with the work of expansion by the High-Pressure Turbine (HPT),
and expansion work in the Low-Pressure Turbine (LPT),
are as delineated in equations (
4) and (
5) respectively according to
| [25] | Odokwo, V., & Andem, K. (2020). Modeling and efficient optimization of combined gas and steam power plant using multi-layer perceptron. International Journal of Scientific and Engineering Research, 11(3), 827-835.
https://doi.org/10.22214/ijraset.2019.10047 |
[25]
.
According to
| [26] | Odokwo, V. E., and Ogbonnaya, E. A. “Performance optimization of combined gas and steam power plant using artificial neural network”. Indian Journal of Engineering, 16(1), 35-45; 2019. ISSN 2319-7757 EISSN 2319-7765 |
[26]
, equation (
6) can be used to analyze the amount of heat rejected from the OWF in the condenser:
(6)
Where, : specific heat capacity of sea water, : inlet and outlet temperature of sea water while : enthalpies at the inlet and outlet of the condenser.
Similarly, the network output of the ORC module can be evaluated from the expression of equation (
7):
(7)
The efficiency of the ORC unit was obtained as a quotient of the network output to the heat supplied According to
| [27] | Song, J., Song, Y., & Gu, C. (2015). Thermodynamic analysis and performance optimization of an organic Rankine cycle (ORC) waste heat recovery system for marine Diesel engines. Energy, 82, 976-985.
https://doi.org/10.1016/j.energy.2015.01.108 |
[27]
as given by the expression of equation (
8):
To evaluate the net efficiency of the combined MDE-ORC system, the model of equation (
9) is utilized:
(9)
2.2. Modelling of Economic Indicators
A comprehensive economic viability analysis (EVA) of ORC banks on several parameters. The process is much more complex, differing from location to location and from time to time. The cost of the major components of ORC units is used to estimate the total investment cost of the system. The current analysis on cost modelling technique described by
| [18] | Ng, C., Tam, I. C., & Wu, D. (2020). Thermo-economic performance of an organic Rankine cycle system recovering waste heat onboard an offshore service vessel. Journal of Marine Science and Engineering, 8(5), 351;
https://doi.org/10.3390/jmse8050351 |
[18]
for chemical and process industry is adopted for the cost evaluations with the objective of comparing the relative installation cost of the ORC system.
The Chemical Engineering Plant Cost Index (CEPCI) connection provided in equation (
10) have to be used to translate the actual capital cost from the 2001 cost in order to compensate for inflation while calculating the total module cost. Additionally, since the original stated investment cost of the system was determined on a different reference year, an appropriate “normalization” have to be performed to the present year with the use of equation (
10):
(10)
Table 1 present an average value of CEPCI from 2001 up to
. The size of the WHR plant affects the ORC's overall investment cost in any given year
| [21] | Pallis, P., Varvagiannis, E., Braimakis, K., Roumpedakis, T., Leontaritis, A. D., & Karellas, S. (2021). Development, experimental testing and techno-economic assessment of a fully automated marine organic Rankine cycle prototype for jacket cooling water heat recovery. Eenergy, 228, 120596.
https://doi.org/10.1016/j.energy.2021.120596 |
[21]
. This can be primarily credited to a combination of lowest required fixed costs and adopted technology.
Table 1.
Average Yearly Value of CEPCI | [29] | Gutierrez, J. C., Ochoa, G. V., & Duarte-Forero, J. (2020). A comparative study of the energy, exergetic and thermo-economic performance of a novelty combined Brayton S-CO2-ORC configurations as bottoming cycles. Heliyon, 6(7) 10-18. https://doi.org/10.1016/j.helyon.2020.e04459 |
Year | CEPCI | Year | CEPCI |
2001 | 394.3 | 2013 | 567.3 |
2002 | 395.6 | 2014 | 576.1 |
2003 | 402.0 | 2015 | 556.8 |
2004 | 444.2 | 2016 | 541.7 |
2005 | 468.2 | 2017 | 567.5 |
2006 | 499.6 | 2018 | 603.1 |
2007 | 525.4 | 2019 | 607.5 |
2008 | 575.4 | 2020 | 596.2 |
2009 | 521.9 | 2021 | 708.8 |
2010 | 550.8 | 2022 | 816.0 |
2011 | 585.7 | 2023 | 797.9 |
2012 | 584.6 | 2024 | 798.8 |
In order to evaluate the overall investment costs of the ORC an expression was proposed as shown by equation (
11):
(11)
As mentioned earlier, an applicable “normalization”, based on CECPI, needs to be performed on equation (
11) using equation (
10). Consequently, equation (
12) is used to determine the ORC module's cost.
(12)
The overall basic cost of the module for the ORC, is calculated using equation (
12), and applying an empirical “installation factor” of 1.47 to accommodate the total component cost (evaporator, condenser, pump and turbine) have been reported as a suitable incorporation cost factor by
| [19] | Pallis, P. (2020). Experimental investigation and economic assessment of a fully automated ORC for waste heat recovery from marine engine jacket cooling water. Doctoral dissertation, (National Technical University of Athens, School of Mechanical Engineering, Thermal Energy Sector).
http://dx.doi.org/10.26240/heal.ntua.18484 |
[19]
. Accordingly, the total direct & indirect costs connected with the ORC-WHRS aboard installation was achieved applying equation (
13):
(13)
The thermo-economic based model was developed using an 8% interest rate, 20-years project lifespan, and 8000 hours of yearly operational hours. According to
| [29] | Gutierrez, J. C., Ochoa, G. V., & Duarte-Forero, J. (2020). A comparative study of the energy, exergetic and thermo-economic performance of a novelty combined Brayton S-CO2-ORC configurations as bottoming cycles. Heliyon, 6(7) 10-18. https://doi.org/10.1016/j.helyon.2020.e04459 |
[29]
the payback period is the time needed to establish the economic benefit that is equivalent to the cost of the original investment and is obtained by translating the investment net-cash-flow of each year into the present value based on the benchmark rate of return given in equation (
14):
Where:
CM=Cost of operation and maitenance (2% of CIORC)
RG=Net earnings or annual revenue
Similarly, according to
| [30] | Zhang, X., Zhang, C., He, M., & Wang, J. (2019). Selection and evaluation of dry and isentropic organic working fluids used in organic Rankine cycle based on the turning point on their saturated vapor curves. Journal of Thermal Science, 28, 643-658. https://doi.org/10.1007/S11630-019-1149-X |
[30]
the return on investment can be estimated by the model of equation (
15):
The net present value (NPV) of the ORC system is obtained by applying the relationship of equation (
16) according to
| [19] | Pallis, P. (2020). Experimental investigation and economic assessment of a fully automated ORC for waste heat recovery from marine engine jacket cooling water. Doctoral dissertation, (National Technical University of Athens, School of Mechanical Engineering, Thermal Energy Sector).
http://dx.doi.org/10.26240/heal.ntua.18484 |
[19]
:
(16)
Where:
t =Year of a future payment
=Increase of fuel price
= Capital cost of investment which include labour, components and other costs
=Fuel avoidance cost (energy saving)
= Operational & maintenance cost
The Internal Rate of Return (IRR) is defined as the interest rate at which the NPV of all the positive and negative cash flows, from a project is equal to zero. IRR is used to evaluate the attractiveness of an investment. Hence, the IRR is evaluated using equation (
17):
(17)
The LCoE or electricity production cost, according to
| [21] | Pallis, P., Varvagiannis, E., Braimakis, K., Roumpedakis, T., Leontaritis, A. D., & Karellas, S. (2021). Development, experimental testing and techno-economic assessment of a fully automated marine organic Rankine cycle prototype for jacket cooling water heat recovery. Eenergy, 228, 120596.
https://doi.org/10.1016/j.energy.2021.120596 |
[21]
is the average cost of power generated per kWh. LCOE is evaluated by taking into consideration the compound interest of the system, operation and maintenance total costs as given by equation (
18).
(18)
Where:
= The annual energy production by the ORC unit.
The discounted payback time (DPBT) according to
| [18] | Ng, C., Tam, I. C., & Wu, D. (2020). Thermo-economic performance of an organic Rankine cycle system recovering waste heat onboard an offshore service vessel. Journal of Marine Science and Engineering, 8(5), 351;
https://doi.org/10.3390/jmse8050351 |
[18]
is estimated by considering the time value of cash for savings in fuel annually that will take place in the future to provide a better clue of the actual PBP of the investment in tandem with accounting ethics, the DPBT is evaluated using the model of equation (
18):
(19)
3. Results and Discussions
Results of this study are attained through a methodical computational approach based on the ORC retrofit thermodynamic and economic models. The OWF properties were obtained from REFPROP 9.0. Mass and energy balance equations were employed to evaluate the ORC thermodynamic parametric performance and the outputs then serves as inputs for the economic viability model, where key economic metrics such as LCOE, NPV, and PBP and DPBT are appraised. These will highlight the benefits of the retrofitted system towards enhancing ship energy efficiency and also to support informed decision-making in adopting ORC as one of the solutions in the transition towards green shipping.
3.1. Economic Viability Assessment of the ORC Retrofitted System
The thermodynamic computation was performed in MATLAB for the evaluation of some economic indexes with respect to the ORC viability and the MDE thermal WH was utilized. Furthermore, in order to scrutinize the influence of some economic indicators on the economic viability of the ORC retrofitted system in the GOG, a sensitivity analysis was performed.
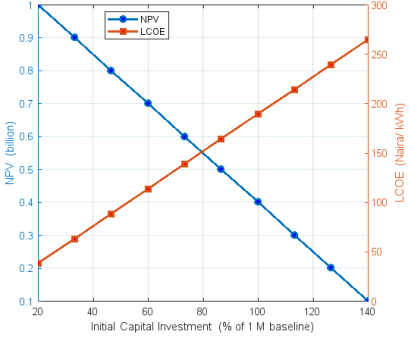
Figure 3 illustrate the influence of altering the initial capital investment or capital expenditure (CAPEX) on the NPV and LCOE. As depicted by the graph, an increase in CAPEX, increases the LCOE and decreases the NPV respectively. As the CAPEX increases from 20 to 60% of base capital, the NPV declines gradually to ₦ 0.7 billion, remaining strongly positive while the LCOE moved from 37.80 to ₦113.40 per kWh which is well below the cost of fuel and electricity for band A (₦209/kWh for band A and ₦64.07/kWh for band B considering the Nigerian electricity costing).
Economically, the 20 to 60% CAPEX is the most attractive range, because the NPV is strongest and the PBP will be achieved faster at an appreciable margin. Similarly, between 60 to 100% CAPEX, the NPV remains positive but the LCOE approaches ₦ 189.00 per kWh threshold, above which the cost of electricity generated by the ORC retrofit will be more than the cost of electricity supplied from the national grid at 209.5 ₦/kWhr, making the retrofit project unattractive to ship owners in the GOG. Though the project at this range is still viable; it is at a caution zone where fuel-prices, optimal utilization of the ORC and discount-rate are to be scrutinized to avoid economic slip. Beyond 100% capital investment, the effect of dwindling NPV makes the investment unattractive. With further modest parameter fluctuations, the NPV will approaches zero and may turn negative.
Consequentially, a misjudged appraisal of the CAPEX could affect significantly the economic performance of the ORC. This means that any additional increase of the CAPEX is spread across the same 8 000 hours of operating the ORC and the total energy generated, thereby escalating the cost of LCOE. This is so because higher CAPEX adds proportionally to annual cost, hence cost per unit energy produced grows. Therefore, the dual weight of deteriorating NPV and rising LCOE renders the investment unappealing and unattractive. It therefore makes economic sense for investors in the GOG interested in ORC retrofit onboard their vessels to prioritize the sizing or matching the ORC to the vessel’s actual exhaust-WH profile. Oversizing of the ORC must be avoided, and also ensure that the CAPEX that keeps the retrofitting projects within an optimal-NPV and low-LCOE region are adhered to and encouraged. Summarily, for the ORC retrofit onboard to remain attractive in the GOG, potential vessel owners should ensure capital-efficiency trade-off by adopting a well-matched ORC unit of the range of 20 to 60% CAPEX which provides the lower LCOE and maximum NPV. Avoid 100% CAPEX and above since any added cost of CAPEX, adds to the annualized cost which sky rockets the LCOE while depleting the NPV. Additionally, low-CAPEX options are important because it offers a wider risk-cushion against uncertainties associated with discount/interest rate instability, ORC operational and fuel price fluctuations, noting that a positive NPV at today’s prices can flip to negative at a slight alteration of any of these indicators.
Figure 3. Initial Capital Variation on NPV and LCOE.
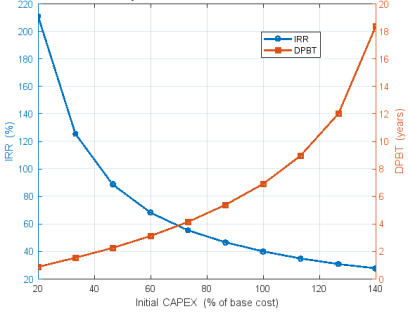
At the same time, an increase of CAPEX creates an equivalent decrease in the IRR and also a corresponding increase to DPBT as shown in
Figure 4. This is because at a greater CAPEX, the IRR reduces since the annual benefit in terms of energy savings accrued does not progress proportionately with cost and also it takes a longer duration for the investment to recover, particularly when cash-flows remain fixed.
Figure 4. Initial Capital Investment on IRR and DPBT.
Furthermore, following the curves behaviour of
Figure 4, the IRR and DPBT are most attractive when the CAPEX is between 60 to 80% of the investment cost because it is representative of the ORC installations at low-cost with a DPBT of eight (8) years. Above 120% CAPEX, the IRR declines below 30% and the DPBT rises above 12 years. Economically, this stage of the ORC retrofit project is unfavourable to ship-owners in the GOG. As stated earlier, a misjudged appraisal of the initial CAPEX could affect significantly the economic performance of the ORC which will hamper its adoption. Therefore, proper sizing and installation of a modular ORC based on the vessel’s peculiarity of WH to ensure a reduced initial capital investment cost is paramount.
In
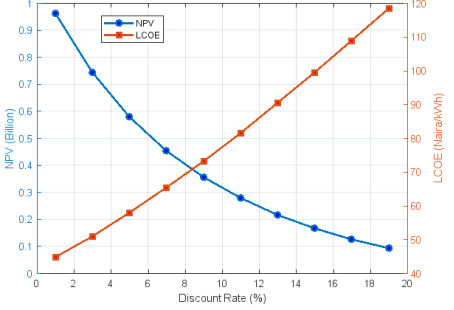
Figure 5, the influence of increasing or decreasing the interest rate on the NPV of investment and the LCOE is illustrated. As illustrated, as the interest rate rises gradually, the NPV declines sharply. This is because any savings (fuel or electricity) earned by the ORC-WHRS retrofit are worth less in value, making the retrofit-system less attractive.
Figure 5. Influence of the Interest Rate Variation on NPV and LCOE.
Also, an increase of interest rate produces a corresponding increase in the LCOE due to the fact that the capital‑recovery factor (CRF) inflates or blow up the annualized CAPEX, and therefore making each recovered kWh of energy to costs more. An interest rate of less than 8 % produces a strongly positive NPV and a LCOE of ₦80 per kWh. Therefore, investment in the retrofit technology is very favourable at this range of economic indexes, hence highly attractive as an investment option. While above 8% interest rate can wane the gains of the ORC WHRS causing appreciable decline in NPV and LCOE values, thereby presenting a negative outlook of the ORC retrofit project to ship owners. Whereas, above 16 % interest rate with a corresponding LCOE hopping to about ₦105 per kWh, the NPV approaches zero and will turn to negative on any slight changes in interest rate. Economic indicators above this range of investment zone should be avoided as it will be detrimental to ship-owners who adopts the ORC retrofit system for application in the GOG. Except there are concessional finance or subsidy for implementing the technology. Therefore, with the average SST of 28°C of the GOG, the economic success of ORC retrofit is also hinged on low interest rate and disciplined CAPEX.
Likewise,
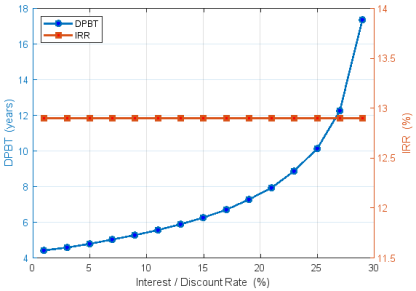
Figure 6 presents the impact of the interest rate variation on DPBT and IRR. The graph shows a proportional relationship between the DPBT and the interest rate. As the interest rate increases towards 29%, the DPBT also increases sharply from 4.3 years to about 16.7 years. This is an indication that a greater interest rate weighs heavily on the future cash flows, such that it prolongs the time to pay off the initial CAPEX.
Quite contrary to the DPBT, the IRR remains constant at 12.91% to any alterations in interest rate. IRR is the interest rate that makes the NPV of a project's cash flows equal zero and can be seen as the break-even interest rate for a project. Therefore, it is an inherent property of the cash flow and not a function of the discount rate. This account for why the IRR remains constant with changes in interest rate. It is therefore important based on this discovery that ship-owners should only borrow at an interest rate that is below the IRR for the project to ensure that the DPBT is within acceptable range.
Figure 6. Influence of the Interest Rate Variation on DPBT and IRR.
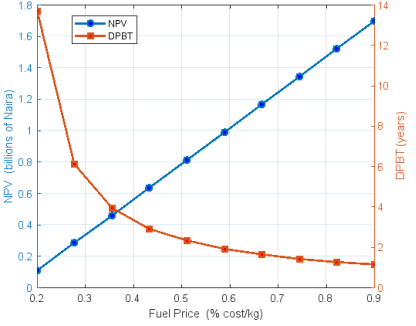
Figure 7, the influence of fuel price instabilities on NPV of investment and DPBT is illustrated. The NPV indicates a sharp and proportional increase with increment in fuel price per kg while the DPBT decreases steeply initially from 13. 7 years to 2.9 years, then gradually asymptotically along the horizontal axis to 1.1 years. The reason for the NPV strident rise is hinged on the fact that the initial CAPEX remains fixed while the annual fuel‑savings grows proportionally with increase in fuel‑price. Therefore, higher or lower future cash flows produced will be based on stability (rise or fall) in fuel price vis-à-vis the amount of fuel saved, respectively.
Figure 7. Influence of the Fuel Price Variation on DPBT and NPV.
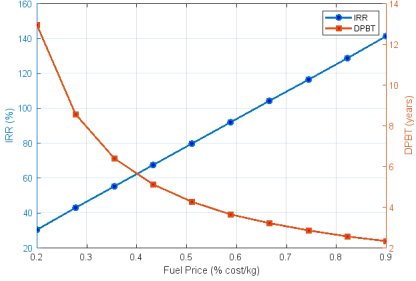
In furtherance to the sensitivity analysis, the effect of fuel price variabilities on IRR and DPBT is presented in
Figure 8. As observed, a rise in fuel price to about 0.9% cost/kg has a positive effect on the IRR which climbs linearly above 140 % and a rapid reduction in the DPBT to less than 4 years. The main reason for this is that annual fuel‐saving is the lone driver of returns in this scenario. Therefore, as the fuel savings rises, the ORC retrofit internal yield improves correspondingly until additional cash returns in savings add comparably less to the already high cash flow, before the IRR alters retrogressively.
Figure 8. Influence of the Fuel Price Variation on DPBT and IRR.
Moreover, having a stable CAPEX, higher annual net cash flows ensure repayment of the investment capital faster; thereby shortening the DPBT until further fuel price changes have diminishing effect. Furthermore, this sensitivity analysis highlights to a greater depth the influence of energy price carries on energy investments and particularly WHRS portfolios. It is therefore important to note that fuel price behaviour over the life span of a retrofitted ORC-WHRS onboard introduces considerable risk to the economic performance and feasibility of the retrofitted system.
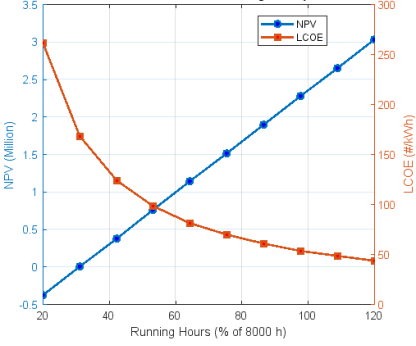
Figure 9 demonstrate the effect of the ORC retrofit running hours on annual basis on NPV of the project and LCOE. The graph illustrates that as the ORC running hour increases evenly from 20 to 120%, the NPV also increases in a proportionate response from -0.5 to above 3 million while at the same time, the LCOE declines logarithmically along the running hour axis.
Figure 9. Effect of Running Hours on NPV and LCOE of the ORC Retrofit.
The more hours the ORC is operational leads to more energy being harnessed and which culminates into higher fuel savings, thus a positive NPV. At this point the retrofit is economically profitable. Analyzing further, the NPV curve revealed that below 60% of base running hours, NPV may turn negative causing the ORC retrofit investment unbeneficial and unviable. Above 60% of base running hours, the NPV rises, signaling the ranges of viability/feasibility of the ORC retrofit economically especially in the GOG. It is also evident from the graph that the NPV’s growth, fuel savings and ORC retrofit in the GOG is most viable at high operational time preferably from 7000 hours annually. Obviously, from the curves, a blend of less running hours and high interest rate impedes the viability/sustainability of the ORC investment in the GOG.
3.2. Sensitivity Analysis of the Retrofit System
Additionally,
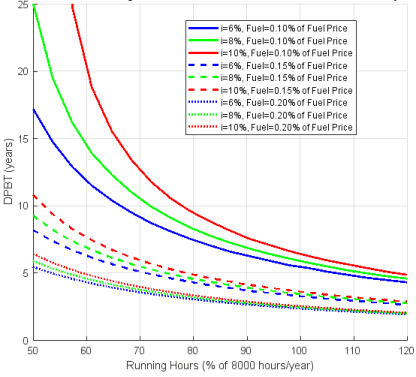
Figure 10 presents the sensitivity analysis of the combined effect of fuel price and interest rate, on the DPBT based on running hours of the ORC retrofit. It can be noticed from the graph that a combination of higher fuel prices and running hours reduces the DPBT significantly.
Figure 10. Interest Rate and Fuel Price Sensitivity on ORC DPBT and Running Hours.
Similarly, the combine effect of fuel price and interest rate, on NPV of investment is presented in
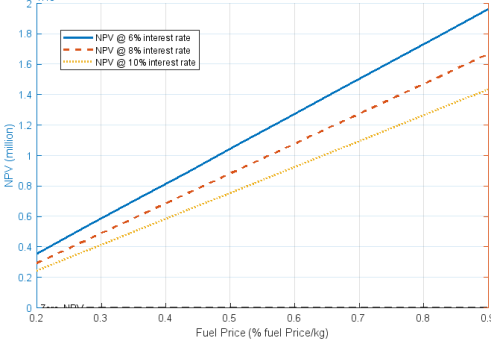
Figure 11. As estimated, an increase in the fuel price and decrease in interest rate maximizes the viability of the ORC retrofit fiscally, since the NPV of investment shows increment positively. From the graphs, the economic indexes that are significantly affected by altering the running hour, fuel price and interest rate are the NPV and the DPBT.
Explicitly, the relative changes noticed in LCOE owing to variation in ORC running hours’ is infinitesimal for the three-interest rate considered and variations in IRR are independent of interest rate, as already mentioned earlier, therefore does not respond to changes involving interest rate. These evaluations provide the fulcrum for ideal blends of variables to look out for so as to obtain a viable ORC retrofit onboard a vessel in the GOG.
Figure 11. Interest Rate and Fuel Price Sensitivity Analysis on ORC NPV.
4. Conclusions
recuperating waste thermal energy is one amongst other phenomenal approaches to optimize ship energy efficiency, minimize fuel consumption and mitigate emissions onboard ships. Huge amount of harvestable WH which are often released into the environment, and their ultimate utilization is seen as significant approach for accomplishing a technically cost-effective decarbonization for ships. This study examined a detailed thermodynamic and economic analysis of MDE retrofitted with an ORC unit to harness lower grade WH onboard and convert them to useful energy for auxiliary usage. Results of this research are attained through computational approach built on ORC retrofit thermodynamic and economic models. The OWF properties were obtained from REFPROP 9.0. Mass and energy balance equations were employed to evaluate the ORC thermodynamic parametric performance and the outputs then serves as inputs for the economic viability model. The obtained results permit the identification of some fundamental economic indicators combination for optimal performance of the retrofitted system onboard the case study vessel considered to achieve the imposed target of improving energy efficiency, operational cost and emission reduction.
Several scenarios of the ORC retrofit were evaluated. Economically from the CAPEX point of view, result indicated that 20 to 60% CAPEX is the most attractive range, because the NPV at this range remains very strong and the PBP will be achieved faster at an appreciable margin. Interestingly, above 60% CAPEX, though the NPV still remains positive, the LCOE approaches ₦ 189.00 per kWh threshold, above which the cost of electricity generated by the ORC retrofit will be more than the cost of electricity supplied from the national grid at 209.5 ₦/kWhr in the Nigerian context, making the retrofit project unattractive to ship owners in this part of the GOG.
Meanwhile, an interest rate of less than 8 % produces a strongly positive NPV and a LCOE of ₦80 per kWh. Therefore, investment in the retrofit technology is very favourable at this range of economic indexes, hence highly attractive as an investment option. While above 8% interest rate can wane the gains of the ORC WHRS, causing appreciable decline in NPV and LCOE values, thereby presenting a negative outlook of the ORC retrofit project to ship owners.
Furthermore, it is therefore important to note that fuel price behaviour over the life span of a retrofitted ORC-WHRS onboard introduces considerable risk to the economic performance and feasibility of the retrofitted system. Analysis of the NPV curve revealed that below 60% of base running hours, NPV may turn negative causing the ORC retrofit investment unviable. Above 60% of base running hours, the NPV rises, indicating the ranges of viability/feasibility of the ORC retrofit economically, especially in the GOG. It is also evident from the graph that the NPV’s growth, fuel savings and ORC retrofit in the GOG is most viable at high operational time preferably from 7000 hours annually. Obviously, from the curves, a blend of less running hours and high interest rate impedes the viability/sustainability of the ORC investment in the GOG. By contrast, a combination of higher running hours and low interest rate enhances the viability/sustainability of the ORC investment in the GOG.
This work identifies numerous key economic indicators in ORC retrofit onboard a vessel that navigate within the GoG, such as acceptable CAPEX range, NPV and LCOE, influence of interest rate and operational window of the ORC. This study underscores the necessity of a proper combination of the various economic parametric indicators of the ORC WHRS retrofit for enhance viability of the system, balancing operational feasibility and economic viability. This balance is crucial to actualize the full benefit of the retrofitted ORC system aligning thermodynamic applications and economic viability within a strict operational context. This highlights ORC WHRS retrofit advantage in promoting ship energy efficiency improvement, reduction in operational cost and mitigation of CO2 emission consolidating on the environmental footprints potentials of ships towards attaining green shipping across the GoG.
Future research tips proposed will focus on implementing other technologies or approaches, such as thermoelectric system and the application of thermionic principles for electricity generation onboard which could constitute a prime solution for energy efficiency enhancement and decarbonization of the marine industry. Furthermore, the study should be extended to different types of vessels outside tanker ships to gain more insights into energy efficiency improvement and decarbonization of the maritime space. This research is amongst the steps in a holistic approach geared toward advancing ship retrofit technology implementation to achieve current and future marine energy efficiency and environmental footprint enhancement.
Author Contributions
Victor Effiong Odokowo: Formal Analysis, Funding acquisition, Investigation, Methodology, Resources, Software, Visualization, Writing – original draft, Writing – review & editing
Robert Poku: Data curation, Formal Analysis, Investigation, Methodology, Resources, Software, Validation
Oyinkepreye Lucky Bebeteidoh: Data curation
Ezenwa Alfred Ogbonnaya: Conceptualization, Funding acquisition, Project administration, Supervision, Validation





 Share This Article
 Twitter
 Linked In
 Facebook
 Copy
Copy Download