Abstract
Bus bunching is usually treated as a service-quality problem: passengers wait longer and crowd into the first of two buses that arrive together. This paper argues that it is also a vehicle-operation problem, because irregular headways translate directly into irregular bus mass, dwell time and fuel use. The argument is tested on route No. 2 "Chorsu – Otchopar" in Namangan, Uzbekistan, a 14.6 km central route served by twelve 70-passenger buses and carrying about 8,240 passengers per day. Segment lengths and running times from the route passport show technical speeds ranging from 4 to 45 km/h; five short segments near markets and junctions take up 9% of the route length but 24% of the running time. A stochastic multi-bus simulation of the morning peak was built on these data, with stop dwell times linked to boarding and alighting, lognormal running-time noise and no overtaking. Four operating regimes were compared over 30 replications each: the current schedule-based service with a 12-min headway, holding at four control stops, transit signal priority (TSP) on the congested segments, and an integrated regime that combines a 9-min headway, holding, TSP and faster card payment. Under the current regime the headway coefficient of variation grows along the route from 0.11 to 0.52, which confirms the self-reinforcing nature of delays. Holding alone stabilised headways (coefficient of variation 0.24) but lengthened the trip by 2.4 min and slightly raised fuel use. TSP shortened the trip by 9.4% but left headways irregular. The integrated regime cut the mean passenger wait from 6.8 to 4.7 min, reduced trips reaching full capacity from 3.3% to 0.2% and lowered estimated diesel consumption by about 10%, while the spread of fuel use between trips narrowed by a factor of 2.3. The results suggest that headway control and signal priority should be planned together, and that their benefits for the operator are understated when only passenger waiting time is counted. The study is model-based; field validation with automatic vehicle location and fuel records is the next step.
Keywords
Bus Bunching, Headway Variability, Transit Signal Priority, Holding Control, Bus Load Factor, Fuel Consumption, Microsimulation, Namangan
1. Introduction
Anyone who has waited at the Sardoba bazaar stop in Namangan during the morning peak knows the pattern: no bus for twenty minutes, then two buses of the same route, the first one packed and the second almost empty. Transport engineers call this bus bunching. The literature on it is long and mostly written from the passenger's side, and for good reason, because irregular service inflates waiting time and makes travel time unpredictable; a recent review organises this literature by demand, supply and control perspectives
| [1] | Rezazada, M., Nassir, N., Tanin, E., Ceder, A. Bus Bunching: A Comprehensive Review from Demand, Supply, and Decision-Making Perspectives. Transport Reviews. 2024, 44(4), 766–790. https://doi.org/10.1080/01441647.2024.2313969 |
[1]
. Our position in this paper is narrower and, we think, under-examined. Bunching is also a problem of how the vehicle is used. A bus that arrives late picks up more people, becomes heavier, stays longer at stops and idles more; its follower runs light and catches up. Both buses therefore operate far from the conditions assumed in fuel norms and maintenance plans.
The mechanism is well established: a schedule becomes unstable as soon as dwell time depends on the headway in front of the bus
| [1] | Rezazada, M., Nassir, N., Tanin, E., Ceder, A. Bus Bunching: A Comprehensive Review from Demand, Supply, and Decision-Making Perspectives. Transport Reviews. 2024, 44(4), 766–790. https://doi.org/10.1080/01441647.2024.2313969 |
[1]
. Empirical work with automatic vehicle location and passenger counts in Portland showed that bunching adds about 10 s to dwell time and about 40 s to running time
| [2] | Verbich, D., Diab, E., El-Geneidy, A. Have They Bunched Yet? An Exploratory Study of the Impacts of Bus Bunching on Dwell and Running Times. Public Transport. 2016, 8(2), 225–242. https://doi.org/10.1007/s12469-016-0126-y |
[2]
. Control research has moved from simple holding rules to holding that accounts for running-time dynamics
| [3] | Sánchez-Martínez, G. E., Koutsopoulos, H. N., Wilson, N. H. M. Real-Time Holding Control for High-Frequency Transit with Dynamics. Transportation Research Part B: Methodological. 2016, 83, 1–19. https://doi.org/10.1016/j.trb.2015.11.013 |
[3]
, real-time dispatching
| [4] | Berrebi, S. J., Watkins, K. E., Laval, J. A. A Real-Time Bus Dispatching Policy to Minimize Passenger Wait on a High Frequency Route. Transportation Research Part B: Methodological. 2015, 81, 377–389. |
[4]
, combined speed guidance and signal adjustment
| [5] | Bie, Y., Xiong, X., Yan, Y., Qu, X. Dynamic Headway Control for High-Frequency Bus Line Based on Speed Guidance and Intersection Signal Adjustment. Computer-Aided Civil and Infrastructure Engineering. 2020.
https://doi.org/10.1111/mice.12446 |
[5]
and, most recently, holding policies learned by deep reinforcement learning
| [6] | Wang, J., Sun, L. Dynamic Holding Control to Avoid Bus Bunching: A Multi-Agent Deep Reinforcement Learning Framework. Transportation Research Part C: Emerging Technologies. 2020, 116, 102661.
https://doi.org/10.1016/j.trc.2020.102661 |
[6]
. Crowding has been costed in its own right using smart-card and vehicle-location data
| [7] | Hörcher, D., Graham, D. J., Anderson, R. J. Crowding Cost Estimation with Large Scale Smart Card and Vehicle Location Data. Transportation Research Part B: Methodological. 2017, 95, 105–125. https://doi.org/10.1016/j.trb.2016.10.015 |
| [8] | Cats, O., West, J., Eliasson, J. A Dynamic Stochastic Model for Evaluating Congestion and Crowding Effects in Transit Systems. Transportation Research Part B: Methodological. 2016, 89, 43–57. |
[7, 8]
, and travel time and occupancy have been forecast jointly as interdependent quantities
| [9] | Chen, X., Cheng, Z., Schmidt, A. M., Sun, L. Conditional Forecasting of Bus Travel Time and Passenger Occupancy with Bayesian Markov Regime-Switching Vector Autoregression. Transportation Research Part B: Methodological. 2025, 192, 103147.
https://doi.org/10.1016/j.trb.2024.103147 |
[9]
. These studies are rigorous, but nearly all of them measure success in passenger minutes. The bus itself appears only as a capacity constraint. For a city such as Namangan, where the operator is paid under a gross-cost contract and carries the fuel bill, that omission matters: an operator will not invest in headway control unless the effect on its own costs is visible.
Namangan is a useful test case. Between 2024 and 2025 the city put 96 new Yutong and Zhongtong buses into service on nine routes under gross-cost contracts
, yet observations on the main routes still show unstable headways. Route No. 2 "Chorsu – Otchopar" is typical. It crosses the city centre, passes two large markets and several unsignalised and signalised junctions, and its timetable interval of 12–15 min is often not kept. In earlier work we analysed passenger flows and their variation on Namangan routes
| [11] | Mamirov, U. X., Turg‘unov, I. B. Methodology for Analyzing Changes in Passenger Flow (A Case Study of Namangan). Mekhanika i Tekhnologiya. 2023, 1(4), 108–117. |
| [12] | Mamirov, U., Tumanbayeva, B., Xakimov, R., Tovoldiyeva, N. Passenger Flow Analysis and Influence Factors (in Case of Namangan City). Universum: Technical Sciences. 2023, 6-4(111), 53–59. |
[11, 12]
and the speed of buses on regulated street segments
| [13] | Mamirov, U. X., Soliyev, M. R. Assessment of Communication Speed on a Street Segment of a Signalized Road Network (A Case Study of Namangan City). Mekhanika i Tekhnologiya. 2023, 1(10), 136–142. |
[13]
; this paper takes the next step and links headway dynamics to vehicle load and fuel use.
The study has three objectives: (i) to describe the operating conditions of route No. 2 from its passport data; (ii) to build a stochastic multi-bus simulation that reproduces the growth of headway variability along the route; and (iii) to compare four operating regimes in terms of both passenger indicators and vehicle indicators — load factor, share of trips at full capacity and fuel use per trip. We do not claim that simulation replaces field data. The model is a tool for ranking measures before money is spent on detectors and dispatch software, and its limits are discussed openly in Section 5.
2. Route No. 2 and Its Operating Conditions
2.1. Route Characteristics
Route No. 2 runs 14.59 km from Chorsu in the old centre to the Otchopar bus terminal. It has 27 stops, so the average stop spacing is about 560 m, which is close to the 500–800 m usually recommended for residential corridors and longer than the 300–500 m recommended for city centres
| [14] | Ceder, A. Public Transit Planning and Operation: Modeling, Practice and Behavior, 2nd ed. Boca Raton, FL: CRC Press; 2016. |
[14]
. Twelve Yutong buses with a nominal capacity of 70 passengers operate the route and carry about 8,240 passengers on a weekday. If each bus makes eight round trips, the average trip carries roughly 86 passengers, or 6–7 boardings and alightings per stop. These are modest numbers. The difficulty lies elsewhere — in the way running time is distributed along the route.
2.2. Where the Route Loses Time
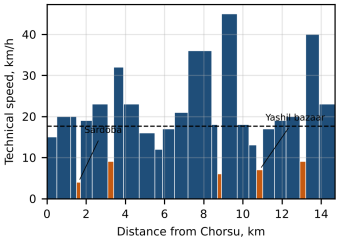
The route passport gives the length and the planned running time of each of the 26 segments. The total running time is 50 min, which corresponds to an average technical speed (speed while moving, excluding dwell) of 17.7 km/h. The average hides a wide spread. Segment speeds range from 4 km/h between Matbuot uyi and the Sardoba bazaar to 45 km/h on the open section after the 17th bus depot (
Figure 1).
Five segments are slower than 10 km/h (
Table 1). Together they measure 1.3 km, about 9% of the route, but they take 12 min, or 24% of the planned running time. Each of them sits next to a market, a shopping centre or a busy junction where buses queue behind turning traffic and pedestrians cross in front of the stop. From the driver's seat these places look the same: stop, creep, stop again. From the modeller's point of view they matter for another reason. Running time on such segments is not only longer but also more variable, and variability, not the mean, is what starts bunching.
Figure 1. Technical speed on the 26 segments of route No. 2, Chorsu to Otchopar. Orange bars mark segments slower than 10 km/h; the dashed line is the route average.
Table 1. Segments of route No. 2 with technical speed below 10 km/h.
Segment | Length, km | Running time, min | Speed, km/h | Main cause of delay |
Matbuot uyi – Sardoba bazaar | 0.20 | 3 | 4 | Market, pedestrian crossings |
Shodlik shopping centre – Polyclinic No. 3 | 0.30 | 2 | 9 | Junction queue |
Tegen – 17th bus depot | 0.20 | 2 | 6 | Turning traffic, depot access |
Ishonch – Yashil dehqon bazaar | 0.30 | 3 | 7 | Market, kerbside parking |
Al-mashriq – Milliy bank | 0.30 | 2 | 9 | Signalised junction |
Total (5 of 26 segments) | 1.30 | 12 | 6.5 | – |
Source: route passport; causes from the authors' field observations.
2.3. The Delay Feedback Loop
The way a small delay grows can be written in two lines. If bus i reaches a stop Δt later than planned, the number of passengers waiting for it increases by
where λs is the arrival rate of passengers at stop s. Dwell time grows with the number of boardings and alightings. For two-door low-floor buses with card payment we use
with α = 5 s for door opening and closing, β = 2.5 s per boarding passenger and γ = 1.5 s per alighting passenger. These values are of the same order as boarding and alighting times reported for low-floor buses with smart-card payment
| [14] | Ceder, A. Public Transit Planning and Operation: Modeling, Practice and Behavior, 2nd ed. Boca Raton, FL: CRC Press; 2016. |
[14]
, but they were not measured on route No. 2 and should be checked against ATTO transaction times. At the busiest stops of route No. 2, 15 boardings and 10 alightings give a dwell of 57.5 s; a bus that is 4 min late at Sardoba, where passengers arrive at about 0.6 per minute, picks up 2–3 extra people and loses another 6–7 s. A few seconds per stop looks harmless. Over 26 stops it is not, because the extra dwell delays the bus further and the loop repeats.
2.4. Waiting Time and Headway Variability
For passengers who arrive at random, the expected waiting time depends on both the mean headway and its variability
| [1] | Rezazada, M., Nassir, N., Tanin, E., Ceder, A. Bus Bunching: A Comprehensive Review from Demand, Supply, and Decision-Making Perspectives. Transport Reviews. 2024, 44(4), 766–790. https://doi.org/10.1080/01441647.2024.2313969 |
| [4] | Berrebi, S. J., Watkins, K. E., Laval, J. A. A Real-Time Bus Dispatching Policy to Minimize Passenger Wait on a High Frequency Route. Transportation Research Part B: Methodological. 2015, 81, 377–389. |
[1, 4]
:
where E[H] and σH are the mean and standard deviation of the headway and Cv is its coefficient of variation. With a 12-min headway and σH = 3 min, the expected wait is 6.4 min instead of the ideal 6.0 min. That difference is small; at Cv = 0.5 it rises to 7.5 min, and the relationship is quadratic. Headways cannot be negative and their distribution is skewed to the right, so we describe them with a lognormal law,
(4)
2.5. From Headways to Bus Load
The load on the busiest segment of a trip is roughly proportional to the headway in front of the bus. If the average peak load factor on that segment is γ̄, the load factor of bus i is approximately γi ≈ γ̄ hi/E[H], so the load factor inherits the coefficient of variation of the headway. Combining this with Equation (
4) gives the probability that a bus reaches full capacity:
where Φ is the standard normal distribution function. With γ̄ = 0.64 and Cv = 0.42 this probability is about 0.10; at Cv = 0.2 it falls to about 0.01. For the operator, a full bus is a heavier bus. For a 12-m bus, 70 extra passengers add roughly 4.8 t, about 40% of the curb mass. That raises rolling resistance, the energy spent on each acceleration and the load on brakes and suspension. This is the link between bunching and vehicle operation that the rest of the paper quantifies.
3. Materials and Methods
3.1. Simulation Model
We built an event-based simulation of one direction of route No. 2 (Chorsu to Otchopar) during a three-hour morning peak. The model is deliberately simple. A full microscopic model of the corridor exists in PTV Vissim, but it is too slow for the hundreds of replications needed to estimate distributions of load and headway; the event model was used for that purpose. Its mean operating speed for the current regime, 15.2 km/h, is about 7% higher than the 14.2 km/h obtained in the microscopic runs, mainly because the event model has no explicit queues at signals; we accept this difference for a comparative study but return to it in Section 5.
The main assumptions are as follows. Running time on each segment equals the passport time multiplied by a lognormal random factor with unit mean; its standard deviation is 0.20 on free-flowing segments and 0.45 on the five congested segments of
Table 1. Buses are dispatched from Chorsu at the scheduled headway with a dispatch error of ±1 min (standard deviation). Buses cannot overtake, and a follower reaches a stop at least 10 s after its leader. Passengers arrive at stops as a Poisson process. The peak-hour boarding rate in the analysed direction was set at 495 passengers per hour, which corresponds to about 12% of daily ridership in each direction; it was distributed among stops with weights reflecting land use (terminals, markets and shopping centres received weights of 1.5–3.0, other stops 1.0). Each boarding passenger chooses an alighting stop downstream with probabilities proportional to similar weights. Bus capacity is 70; passengers who cannot board wait for the next bus. Dwell time follows Equation (
2).
3.2. Operating Regimes
Four regimes were compared (
Table 2). R1 represents current practice. R2 adds holding at four control stops — Chorsu, Shodlik shopping centre, Pakhlavon sport and Yashil dehqon bazaar — where a bus that is early relative to its leader waits until
(6)
has elapsed, with k
h = 0.85. The factor below one is a practical compromise: strict holding (k
h = 1) regularises headways better but lengthens trips noticeably, which drivers and passengers both resist. R3 applies transit signal priority on the congested segments, modelled as a 25% reduction of mean running time and a lower variability there, and a 7% reduction elsewhere. These figures are assumptions informed by the TSP literature
| [15] | Anderson, P., Daganzo, C. F. Effect of Transit Signal Priority on Bus Service Reliability. Transportation Research Part B: Methodological. 2020, 132, 2–14.
https://doi.org/10.1016/j.trb.2019.01.016 |
| [16] | Transportation Research Board. Highway Capacity Manual: A Guide for Multimodal Mobility Analysis, 7th ed. Washington, DC: Transportation Research Board; 2022. |
[15, 16]
and by our microscopic runs, not measured values. R4 combines a 9-min headway, holding, TSP and faster boarding (β = 1.5 s), which full use of the ATTO contactless payment system should make possible.
Table 2. Operating regimes compared in the simulation.
Regime | Headway, min | Holding | TSP | Boarding time β, s |
R1 Schedule-based (current) | 12 | No | No | 2.5 |
R2 Holding | 12 | Yes, 4 stops | No | 2.5 |
R3 Signal priority | 12 | No | Yes | 2.5 |
R4 Integrated | 9 | Yes, 4 stops | Yes | 1.5 |
3.3. Indicators
For each regime the model was run 30 times with different random seeds; the first three buses of each run were discarded as warm-up. We recorded trip time, the coefficient of variation of headways at each stop, the share of headways shorter than 0.3 of the scheduled value (our definition of a bunching event), the mean passenger wait from Equation (
3) using the observed headways, the distance-weighted mean load factor and the maximum load factor of each trip.
Fuel use per trip was estimated for a 12-m diesel bus with a reduced-form model derived from a power-based vehicle model of the kind developed by Wang and Rakha for conventional diesel buses
; the load term follows the evidence that passenger load measurably changes bus fuel use
| [18] | Yu, Q., Li, T., Li, H. Improving Urban Bus Emission and Fuel Consumption Modeling by Incorporating Passenger Load Factor for Real World Driving. Applied Energy. 2016, 161, 101–111. https://doi.org/10.1016/j.apenergy.2015.09.096 |
[18]
:
where Q is fuel use in L/100 km, τ is the time per kilometre (s/km), n
st is the number of stops per kilometre, v
c is the cruising speed (m/s) and γ is the mean load factor. The coefficients b
0 = 10.20, b
1 = 0.0601, b
2 = 0.0601 and b
3 = 8.05 were fitted to 260 simulated driving cycles of a 12-m diesel bus (R² = 0.894). Their physical meaning is transparent: b
1 reflects idling and auxiliary consumption, b
2 the fuel needed to re-accelerate after each stop and b
3 the cost of carrying passengers. We treat Equation (
7) as an estimating device, not as a substitute for measured consumption.
4. Results
4.1. Growth of Headway Variability Along the Route
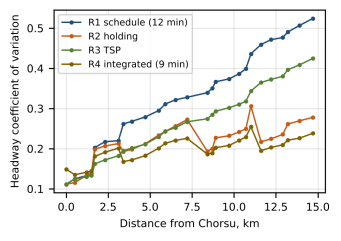
Under the current regime the headway coefficient of variation rises almost steadily from 0.11 at Chorsu to 0.52 at Otchopar (
Figure 2). The steepest increases follow the Sardoba bazaar, Polyclinic No. 3 and Yashil dehqon bazaar segments — exactly the places listed in
Table 1. This is what the feedback loop of Section 2.3 predicts, and it explains why passengers at the outer end of the route complain most about irregular service.
Figure 2. Coefficient of variation of headways along route No. 2 under the four operating regimes.
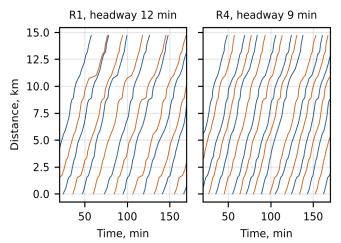
The regimes differ in how they bend this curve. Holding (R2) flattens it after each control stop and ends at 0.28. TSP (R3) lowers it only moderately, to 0.42 at the terminal, because it shortens running times without removing the feedback between delay and dwell. The integrated regime keeps the coefficient between 0.15 and 0.24 over the whole route.
Figure 3 shows the same contrast as time–space trajectories from one replication: in R1, pairs of buses merge in the second half of the route; in R4 the lines stay roughly parallel.
Figure 3. Time–space trajectories of buses on route No. 2 in one replication: R1 (left) and R4 (right).
4.2. Passenger and Vehicle Indicators
Table 3 summarises the four regimes. The results are averages of 30 replications; values after ± are standard deviations across trips.
Table 3. Simulation results for the morning peak (30 replications per regime).
Indicator | R1 | R2 | R3 | R4 |
Trip time, min | 57.9 ± 4.0 | 60.3 ± 3.0 | 52.4 ± 2.9 | 50.9 ± 1.9 |
Operating speed, km/h | 15.2 | 14.6 | 16.8 | 17.3 |
Headway Cv, second half of route | 0.42 | 0.24 | 0.34 | 0.22 |
Bunching events, % of headways | 5.8 | 0.1 | 2.9 | 0.0 |
Mean passenger wait, min | 6.77 | 6.31 | 6.49 | 4.70 |
Mean dwell time, s | 19.2 | 19.1 | 19.2 | 12.9 |
Mean load factor | 0.45 ± 0.12 | 0.44 ± 0.09 | 0.45 ± 0.11 | 0.34 ± 0.07 |
Trips reaching full capacity, % | 3.3 | 0.7 | 2.4 | 0.2 |
Diesel fuel use, L/100 km | 34.4 ± 1.8 | 35.0 ± 1.2 | 32.2 ± 1.5 | 30.9 ± 0.8 |
5–95% range of fuel use, L/100 km | 31.7–37.4 | 33.3–37.0 | 29.9–34.6 | 29.8–32.3 |
Bunching event: headway shorter than 0.3 of the scheduled headway. Fuel use from Equation (
7) for a 12-m diesel bus.
Three findings stand out. First, holding works for passengers but not for the operator. It almost eliminates bunching and cuts the share of full trips from 3.3% to 0.7%, yet the trip becomes 2.4 min longer and estimated fuel use rises by 1.6%, because the bus spends the holding time idling. Second, TSP works for the operator but only partly for passengers. Trip time falls by 9.4% and fuel use by 6.4%, while headways remain irregular. Third, the combination is more than the sum of its parts. In R4 the mean wait falls by 30.5%, from 6.77 to 4.70 min, full trips practically disappear, and fuel use falls by about 10%.
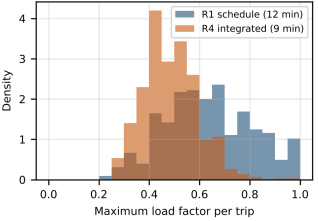
Figure 4. Distribution of the maximum load factor per trip under R1 and R4.
The vehicle-side result that we consider most important is less visible in the averages. In R1 the fuel use of individual trips varies between 31.7 and 37.4 L/100 km (5th to 95th percentile), a spread of 5.7 L/100 km. In R4 the spread narrows to 2.5 L/100 km.
Figure 4 shows the corresponding change in the maximum load of each trip: the long right tail of heavily loaded trips in R1 is cut off in R4.
5. Discussion
The simulation supports the view stated in the introduction: headway regularity is not only a matter of passenger comfort. It changes how the bus is loaded, how long it idles and how much fuel it burns. The magnitude is modest in average terms — about 10% of fuel in the integrated regime, much of which comes from shorter trips rather than from regular headways as such. The more practical gain is predictability. When trip-to-trip fuel use varies by 5–6 L/100 km, a depot cannot tell a badly driven bus from a bus that simply drew a heavy trip. With a spread of 2–3 L/100 km, fuel monitoring becomes meaningful. The size of the effect is plausible when set against field evidence: Verbich et al. measured about 40 s of extra running time per bunching occurrence in Portland
| [2] | Verbich, D., Diab, E., El-Geneidy, A. Have They Bunched Yet? An Exploratory Study of the Impacts of Bus Bunching on Dwell and Running Times. Public Transport. 2016, 8(2), 225–242. https://doi.org/10.1007/s12469-016-0126-y |
[2]
, while our model attributes a 2.4-min longer trip to holding alone; both figures say that regularity is bought with time, and time is fuel.
The comparison of R2 and R3 echoes earlier findings. Sánchez-Martínez et al. showed that holding is most effective when it anticipates running-time variation rather than reacting to it
| [3] | Sánchez-Martínez, G. E., Koutsopoulos, H. N., Wilson, N. H. M. Real-Time Holding Control for High-Frequency Transit with Dynamics. Transportation Research Part B: Methodological. 2016, 83, 1–19. https://doi.org/10.1016/j.trb.2015.11.013 |
[3]
, and Anderson and Daganzo examined analytically how signal priority affects service reliability, concluding that its effect depends on how priority is granted relative to headways
. Our results agree on the effectiveness of holding, but they add a caveat that is easy to miss in passenger-centred studies: holding converts irregularity into idling. On a route where the operator pays for fuel, holding alone is therefore a hard sell. TSP has the opposite profile. It is attractive to the operator, yet without headway control it leaves the root of bunching — the delay–dwell feedback — untouched. In our microscopic runs of the same corridor the conclusion was the same: signal priority gave the highest bus speed, while headway control gave the most regular service.
Several limitations should be stated plainly. The demand pattern was synthesised from daily ridership and land-use weights, not from stop-level counts; ATTO card data can provide such counts, and we intend to use them. The TSP effect was imposed as a reduction of segment running times instead of being simulated signal by signal, and the event model has no explicit signal queues, which is why its operating speed is about 7% higher than in the Vissim runs. The fuel model is a regression on simulated cycles, and its absolute values need checking against the operator's fuel records; the regression also assumes a single cruising speed, which is a simplification for a route with segment speeds from 4 to 45 km/h. Finally, the model covers one direction and one peak period. None of these limitations is likely to reverse the ranking of the regimes, but they do mean that the percentages in
Table 3 should be read as estimates of order of magnitude rather than as forecasts.
There is also a question of transferability. Route No. 2 has a moderate load: even at the peak the mean load factor was 0.45. On more crowded routes the load-related effects would be stronger, and denied boarding — practically absent here — would become a real issue. On routes without strong bottlenecks, by contrast, TSP would bring less.
a) These findings suggest that the effectiveness of bus service management strategies depends on route characteristics, passenger demand, and the location of major bottlenecks. Therefore, the proposed approach should be tested on routes with different passenger volumes and traffic conditions before its results are generalised to other urban bus networks. A combined strategy involving headway control and transit signal priority may provide a more balanced solution by improving service regularity while limiting unnecessary idling and fuel consumption.
b) Future research will focus on validating the proposed fuel consumption model using actual bus operator fuel records and stop-level passenger demand data obtained from the ATTO system. Further studies will also examine multiple routes, peak and off-peak periods, and different traffic conditions, while explicitly modelling signal operations and queues. This will help assess the transferability of the findings and identify effective combinations of headway control and transit signal priority for improving bus service reliability and fuel efficiency.
6. Conclusions
Bus bunching on route No. 2 in Namangan grows out of a small number of slow, variable segments near markets and junctions; five segments covering 9% of the route account for a quarter of its running time.
A simulation of the morning peak showed that headway variability builds up along the route under the current schedule-based operation, reaching a coefficient of variation of about 0.5 at the terminal.
Holding alone regularises headways but makes buses idle longer and slightly increases fuel use. Signal priority alone shortens trips and saves fuel but leaves headways irregular.
The integrated regime — a 9-min headway, holding at four stops, signal priority on the bottleneck segments and faster card payment — reduced the mean passenger wait by about 30%, nearly eliminated trips at full capacity, lowered estimated diesel use by about 10% and halved the spread of fuel use between trips.
For operators working under gross-cost contracts, these vehicle-side effects are a stronger argument for headway control and signal priority than passenger waiting time alone. The next step is to validate the model with automatic vehicle location, ATTO payment data and fuel records from the route.
Abbreviations
ATTO | Automated Fare Payment System Used in Uzbek Cities |
TSP | Transit Signal Priority |
Cv | Coefficient of Variation |
AVL | Automatic Vehicle Location |
Author Contributions
Ulugbek Mamirov Xabibulayevich: Conceptualization, Data curation, Formal Analysis, Funding acquisition, Investigation, Methodology, Resources, Software, Validation, Writing – original draft, Writing – review & editing
Conflicts of Interest
The author declares no conflicts of interest.
References
| [1] |
Rezazada, M., Nassir, N., Tanin, E., Ceder, A. Bus Bunching: A Comprehensive Review from Demand, Supply, and Decision-Making Perspectives. Transport Reviews. 2024, 44(4), 766–790.
https://doi.org/10.1080/01441647.2024.2313969
|
| [2] |
Verbich, D., Diab, E., El-Geneidy, A. Have They Bunched Yet? An Exploratory Study of the Impacts of Bus Bunching on Dwell and Running Times. Public Transport. 2016, 8(2), 225–242.
https://doi.org/10.1007/s12469-016-0126-y
|
| [3] |
Sánchez-Martínez, G. E., Koutsopoulos, H. N., Wilson, N. H. M. Real-Time Holding Control for High-Frequency Transit with Dynamics. Transportation Research Part B: Methodological. 2016, 83, 1–19.
https://doi.org/10.1016/j.trb.2015.11.013
|
| [4] |
Berrebi, S. J., Watkins, K. E., Laval, J. A. A Real-Time Bus Dispatching Policy to Minimize Passenger Wait on a High Frequency Route. Transportation Research Part B: Methodological. 2015, 81, 377–389.
|
| [5] |
Bie, Y., Xiong, X., Yan, Y., Qu, X. Dynamic Headway Control for High-Frequency Bus Line Based on Speed Guidance and Intersection Signal Adjustment. Computer-Aided Civil and Infrastructure Engineering. 2020.
https://doi.org/10.1111/mice.12446
|
| [6] |
Wang, J., Sun, L. Dynamic Holding Control to Avoid Bus Bunching: A Multi-Agent Deep Reinforcement Learning Framework. Transportation Research Part C: Emerging Technologies. 2020, 116, 102661.
https://doi.org/10.1016/j.trc.2020.102661
|
| [7] |
Hörcher, D., Graham, D. J., Anderson, R. J. Crowding Cost Estimation with Large Scale Smart Card and Vehicle Location Data. Transportation Research Part B: Methodological. 2017, 95, 105–125.
https://doi.org/10.1016/j.trb.2016.10.015
|
| [8] |
Cats, O., West, J., Eliasson, J. A Dynamic Stochastic Model for Evaluating Congestion and Crowding Effects in Transit Systems. Transportation Research Part B: Methodological. 2016, 89, 43–57.
|
| [9] |
Chen, X., Cheng, Z., Schmidt, A. M., Sun, L. Conditional Forecasting of Bus Travel Time and Passenger Occupancy with Bayesian Markov Regime-Switching Vector Autoregression. Transportation Research Part B: Methodological. 2025, 192, 103147.
https://doi.org/10.1016/j.trb.2024.103147
|
| [10] |
Gazeta.uz. 12 Buses Delivered for Namangan Public Transport. Available from:
https://www.gazeta.uz/oz/2026/07/14/bus-namangan/
(accessed 3 October 2026)
|
| [11] |
Mamirov, U. X., Turg‘unov, I. B. Methodology for Analyzing Changes in Passenger Flow (A Case Study of Namangan). Mekhanika i Tekhnologiya. 2023, 1(4), 108–117.
|
| [12] |
Mamirov, U., Tumanbayeva, B., Xakimov, R., Tovoldiyeva, N. Passenger Flow Analysis and Influence Factors (in Case of Namangan City). Universum: Technical Sciences. 2023, 6-4(111), 53–59.
|
| [13] |
Mamirov, U. X., Soliyev, M. R. Assessment of Communication Speed on a Street Segment of a Signalized Road Network (A Case Study of Namangan City). Mekhanika i Tekhnologiya. 2023, 1(10), 136–142.
|
| [14] |
Ceder, A. Public Transit Planning and Operation: Modeling, Practice and Behavior, 2nd ed. Boca Raton, FL: CRC Press; 2016.
|
| [15] |
Anderson, P., Daganzo, C. F. Effect of Transit Signal Priority on Bus Service Reliability. Transportation Research Part B: Methodological. 2020, 132, 2–14.
https://doi.org/10.1016/j.trb.2019.01.016
|
| [16] |
Transportation Research Board. Highway Capacity Manual: A Guide for Multimodal Mobility Analysis, 7th ed. Washington, DC: Transportation Research Board; 2022.
|
| [17] |
Wang, J., Rakha, H. A. Fuel Consumption Model for Conventional Diesel Buses. Applied Energy. 2016, 170, 394–402.
https://doi.org/10.1016/j.apenergy.2016.02.124
|
| [18] |
Yu, Q., Li, T., Li, H. Improving Urban Bus Emission and Fuel Consumption Modeling by Incorporating Passenger Load Factor for Real World Driving. Applied Energy. 2016, 161, 101–111.
https://doi.org/10.1016/j.apenergy.2015.09.096
|
Cite This Article
-
APA Style
Xabibulayevich, U. M. (2026). Headway Instability, Uneven Bus Loading and Fuel Use on an Urban Bus Route: A Simulation Study of Route No. 2 in Namangan, Uzbekistan. American Journal of Traffic and Transportation Engineering, 11(5), 124-131. https://doi.org/10.11648/j.ajtte.20261105.15
 Copy
|
 Download
ACS Style
Xabibulayevich, U. M. Headway Instability, Uneven Bus Loading and Fuel Use on an Urban Bus Route: A Simulation Study of Route No. 2 in Namangan, Uzbekistan. Am. J. Traffic Transp. Eng. 2026, 11(5), 124-131. doi: 10.11648/j.ajtte.20261105.15
Copy
|
Download
AMA Style
Xabibulayevich UM. Headway Instability, Uneven Bus Loading and Fuel Use on an Urban Bus Route: A Simulation Study of Route No. 2 in Namangan, Uzbekistan. Am J Traffic Transp Eng. 2026;11(5):124-131. doi: 10.11648/j.ajtte.20261105.15
Copy
|
Download
-
@article{10.11648/j.ajtte.20261105.15,
  author = {Ulugbek Mamirov Xabibulayevich},
  title = {Headway Instability, Uneven Bus Loading and Fuel Use on an Urban Bus Route: A Simulation Study of Route No. 2 in Namangan, Uzbekistan},
  journal = {American Journal of Traffic and Transportation Engineering},
  volume = {11},
  number = {5},
  pages = {124-131},
  doi = {10.11648/j.ajtte.20261105.15},
  url = {https://doi.org/10.11648/j.ajtte.20261105.15},
  eprint = {https://article.sciencepublishinggroup.com/pdf/10.11648.j.ajtte.20261105.15},
  abstract = {Bus bunching is usually treated as a service-quality problem: passengers wait longer and crowd into the first of two buses that arrive together. This paper argues that it is also a vehicle-operation problem, because irregular headways translate directly into irregular bus mass, dwell time and fuel use. The argument is tested on route No. 2 "Chorsu – Otchopar" in Namangan, Uzbekistan, a 14.6 km central route served by twelve 70-passenger buses and carrying about 8,240 passengers per day. Segment lengths and running times from the route passport show technical speeds ranging from 4 to 45 km/h; five short segments near markets and junctions take up 9% of the route length but 24% of the running time. A stochastic multi-bus simulation of the morning peak was built on these data, with stop dwell times linked to boarding and alighting, lognormal running-time noise and no overtaking. Four operating regimes were compared over 30 replications each: the current schedule-based service with a 12-min headway, holding at four control stops, transit signal priority (TSP) on the congested segments, and an integrated regime that combines a 9-min headway, holding, TSP and faster card payment. Under the current regime the headway coefficient of variation grows along the route from 0.11 to 0.52, which confirms the self-reinforcing nature of delays. Holding alone stabilised headways (coefficient of variation 0.24) but lengthened the trip by 2.4 min and slightly raised fuel use. TSP shortened the trip by 9.4% but left headways irregular. The integrated regime cut the mean passenger wait from 6.8 to 4.7 min, reduced trips reaching full capacity from 3.3% to 0.2% and lowered estimated diesel consumption by about 10%, while the spread of fuel use between trips narrowed by a factor of 2.3. The results suggest that headway control and signal priority should be planned together, and that their benefits for the operator are understated when only passenger waiting time is counted. The study is model-based; field validation with automatic vehicle location and fuel records is the next step.},
 year = {2026}
}
Copy
|
Download
-
TY  - JOUR
T1  - Headway Instability, Uneven Bus Loading and Fuel Use on an Urban Bus Route: A Simulation Study of Route No. 2 in Namangan, Uzbekistan
AU  - Ulugbek Mamirov Xabibulayevich
Y1  - 2026/10/31
PY  - 2026
N1  - https://doi.org/10.11648/j.ajtte.20261105.15
DO  - 10.11648/j.ajtte.20261105.15
T2  - American Journal of Traffic and Transportation Engineering
JF  - American Journal of Traffic and Transportation Engineering
JO  - American Journal of Traffic and Transportation Engineering
SP  - 124
EP  - 131
PB  - Science Publishing Group
SN  - 2578-8604
UR  - https://doi.org/10.11648/j.ajtte.20261105.15
AB  - Bus bunching is usually treated as a service-quality problem: passengers wait longer and crowd into the first of two buses that arrive together. This paper argues that it is also a vehicle-operation problem, because irregular headways translate directly into irregular bus mass, dwell time and fuel use. The argument is tested on route No. 2 "Chorsu – Otchopar" in Namangan, Uzbekistan, a 14.6 km central route served by twelve 70-passenger buses and carrying about 8,240 passengers per day. Segment lengths and running times from the route passport show technical speeds ranging from 4 to 45 km/h; five short segments near markets and junctions take up 9% of the route length but 24% of the running time. A stochastic multi-bus simulation of the morning peak was built on these data, with stop dwell times linked to boarding and alighting, lognormal running-time noise and no overtaking. Four operating regimes were compared over 30 replications each: the current schedule-based service with a 12-min headway, holding at four control stops, transit signal priority (TSP) on the congested segments, and an integrated regime that combines a 9-min headway, holding, TSP and faster card payment. Under the current regime the headway coefficient of variation grows along the route from 0.11 to 0.52, which confirms the self-reinforcing nature of delays. Holding alone stabilised headways (coefficient of variation 0.24) but lengthened the trip by 2.4 min and slightly raised fuel use. TSP shortened the trip by 9.4% but left headways irregular. The integrated regime cut the mean passenger wait from 6.8 to 4.7 min, reduced trips reaching full capacity from 3.3% to 0.2% and lowered estimated diesel consumption by about 10%, while the spread of fuel use between trips narrowed by a factor of 2.3. The results suggest that headway control and signal priority should be planned together, and that their benefits for the operator are understated when only passenger waiting time is counted. The study is model-based; field validation with automatic vehicle location and fuel records is the next step.
VL  - 11
IS  - 5
ER  -
Copy
|
Download





 Share This Article
 Twitter
 Linked In
 Facebook
