Research Article | | Peer-Reviewed

Analysis of Water Chemical Quality Evolution in the Quaternary Aquifer of the Samba Dia Area (Central-western Senegal)

Received: 11 May 2026     Accepted: 25 May 2026     Published: 23 June 2026
Views:       Downloads:
Abstract

The Quaternary sand aquifer of the Samba Dia lens is a critically important water reserve for the municipalities of Fimela, Djilass, and Diofior, located near the Atlantic Ocean and hypersaline waters of the Saloum estuary in central-western Senegal. To assess the influence of this environment on groundwater quality, two water sampling campaigns were carried out in March 2021 and January 2024 on 33 wells. The objective of this study is to evaluate the evolution of groundwater chemical quality during this period. Data interpretation was performed using a multidisciplinary approach based on descriptive statistics of physicochemical parameters, identification of chemical facies using Piper's diagram, analysis of the mineralization process, the use of the hydrochemical facies evolution diagram (HFE-D) to measure the impact of recharge and basic ion exchange processes, and Stuyfzand classification to identify water types. A study of the suitability of water for various uses was also conducted to assess the evolution of water suitability between the two periods. The results indicate that this aquifer consists mainly of chloride facies. Four facies were identified in 2021: NaCl (72.72%), CaCl (12.12%), CaHCO3 (9.09%) and NaHCO3 (6.07%) increasing to five in 2024: NaCl (66.66%), CaHCO3 (24.24%), NaHCO3 (3.03%), CaCl (3.03%), MgCl (3.03%) with the emergence of a new magnesian facies. This evolution is marked by a generalized increase in seawater intrusion, which rises from 33.33% in 2021 to 66.66% in 2024. Several wells located in the center of the area, which were characterized in 2021 by a softening process, find themselves under the influence of saline water intrusion after three years. The Stuyzand classification indicates an increase in the representativeness of salt water in the aquifer, varying from 24.24% to 30.30% over three years. However, the suitability of the water for drinking and irrigation is not yet affected by the increase in salinity. This widespread increase in water salinity is the result of saltwater intrusion due to excessive pumping of the Quaternary aquifer, leaching of saline soils from the surface in coastal areas, reduced recharge in the center between the two periods, and a reverse ion exchange process in which Ca2+ and Mg2+ ions replace Na+ ions.

Published in American Journal of Water Science and Engineering (Volume 12, Issue 2)
DOI 10.11648/j.ajwse.20261202.13
Page(s) 64-77
Creative Commons

This is an Open Access article, distributed under the terms of the Creative Commons Attribution 4.0 International License (http://creativecommons.org/licenses/by/4.0/), which permits unrestricted use, distribution and reproduction in any medium or format, provided the original work is properly cited.

Copyright

Copyright © The Author(s), 2026. Published by Science Publishing Group

Keywords

Evolution, Chemical Quality, Quaternary Aquifer, Samba Dia, Senegal

1. Introduction
In central western Senegal, where the Samba Dia area is located, the water supply for the population's various uses relies mainly on the exploitation of underground resources . In this area, access to water is based mainly on the exploitation of the Quaternary aquifer captured by wells. This resource is therefore increasingly threatened by environmental phenomena on the one hand and by excessive pumping due to the gradual increase in water demand on the other. The surface waters of the coastal fringe, which border the salt waters of the Atlantic Ocean and the Saloum estuary, are subject to marine intrusion and a process of surface water salini-zation followed by leaching of salty soils and infiltration into the aquifer. From a quantitative perspective, a combination of meteorological, demographic, economic, and technical factors explains the gradual decline in the water table . The persistent drought in this region has led to a significant rainfall deficit, which has made it difficult to replenish the water table due to reduced recharge. This has resulted in a gradual decline in the water table and the disappearance of much of the surface water over time . The few rivers that still exist are temporary and disappear at the end of the rainy season. Compunding this phenomenon is the strong population growth in the area and the rapid development of market gardening, tourism, and commercial activities, which are causing an explosion in water demand . To address the local resource deficit, water transfers are carried out as additional resources from the Tassette boreholes through the Notto Ndiosmone Palmarin (NDP) system. However, the NDP's performance has declined over time as demand for water has in-creased. It has also been established that, in addition to its low supply flow, the NDP network is poorly dimensioned, with a larger diameter downstream than upstream , resulting in a drop in pressure on the downstream side in addition to pressure losses. The exploitation of the aquifer is thus increasing, and in view of the aforementioned threats and having already carried out a hydrochemical characterization of the aquifer, we considered it necessary to monitor changes in the chemistry of the water in order to be able to propose a groundwater management model in the future. Our study aims to analyze changes in water chemistry between 2021 and 2024 using a variety of chemical approaches. Between the two periods, we will determine the chemical facies of the water, re-examine the processes of groundwater salinization, and analyze the evolution of chemical facies and the geochemical processes that control this evolution. This study is structured in two main parts: (1) materials and meth-ods, which includes a presentation of the study area, a description of the equipment and methodology, and finally (2) a discussion of the results obtained.
2. Materials and Methods
2.1. Presentation of the Study Area
2.1.1. Geographic and Climatic Context
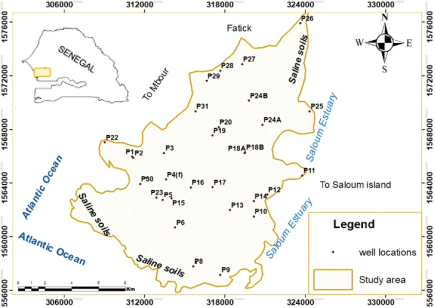
Figure 1. Geographical location of the study area.
The study area consists mainly of the village of Samba Dia and the surrounding villages, which are administratively attached to the department of Fatick and divided between the municipalities of Fimela, Diofior, and Djilass. It is located 100 km south of Dakar, marking the boundary between the Petite Côte region and the Saloum Delta. The site is bordered to the east by the municipality of Diofior (Fatick department), to the northwest by the villages of Fadial, Nguéniene, and the municipality of Joal Fadiouth (Figure 1). It is bordered to the southwest by the tourist villages of Ndangane Campement and Ndagane Sambou and to the southeast by the Saloum estuaries. The terrain is relatively flat, sloping towards the lowlying areas of the Saloum Islands . The boundary between the area and the tannes is often marked by a more or less steep slope, giving the area a plateau-like appearance with tannes no higher than 2 to 3 m . The climate is tropical Sudano-Sahelian, influenced by ocean currents and characterized by two distinct seasons:
1) a dry season (October to June), during which the country is subject to the influence of two main atmospheric currents (the trade winds and the harmattan).
2) a wet season lasting three to four months (from June/July to September) under the influence of monsoons, during which rainfall is recorded throughout the area.
The area advanced position in the Atlantic Ocean gives it a distinct microclimate that is both Saharan and oceanic . Climate data obtained by the National Meteorological and Civil Aviation Agency at the Fatick and Mbour stations show that average monthly rainfall varies between 13.63 and 243 mm from June to August. August and September are the rainiest months. The average potential evaporation is 2,200 mm/year in Fatick, and the average minimum and maximum temperatures range from 25.3°C to 30.43°C. Relative humidity ranges from 60 to 95% and is high from July to October .
2.1.2. Geology and Hydrogeology
The geological context shows that the Samba Dia area is located in the western part of the Senegal-Mauritania sedimentary basin. Its bedrock has never been exposed and is buried under a cover exceeding 8,000 m in thickness, dating from the Oxfordian to the present . The stratigraphy of the study area consists mainly of sedimentary formations from the Maastrichtian, Paleocene, Eocene, and Quaternary periods. The Maastrichtian consists of clays and sands. The carbonate formations correspond to Paleocene and Eocene limestones containing marl and clay . Geological sections AB and CD characterize the Miocene and Pliocene-Quaternary surface formations of the Samba Dia lens (Figure 2). The Djilass-Ndangane axis shows Ogolian dune sands on the surface with an intrusion of very clayey Nouakchottian sands (tannes) to the northeast. This Pliocene-Quaternary formation rests on the Miocene formation located less than 10 m deep, with a lithology consisting of highly clayey Miocene marine sands and lateritic clayey sands belonging to the Pliocene-Quaternary. These lateritic clayey sands gradually disappear towards the southwest, giving way to highly clayey sands (tannes) from the marine Miocene, whose substrate is located more than 30 m below the surface (Figure 2). On the Mbissel, Samba Diallo, and Fimela axis, the Pliocene-Quaternary formation is charac-terized by Ogolian dune sands resting on highly clayey Miocene marine sands. The Miocene substratum is 20 m deep in the east and gradually decreases towards the west Overall, the surface formations in the Samba Dia area consist mainly of fine to, medium-grained quartz sands, with a smaller proportion of clays and various coarse elements: ferruginous gravel, shells, pebbles, etc. The lower levels are more clayey (presence of sandy clay, probably marine Miocene, at the base of the series). The layer of lateritic clayey sands that forms the base of the Pliocene-Quaternary complex throughout the Mbour region gradually disappears south of the Fadial-Kobongoye I-Diofior axis .
From a hydrogeological standpoint, analysis of shallow aquifers in the Mbour region reveals that the thickness of Miocene and Pliocene-Quaternary formations is greatest in the Samba Dia lens. Its thickness averages between 20 m and 30 m, with a maximum of 40 m at Ndangane. This aquifer consists mainly of quartz sands, with occasional passages of marl and marl-limestone at the base . The aquifer consists of fresh water in its central part to depths of nearly 20 m in certain locations such as Samba Dia, Samba Diallo, Baboucar, etc. This Quaternary sand aquifer remains the only aquifer among the four that is exploited for various uses. The other aquifers from the Eocene, Paleocene, and Maastrichtian peri-ods on which this Quaternary sand formation rests are of no hydrogeological interest due to the brackish, salty to hypersalty nature of the water they contain . The aquifer is fed by precipitation and is therefore subject to seasonal and inter-annual fluctuations in rainfall. The drought that has prevailed in recent years and excessive water withdrawals are significantly affecting groundwater reserves, which continue to decline. The piezometry is characterized by two large depressions in the southeast at Ndangane and Djilor and in the west around Kobongoye, separated by a watershed running through the center of the area along an axis from Djilass to Diofior to Keur Moussa Diarra to Samba Diallo to Baboucar. The aquifer is recharged by its piezometric dome located in the center of the area, causing divergent flow towards the peripheral areas .
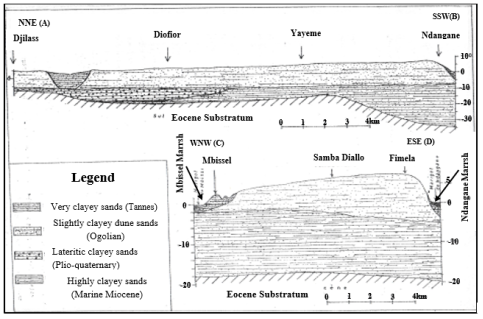
Figure 2. Cross section of geological formations in the study area.
2.2. Data Acquisition, Analysis and Processing
Groundwater samples were collected from a network of 33 wells. The first sampling campaign was carried out in March 2021 (before the rainy season), during which measurements of physicochemical parameters and groundwater levels were taken in situ. The second sampling campaign was conducted in January 2024, three years later, to assess changes in water quality. Samples were collected in 250 mL polypropylene bottles and stored under optimal conditions before being sent to the hydrochemistry laboratory of the UCAD geology department for analysis. Electrical conductivity (EC), temperature (T°), and pH were measured using a WTW 350i portable multiparameter device. Water depth in the structures was measured using a graduated electrical sound probe. The exchange processes were carried out using AS14 A-AERS columns 500 for anions (F-, Cl-, NO3-, SO42-) and CS12A-CERS 500 for cations (Na+, K+, Mg2+, Ca2+). Iron was determined using a THERMO Ice 3000 SAA; carbonate species were analyzed by titrimetry using a 0.05N sulfuric acid solution. The results of the water chemistry analyses were processed using statistical methods and several hydrogeochemical hydrogeochemical approaches, including the Piper diagram for determining chemical facies, ionic ratios the Stuyfzand method for classifying water types, and the HFE-D diagram for assessing the evolution of hydrochemical facies based on mixing and basic ion exchange phenomena. An analysis of the suitability of groundwater for consumption is also carried out in accordance with WHO standards (2004 and 2011) and on its suitability for irrigation using highly effective approaches such as the Wilcox and Richards USSL diagrams with the help of Simler Diagram software.
3. Results and Discussions
3.1. Physicochemical Parameters and Major Ions
The study of the variation of several major ions (Figure 3) makes it possible to track the evolution of mineralization in groundwater between 2021 and 2024. The average conductivity and chloride values are relatively low (from 1,929 to 1,782.61 µS/cm and from 515.07 to 461.57 mg/L) (Figure 3). Some compartments of the aquifer have been diluted by recharge, as the 2024 sampling was carried out after the rainy season. This decrease in chloride content and conductivity does not necessarily reflect a continuous decline in water salinity, but rather a temporary change linked to the influence of precipitation. The study of the temporal variation in conductivity and chloride values by sector provides more precise information on groundwater mineralization at the local level. The northwestern zone is characterized by an exponential increase in conductivity and chloride content values (Figure 4), while in the southastern and central sectors, water mineralization is relatively stable between the two periods, with a slight increase in some areas. Analysis of the overall behavior of chemical components shows an enrichment of groundwater in calcium (83.36 to 94.09 mg/L) and magnesium (27.48 to 40.21 mg/L), followed by a decrease in sodium (271.85 to 231.99 mg/L) and potassium (17.66 to 14.46 mg/L). This variation reflects a slight change in seawater intrusion despite the impact of recharge during the rainy season with an influx of HCO3 bicarbonate (94.06 to 140.11 mg/L). In short, the decrease in chloride content and electrical conductivity and the increase in bicarbonate in certain compartments of the aquifer is linked to the temporary dilution of the aquifer by rainwater. However, the high mineralization on the coast (Figure 4), the enrichment of the water with Ca2+ and Mg2+ and the depletion of Na+ and K+ indicate, overall, an advance in saline water intrusion. Analysis of the spatiotemporal evolution of conductivity values and chloride content (Figure 4) shows that locations in peripheral areas are characterized by increasingly mineralized water. The dome zone in the center, marked by a high piezometric level and less mineralized water in 2021, is piezometric level and less mineralized water in 2021, is affected by progressive salinization (Figure 4). The advance of saltwater intrusion, which may be linked to several factors, characterizes this salinization process. Saltwater intrusion is advancing toward the freshwater of the shallow aquifer. This advance of saltwater is more worrying in the center of the zone, which is a catchment area for wells because of the freshwater it contains. The hydrogeochemical approaches that will be used downstream will provide more details on the origin and nature of saltwater intrusions into the freshwater lens. In view of this development, the Quaternary aquifer is at risk of being completely overtaken by saltwater intrusion within a few years if protective measures are not taken.
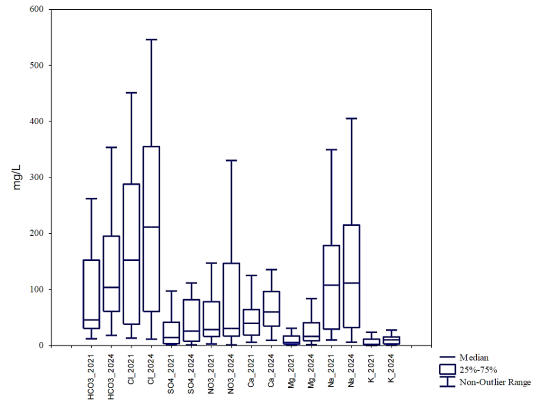
Figure 3. Evolution of concentration major ions between 2021 and 2024.
3.2. Classification of Hydrochemical Facies
The Piper diagram can be used to categorize the chemical facies of water and study the spatial and temporal evolution of the chemistry of water or an aquifer. It takes into account the proportions of the different ionic species analyzed to characterize the geochemical facies of water . The representation of the concentrations of major elements in the aquifer in the study area on the Piper Diagram shows a predominantly chloride facies (Figure 5). There are three main poles with significant variations in proportions between 2021 and 2024:
1) a sodium chloride (Na-Cl) facies, which decreased from 69.7% of samples to 45.45%;
2) a calcium chloride (Ca-Cl) facies, which increased from 18.18% to 36.36% of samples;
3) calcium bicarbonate (Ca-HCO3) facies, which varies from 12.12% to 24.24% of structures.
An examination of the results from the Piper diagram between 2021 and 2024 (Figure 5) reveals an exchange of cations between sodium ions and calcium ions. An analysis of the evolution of the percentages of facies between the two periods shows an enrichment of groundwater in calcium bicarbonate CaHCO3- and calcium chloride CaCl, followed by a decrease in sodium chloride NaCl content. The enrichment of CaCl facies in the Quaternary aquifer is linked to a reverse ion exchange process in which the aqueous solution is enriched in Ca2+ and depleted in Na+. This mechanism most commonly occurs when clays are in contact with brackish water . The extension of calcium bicarbonate facies between the two periods was probably due to the diffusion of atmospheric CO2 attribuable to the shallow depth of the aquifer in coastal areas, or by the dissolution of Eocene calcite, which forms the substrate of the Quaternary aquifer. The persistence of low-mineralization NaCl facies in several structures (45.45%) inland could be explained by a base Exchange process in which structures (45.45%) inland could be explained by a base Exchange process in which Na remains fixed to the surface of clay minerals. This trend, which shows an overall increase in calcium levels in the water with a predominantly chloride facies, reflects the gradual salinization of the aquifer following the leaching of salty soils in the tanneries and the intrusion of seawater through upwelling, which dilutes the fresh water in the aquifer. It is more pronounced in the areas bordering the low piezometric zone, although it must be acknowledged that this saltwater intrusion will have advanced into the central part of the zone by 2024.
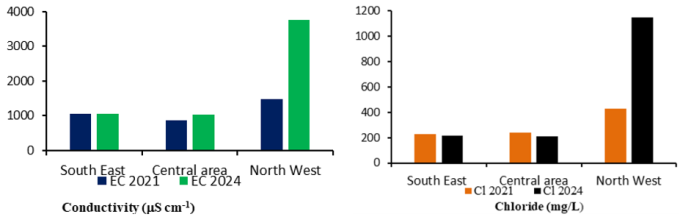
Figure 4. Temporal variations of electrical conductivity and chloride level.
Table 1. Subdivision of zones in the temporal evolution diagram.

Areas

Wells

South-East

P1, P2, P7, P9, P10, P11, P12, P13, P14, P21, P22, P25, P30

Center

P3, P4, P5, P6, P15, P16, P17, P18A, P18B, P19, P20, P23

North-West

P24A, P24B, P26, P27, P28, P29, P31

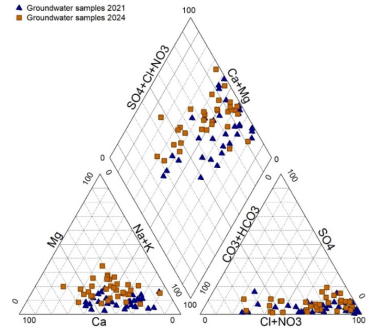
Figure 5. Piper diagram (2021 and 2024).
3.3. Stuyfzand Classification: Determination of Water Types Based on Chloride Content
The Stuyfzand method is particularly well suited to studying the phenomenon of salinization or the reverse process, softening. The relevance of this classification lies in its ability to recognize whether a cation exchange has occurred in the water and what type of exchange it is . It refers to several indices for classifying water types, including chloride content, which we will use in this study. This method is well suited to the study of coastal aquifers. The determination of the chloride content (in mg/L) represents the first symbol of the water type code. It allows several water classes to be identified (Table 2) and the salinization process to be assessed accordingly.
Table 2. Types of water in the Quaternary aquifer of Samba Dia in 2021 and 2024 according to Cl content.

Water Class

code

Cl (mg/L)

Number of samples

% of samples

Locations

March 2021

Fresh water

F

≤150

15

45.45

Center, west center, West coast, East coast

Fresh–brackish water

Fb

150 -300

10

33.33

Brackish water

B

300-1000

4

12.12

Coast

Brackish–saline water

Bs

1000-10000

4

12.12

January 2024

Fresh water

F

≤150

14

42.42

Center, west center, East coast

Fresh–brackish water

Fb

150 -300

09

27.27

Brackish water

B

300-1000

5

15.15

Coast, west center

Brackish–saline water

Bs

1000-10000

5

15.15

Stuyfzand's classification of the waters of the Samba Dia Quaternary aquifer according to chloride content shows the existence of four water classes (Table 2). Analysis of the results shows mainly fresh to brackish waters in the localities located in the center of the area and brackish or saline waters on the coast. The evolution of water types in the area between 2021 and 2024 shows a slight fluctuation in water salinity levels.
The proportion of freshwater types decreases from 78.8% to 69.7%. Stuyfzand's classification of the waters of the Samba Dia Quaternary aquifer according to chloride content shows the existence of four water classes (Table 2).
These results indicate a process of gradual salinization of the aquifer, manifested by a generalized increase in chloride content. This phenomenon could be explained by difficulties in replenishing the aquifer due to lower rainfall, leading to a depletion of bicarbonate ions (HCO3) in the water, an upwelling of salt water resulting from uncontrolled pumping, or leaching of salty soils in "tanne" pits followed by the infiltration of salt water from the surface.
3.4. Water Mineralization Process: Ion Ratios
The origin of dissolved ions can be assessed by tracing samples. Gibbs recommended a simple plot of TDS as a function of the weight ratio Na+/(Na++Ca2+) and Cl-/Cl- +HCO3- in order to differentiate the influences of rock-water interaction, evaporation, and precipitation on water chemistry.
The Gibbs diagram characterizes the water mineralization process represented in three phases: evaporation (1), water-rock contact (2), and precipitation (3) (Figure 5).
Analysis of the mineralization mechanism of the waters of the Samba Dia lens shows that the majority of samples are in the water-rock interaction domain (Figure 6), which is either synonymous with the dissolution of carbonates and evaporites or related to the alteration of silicates. It is also important to note the gradual increase in evaporation in 2024, which affects more than 15% of samples, unlike in 2021, when almost all of the water was subject to water-rock contact. Overall, the Gibbs diagrams show that groundwater mineralization is still dominated by water/rock interaction, but with a trend towards an increasingly significant evaporation phase. High evaporation leads to an increase in TDS in water . It is linked to chemical alteration or anthropogenic activity. This explains why certain samples have moved from the water/rock domain to the evaporation zone (Figure 6). Analysis of the bivariate. The representation of the HCO3/Na ion ratio as a function of mixture graphs (Figure 7) provides a more accurate assessment of the nature of the water-rock interaction highlighted by the Gibbs diagrams. Ca/Na indicates water-rock contact that leads to a process of dissolution through silicate alteration for most groundwater samples (Figure 7A).
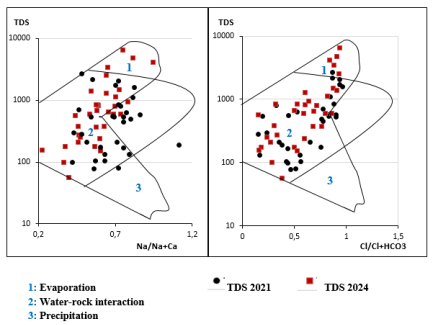
Figure 6. Gibbs phase diagrams.
Analysis of the bivariate mixture graphs (Figure 7) provides a more accurate assessment of the nature of the water-rock interaction highlighted by the Gibbs diagrams. The representation of the HCO3/Na ion ratio as a function of Ca/Na indicates water-rock contact that conducts to a process of dissolution through silicate alteration for most groundwater samples. (Figure 7A). This leads to the decomposition of silicate minerals, giving rise to new minerals or sedimentary particles. The variation in the Mg/Na ratio as a function of Ca/Na provides additional information complementary to the HC03/Na vs. Ca/Na graph on the nature of the water-rock contact. It shows several aquifer wells under the effect of evaporite dissolution (Figure 7B). This process occurs when minerals or rock fragments resulting from salt precipitation dissolve in the presence of water. The alteration of silicates and the dissolution of evaporites can be explained by several factors: the rise in temperatures observed in the area, the presence of dissolved substances such as acids, bases, salts, and organic matter in the water, the presence of minerals sensitive to alteration and dissolution such as feldspars, and also the residence time of the water to activate chemical reactions. The mineralization of groundwater in the area is therefore mainly controlled by the alteration of silicates and the dissolution of evaporites, although it should be noted that a small proportion of wells are subject to evaporation.
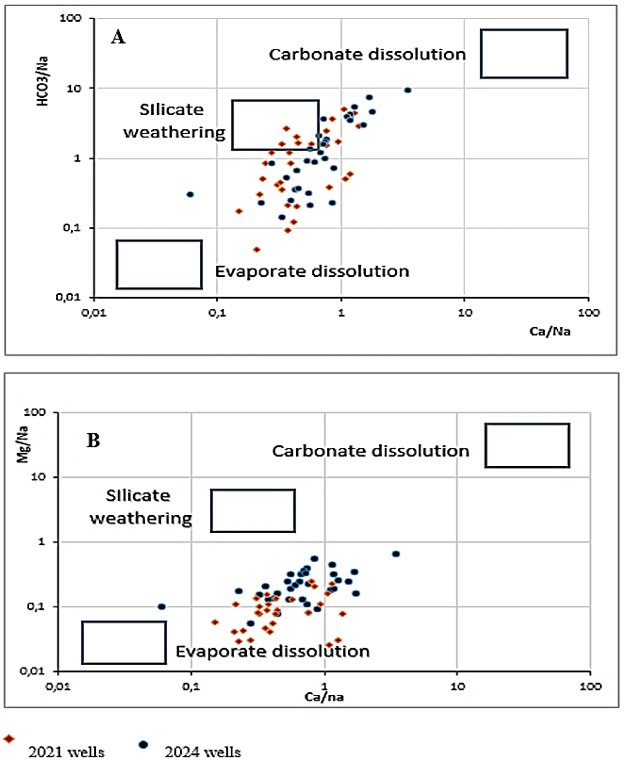
Figure 7. Bivariate mixing plots; A) Na normalisez Ca and HCO3, B) Na normalisez Ca and Mg.
3.5. Evolution of Chemical Facies: HFE Diagram
The hydrochemical facies evolution diagram (HFE diagram) (Figure 8) was designed to help interpret the hydrochemistry of the intrusion and recovery phases of marine intrusion into coastal aquifers . The advantage of using this diagram is that it allows for the precise identification of chemical facies, the determination of intrusion and softening processes, the evolution of hydrochemical facies, mixing phenomena, and basic ion exchange processes, among other things . Analysis of water chemistry using the HFE diagram makes it possible to identify a refreshment phase and an intrusion phase separated by a conservative mixing line (Figure 8). The Gimenéz diagrams for 2021 and 2024 show a more or less significant increase in seawater intrusion, from 36.36% to 66.67%. This saltwater intrusion mainly affects structures located on the coast with a low piezometric level and a large number of locations in the center, which are increasingly affected by the rise in saltwater levels due to excessive pumping. The hydrochemical facies have undergone some changes over time; NaCl has decreased from 72.72% to 66.66%, CaCl has decreased from 12.12% to 3.03%, CaHCO3 from 9.09% to 24.24%, NaHCO3 from 6.07% to 3.03% and the formation of a new MgCl facies represented at 3.03%. These changes in the aquifer waters show an overall decrease in sodium ions and an increase in calcium and magnesium. This confirms the high proportions of seawater intrusion reached in 2024. Apart from the phenomena of intrusion, refreshment, and identification of hydrochemical facies, the diagram of the evolution of the hydrochemical facies of Gimmenéz highlights two major phenomena. A phenomenon of freshwater-saltwater mixing governed by the y-axis, which depends exclusively on the recharge supply with HCO3 enrichment, as seawater is considered stable, and a basic ion exchange process represented by the x-axis, where substitution between cations is observed. Examination of the diagram (Figures 8 and 9) shows, on the one hand, a phenomenon of freshwater-saltwater mixing between the aquifer and the external environment. This is characterized by a decrease in recharge through bicarbonate depletion and an increase in water salinity due to seawater intrusion. On the other hand, it reveals a process of inverse ion exchange with Ca2+ and Mg2+ ions replacing Na+ ions in the groundwater, which also leads to the advance of intrusion (Figures 8 and 9). Consequently, the increase in water salinity following saltwater intrusion is attributable both to the decline in recharge and to the reverse ion exchange process, which enriches the water with calcium bicarbonate and magnesium.
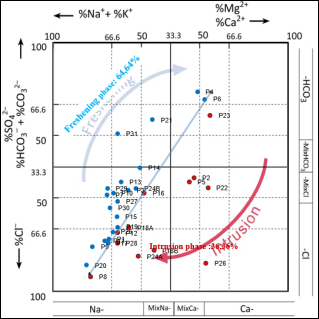
Figure 8. HFE-Diagram: March 2021.
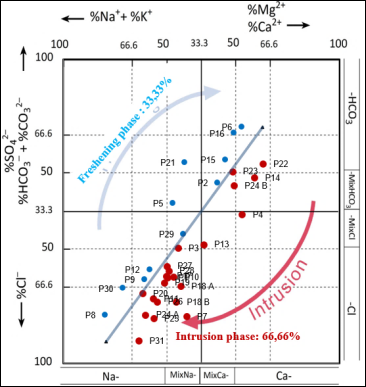
Figure 9. HFE-Diagram: January 2024.
3.6. Suitability for Drinking and Irrigation
3.6.1. Suitability for Drinking
The suitability of groundwater for consumption is studied according to several chemical parameters (Table 3) based on WHO standards . The phenomenon of saltwater intrusion into the Quaternary aquifer, as expressed by the chemical approaches used upstream, such as the Piper diagram, the Stuyfzand classification, and the Giménéz hydrochemical facies evolution diagram, does not yet have a significant impact on the suitability of water for drinking according to the indicators used (Table 3).
Table 3. Suitability of groundwater for drinking.

Variables

Units

Minimum

Maximum

Average

WHO Standard

Suitability (%)

March 2021

pH

5,9

10,7

8,3

6,5-8,5

75

CE 25°C

uS/cm-1

107,00

25200,00

12653,5

1500

75

Ca

mg/L

5,76

467,71

236,735

75

75,76

Mg

mg/L

0,83

494,96

247,895

50

90,91

Na

mg/L

9,85

4472

2240,92

200

75,75

K

mg/L

0.30

209,7

105

12

75,76

Cl

mg/L

13,26

8184,25

4098,755

250

69,69

SO4

mg/L

0,95

557

278,975

250

96,96

NO3

mg/L

2,86

883,8

443,33

50

57,58

January 2024

pH

5,1

7,63

6,365

6,5-8,5

80

CE 25°C

uS/cm-1

89

10200

5144,5

1500

80

Ca

mg/L

9,46

553,12

281,29

75

77

Mg

mg/L

5,14

256,26

130,7

50

95

Na

mg/L

6,24

1664,12

835,18

200

77

K

mg/L

O,81

62,2

62,2

12

77

Cl

mg/L

11,35

2411,49

1211,42

250

71

SO4

mg/L

1,15

547,71

274,43

250

98

NO3

mg/L

1,27

738,43

369,85

50

60

The results show that the majority of water samples taken in 2024, i.e., 77 to 98% (Table 4), are still suitable for drinking. These are mainly well located in the center of the area where the recharge volume is still significant and a few structures on the east and west coasts such as Kobongoye, Fadial, Djilor, etc. Although these wells are located on the coast, they are not yet affected by seawater. However, it is necessary to find ways to protect the resource in areas where the water is still suitable for drinking, as the salinity level of the aquifer continues to rise.
3.6.2. Suitability for Irrigation
To analyze the suitability of water from the Samba Dia Quaternary aquifer for irrigation, we chose two effective indicators commonly used to assess the use of groundwater for agricultural irrigation needs. These are the Wilcox diagram and Richards' USSL diagram (Figures 10 and 11).
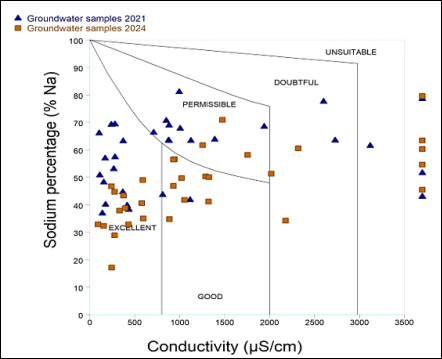
Figure 10. Wilcox diagram 2021 and 2024.
These diagrams are based on sodium adsorption ratio, which is a good indicator of irrigation water quality. The process of sodium exchange in water for Ca²⁺ and Mg²⁺ in soils reduces permeability and ultimately results in soil with poor internal drainage. In addition, using a high percentage of sodium-rich water for irrigation can delay plant growth and reduce soil permeability . The Wilcox diagram is subdivided into four classes, each indicating a specific type of water. It is based on the percentage of sodium and electrical conductivity. The USSL diagram or salinity diagram , is a representation of the sodium adsorption ratio (SAR) as a function of electrical conductivity (EC). The diagram is subdivided into four classes from C1 to C4 (Figure 10), with classes C1, C2, and C3 characterizing groundwater with good irrigation suitability . The Wilcox and USSL diagrams (Figure 11) indicate that the aquifer's water is well suited for irrigation. A very slight decrease in the suitability rate for irrigation is noted in 2024, but the proportion of structures that are still suitable for agricultural use exceeds 84%, of which more than 66.5% are in the excellent and good classes. Therefore, these analyses do not yet show any cause for concern regarding the suitability of the water for irrigation, but given the evolution of salt intrusion, these resources deserve to be protected in order to guarantee the long-term suitability of the water for irrigation.
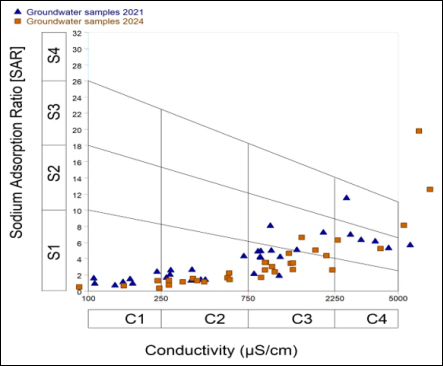
Figure 11. USSL diagram.
4. Conclusions
Analysis of the chemistry of the groundwater in the Samba Dia lens reveals changes in water quality related to several factors. The study of variations in physicochemical, and chemical parameters indicates an overall increase in the salinity of the groundwater, manifested by a gradual increase in conductivity and chloride values in the center of the area and along the coast. This process of groundwater salinization is corroborated by Stuyfzand's classification, which shows an increase in the proportion of saltwater to brackish water types from 24.5% to over 30%. The mineralization of groundwater is controlled by the alteration of silicates and the dissolution of evaporites. Piper's diagram and Giminéz's hydrochemical facies evolution diagram highlights a significant increase in seawater intrusion. This is manifested by the enrichment of calcium and a decrease in the sodium content of the groundwater. Thus, the NaCl facies decreases from 70% to 45.45%, while the calcium bicarbonate CaHCO3 content in the water doubles between 2021 and 2024 according to the Piper diagram. The HFE-D gives similar results and provides more details on the evolution of the facies. Seawater intrusion increased by +30.30% between 2021 and 2024, and hydrochemical facies underwent changes with a decrease in NaCl from 72.72% to nearly 66.7%. The CaHCO3 rate increased significantly, varying from 9.09% to 24.5%, and a new MgCl facies appeared, representing 3.03% of the samples. The suitability of the water for consumption and irrigation has not changed significantly, as the majority of structures are still suitable for various uses despite the advance of intrusion, although it should be noted that the usability of the water for irrigation has declined slightly. Overall, this study indicates a generalized increase in seawater intrusion into the aquifer and a gradual decline in the water table between 2021 and 2024. This change can be attributed to a combination of several factors: a decrease in rainfall, excessive pumping, the rise of salt water towards the aquifer, the leaching of salt from the soil surface followed by infiltration. To this we must add a reverse ion exchange process during which Na+ and K+ ions are replaced by Ca2+ and Mg2+ ions, and a decrease in recharge, which leads to an increase in chloride and a decrease in bicarbonate in the water. For rational resource management, we plan to further this work by establishing a hydrogeological model of the aquifer and conducting a vulnerability study to identify the solutions needed to combat intrusion and depletion of reserves. Pending more sustainable solutions in this regard, we recommend replenishing the aquifer by creating forced recharge through runoff diversion.
Abbreviations

USSL

United States Salinity Laboratory

% Na

Sodium Percent

SAR

Sodium Adsorption Ratio

HFE-D

Hydrochemical Facies Evolution Diagram

Acknowledgments
The authors gratefully acknowledge the assistance for the chemical analyses by the staff of Hydrochemical laboratory of the Cheikh Anta Diop University of Dakar (Senegal). We are grateful to the anonymous reviewers for their insightful remarks and recommendations.
Author Contributions
Amadou Sarr: Conceptualization, Data curation, Investigation, Methodology, Writing – original draft
Seyni Ndoye: Conceptualization, Data curation, Formal Analysis, Investigation, Methodology, Resources, Supervision, Validation, Visualization, Writing – review & editing
Jean Andre Ndiaye: Data curation, Investigation, Writing – original draft
Serigne Faye: Formal Analysis, Supervision, Validation, Visualization
Philippe Le Coustumer: Resources, Supervision, Validation
Arnaud Gauthier: Resources, Supervision, Validation, Writing – review & editing
Data Availability Statement
Data will be made available on request.
Conflicts of Interest
The authors declare no conflicts of interest.
References
[1] Diédhiou, M., Cissé Faye, S., Diouf, O. C., Faye, S and Wohnlich, S. (2014) Groundwater Quality Assessment in a Coastal Sand Aquifer: Implications for Drinking Water and Agricultural Use. Research Journal of Environmental and Earth Sciences 8(5): 585-594, 2014.
[2] Ndoye, S., Fontaine, C., Gaye, C. B. and Razack, M. (2018) Groundwater Quality and Suitability for Different Uses in the Saloum Area of Senegal» Water 10, no. 12: 1837.
[3] Faye, S., Faye, C. S, Ndoye, S., A. Faye, A. (2003) Hydrogeochemistry of the Saloum (Senegal) superficial coastal aquifer. Environ. Geol. 44, 127 136.
[4] Re, V., Faye, S. C., Faye, S., Gaye, C. B., Sacchi, E., Gian, M. Z. (2011) Water quality decline in coastal aquifers under anthropic pressure: the case of a suburban area of Dakar (Senegal). Environ Monit. Assess, 172: 605-622
[5] Sarr, A. (2024) Characterisation of the Quaternary aquifer at Samba Dia (Senegal) using hydrogeochemical, isotopic and geophysical methods. PhD thesis in hydrogeology, Cheikh Anta Diop University, Dakar, 200 pages + appendices.
[6] Sarr, A., Ndoye, S. and Faye, S. (2022) Caractérisation hydrogéochimique de l’aquifère de Samba Dia (Centre-Ouest du Sénégal). International Journal of Innovation and Applied Studies ISSN 2028-9324 Vol. 38 No. 1 Nov. 2022, pp. 71-85.
[7] Marius, C. (1975) Evolution des sols dans deux chrono-séquences de l’estuaire du Saloum (Sénégal). Rapport ORSTOM Dakar.
[8] Sarr R. (1982) Etude géologique et hydrogéologique de la région de Joal-Fadiouth (Sénégal). Thèse 3ème cycle, Univ. Dakar, 166 p.
[9] Leroux, M. (1995) The dynamics of the major Sahelian drought / Dynamics of the Great Sahelian Drought. In: Revue de géographie de Lyon, vol. 70, n°3-4, Sahel, la grande sècheresse. pp. 223-232.
[10] Gaye, A. T., Sylla, M. B. (2008) Scenarios climatiques au Sénégal. Rapport, Laboratoire de Physique de l’atmosphère et de l’océan S F (LPAO SF), Ecole Supérieure Polytechnique Université Cheikh Anta Diop, Dakar, Sénégal.
[11] Travi Y. (1984) Origine des fortes teneurs en fluor des eaux souterraines de la nappe paléocène de la région de Mbour (Sénégal): le rôle de l’ion magnésium. G. R. Acad. Sei. Paris, 298, I, p. 313-316.
[12] ANSD (Agence Nationale de la Statistique et de la Démographie), (2015) Situation Economique et Sociale régionale 2012 -Hydraulique de Fatick. Rapport du Service Régional de la Statistique et de la Démographie de Fatick. Ministère de l’Economie, des Finances du Plan du Sénégal., 62 pages.
[13] Tine, A. K., BA, M. I., Gladima, A. S., Essouli, O. F., FAYE, A., Sarr, B. (2011) Réactualisation de la situation Hydrogéologique des aquifères du Maastrichtien et du Paléocène de la Région de Mbour, Sénégal. Journal des Sciences et Technologies, Vol. 9 n° 2 pp. 23-32.
[14] Bellion, Y. et Guiraud, R. (1984). The Senegalese sedimentary basin: a summary of current knowledge. BRGM et DMG, vol 1, 4-63 pp.
[15] Pitaud. (1980) Etude hydrogéologique des calcaires paléocènes de Mbour. Assessment of water resources and development potential. Directorate of Hydraulic Studies, Ministry of Public Works. Summary report 01-80-HG-DEH, Dakar. 126 p.
[16] Depagne, J. and Moussu, H. (1967), Notice explicative de la carte hydrogéologique du Sénégal au 1/500 000 et de la carte hydrochimique au 1/1 000 000. Doc. BRGM, Dakar, 35 p.
[17] Simler, R., DIAGRAMMES. (2009) Avignon Hydrogeology Laboratory, Avignon France.
[18] Piper, A. M. (1944) A Graphical Procedure in the Geochemical Interpretation of Water Analysis. Transactions, American Geophysical Union, 25, 914-928.
[19] Diaw, M. (2019) Study of the hydrological and hydrogeochemical behaviour of surface waters and shallow aquifers in the delta and lower valley of the Senegal River: Contributions from geochemical and isotopic tools, statistical analyses and GIS. Single-subject PhD thesis in hydrogeology. Faculty of Science and Technology, Cheikh Anta Diop University of Dakar, 282 p + annexes.
[20] Howard, K. W. F. and Lloyd, J. W. (1983) Major Ion Characterization of Coastal Saline ground waters. Groundwater, Vol 21, N°4
[21] Boughriba, M., Melloul, A., Zarhloule, Y. and Ouardi, A. (2006) Spatial extent of water resource salinisation and a conceptual model of saline sources in the Triffa Plain (Eastern Morocco). Geoscience Reports, 338, 768-774.
[22] Gibbs, R. (1970) Mechanism Controlling World River Water Chemistry. Science, 170, 1088 1090.
[23] Gibbs, R. (1971) Mechanism Controlling World River Water Chemistry: Evaporation Crystallization Process. Science, 172, 871-872.
[24] Subba Rao, N. (1998) Groundwater Quality in Crystalline Terrain of Guntur District, Andhra Pradesh, Visakhapatnam. Journal of Science, 2, 51-54.
[25] Giménez-Forcada, E. (2010), Dynamic of Sea Water Interface using Hydrochemical Facies Evolution Diagram. Groundwater, 48: 212-216.
[26] Giménez-Forcada, E. Space/time development of seawater intrusion: A study case in Vinaroz coastal plain (Eastern Spain) using HFE-Diagram, and spatial distribution of hydrochemical facies, Journal of Hydrology, Volume 517, 2014, Pages 617-627,
[27] Giménez-Forcada E, Sánchez San Román FJ. An Excel Macro to Plot the HFE-Diagram to Identify Sea Water Intrusion Phases. Ground Water. 2015 Sep-Oct; 53(5): 819-24.
[28] Giménez-Forcada E, Vega-Alegre M, Timón-Sánchez S. Characterization of regional cold-hydrothermal inflows enriched in arsenic and associated trace-elements in the southern part of the Duero Basin (Spain), by multivariate statistical analysis. Sci Total Environ. 2017 Sep 1; 593-594: 211-226.
[29] Giménez-Forcada, E. Use of the Hydrochemical Facies Diagram (HFE-D) for the evaluation of salinization by seawater intrusion in the coastal Oropesa Plain: Comparative analysis with the coastal Vinaroz Plain, Spain, Hydro Research, Volume 2, 2019, Pages 76-84,
[30] WHO (2004) Guidelines for Drinking Water Quality. 3rd Edition, WHO, Geneva.
[31] WHO (2011) Guidelines for Drinking-Water Quality. 4th Edition, WHO, Geneva.
[32] Joshi, D. M., Kumar, A and Agrawal, N. (2009) Assessment of the Irrigation Water Quality of River Ganga in Haridwar District India. Journal of Chemistry, 2, 285-292.
[33] Wilcox, L. V. (1955) Classification and Use of Irrigation Water. U.S Department of Agriculture, Washington DC, 969.
[34] Richards, L. A. (1954) Diagnosis and Improvement of Saline and Alkali Soils. U.S. Department of Agriculture Handbook 60. U.S. Government Printing Office, Washington DC.
[35] Sarr, A., Ndoye, S., Djanni, A. L. T. and Faye, S. (2023) Assess ment of Groundwater Quality for Drinking and Irrigation Uses in the Samba Dia Area, Central West Senegal. Journal of Water Re source and Protection, 15, 130-148.
[36] Kaur, R. and Singh, R. V. (2011) Assessment for Different Groundwater Quality Pa rameters for Irrigation Purposes in Bikaner City, Rajasthan. Journal of Applied Sciences in Environmental Sanitation, 6, 385-392.
[37] Jalali, M. (2011) Hydrogeochemistry of Groundwater and Its Suitability for Drink ing and Agriculture Use in Nahavand, Western Iran. Natural Resources Research, 20, 65-73.
Cite This Article
  • APA Style

    Sarr, A., Ndoye, S., Ndiaye, J. A., Faye, S., Coustumer, P. L., et al. (2026). Analysis of Water Chemical Quality Evolution in the Quaternary Aquifer of the Samba Dia Area (Central-western Senegal). American Journal of Water Science and Engineering, 12(2), 64-77. https://doi.org/10.11648/j.ajwse.20261202.13

    Copy | Download

    ACS Style

    Sarr, A.; Ndoye, S.; Ndiaye, J. A.; Faye, S.; Coustumer, P. L., et al. Analysis of Water Chemical Quality Evolution in the Quaternary Aquifer of the Samba Dia Area (Central-western Senegal). Am. J. Water Sci. Eng. 2026, 12(2), 64-77. doi: 10.11648/j.ajwse.20261202.13

    Copy | Download

    AMA Style

    Sarr A, Ndoye S, Ndiaye JA, Faye S, Coustumer PL, et al. Analysis of Water Chemical Quality Evolution in the Quaternary Aquifer of the Samba Dia Area (Central-western Senegal). Am J Water Sci Eng. 2026;12(2):64-77. doi: 10.11648/j.ajwse.20261202.13

    Copy | Download

  • @article{10.11648/j.ajwse.20261202.13,
      author = {Amadou Sarr and Seyni Ndoye and Jean Andre Ndiaye and Serigne Faye and Philippe Le Coustumer and Arnaud Gauthier},
      title = {Analysis of Water Chemical Quality Evolution in the Quaternary Aquifer of the Samba Dia Area (Central-western Senegal)},
      journal = {American Journal of Water Science and Engineering},
      volume = {12},
      number = {2},
      pages = {64-77},
      doi = {10.11648/j.ajwse.20261202.13},
      url = {https://doi.org/10.11648/j.ajwse.20261202.13},
      eprint = {https://article.sciencepublishinggroup.com/pdf/10.11648.j.ajwse.20261202.13},
      abstract = {The Quaternary sand aquifer of the Samba Dia lens is a critically important water reserve for the municipalities of Fimela, Djilass, and Diofior, located near the Atlantic Ocean and hypersaline waters of the Saloum estuary in central-western Senegal. To assess the influence of this environment on groundwater quality, two water sampling campaigns were carried out in March 2021 and January 2024 on 33 wells. The objective of this study is to evaluate the evolution of groundwater chemical quality during this period. Data interpretation was performed using a multidisciplinary approach based on descriptive statistics of physicochemical parameters, identification of chemical facies using Piper's diagram, analysis of the mineralization process, the use of the hydrochemical facies evolution diagram (HFE-D) to measure the impact of recharge and basic ion exchange processes, and Stuyfzand classification to identify water types. A study of the suitability of water for various uses was also conducted to assess the evolution of water suitability between the two periods. The results indicate that this aquifer consists mainly of chloride facies. Four facies were identified in 2021: NaCl (72.72%), CaCl (12.12%), CaHCO3 (9.09%) and NaHCO3 (6.07%) increasing to five in 2024: NaCl (66.66%), CaHCO3 (24.24%), NaHCO3 (3.03%), CaCl (3.03%), MgCl (3.03%) with the emergence of a new magnesian facies. This evolution is marked by a generalized increase in seawater intrusion, which rises from 33.33% in 2021 to 66.66% in 2024. Several wells located in the center of the area, which were characterized in 2021 by a softening process, find themselves under the influence of saline water intrusion after three years. The Stuyzand classification indicates an increase in the representativeness of salt water in the aquifer, varying from 24.24% to 30.30% over three years. However, the suitability of the water for drinking and irrigation is not yet affected by the increase in salinity. This widespread increase in water salinity is the result of saltwater intrusion due to excessive pumping of the Quaternary aquifer, leaching of saline soils from the surface in coastal areas, reduced recharge in the center between the two periods, and a reverse ion exchange process in which Ca2+ and Mg2+ ions replace Na+ ions.},
     year = {2026}
    }
    

    Copy | Download

  • TY  - JOUR
    T1  - Analysis of Water Chemical Quality Evolution in the Quaternary Aquifer of the Samba Dia Area (Central-western Senegal)
    AU  - Amadou Sarr
    AU  - Seyni Ndoye
    AU  - Jean Andre Ndiaye
    AU  - Serigne Faye
    AU  - Philippe Le Coustumer
    AU  - Arnaud Gauthier
    Y1  - 2026/06/23
    PY  - 2026
    N1  - https://doi.org/10.11648/j.ajwse.20261202.13
    DO  - 10.11648/j.ajwse.20261202.13
    T2  - American Journal of Water Science and Engineering
    JF  - American Journal of Water Science and Engineering
    JO  - American Journal of Water Science and Engineering
    SP  - 64
    EP  - 77
    PB  - Science Publishing Group
    SN  - 2575-1875
    UR  - https://doi.org/10.11648/j.ajwse.20261202.13
    AB  - The Quaternary sand aquifer of the Samba Dia lens is a critically important water reserve for the municipalities of Fimela, Djilass, and Diofior, located near the Atlantic Ocean and hypersaline waters of the Saloum estuary in central-western Senegal. To assess the influence of this environment on groundwater quality, two water sampling campaigns were carried out in March 2021 and January 2024 on 33 wells. The objective of this study is to evaluate the evolution of groundwater chemical quality during this period. Data interpretation was performed using a multidisciplinary approach based on descriptive statistics of physicochemical parameters, identification of chemical facies using Piper's diagram, analysis of the mineralization process, the use of the hydrochemical facies evolution diagram (HFE-D) to measure the impact of recharge and basic ion exchange processes, and Stuyfzand classification to identify water types. A study of the suitability of water for various uses was also conducted to assess the evolution of water suitability between the two periods. The results indicate that this aquifer consists mainly of chloride facies. Four facies were identified in 2021: NaCl (72.72%), CaCl (12.12%), CaHCO3 (9.09%) and NaHCO3 (6.07%) increasing to five in 2024: NaCl (66.66%), CaHCO3 (24.24%), NaHCO3 (3.03%), CaCl (3.03%), MgCl (3.03%) with the emergence of a new magnesian facies. This evolution is marked by a generalized increase in seawater intrusion, which rises from 33.33% in 2021 to 66.66% in 2024. Several wells located in the center of the area, which were characterized in 2021 by a softening process, find themselves under the influence of saline water intrusion after three years. The Stuyzand classification indicates an increase in the representativeness of salt water in the aquifer, varying from 24.24% to 30.30% over three years. However, the suitability of the water for drinking and irrigation is not yet affected by the increase in salinity. This widespread increase in water salinity is the result of saltwater intrusion due to excessive pumping of the Quaternary aquifer, leaching of saline soils from the surface in coastal areas, reduced recharge in the center between the two periods, and a reverse ion exchange process in which Ca2+ and Mg2+ ions replace Na+ ions.
    VL  - 12
    IS  - 2
    ER  - 

    Copy | Download

Author Information
  • Abstract
  • Keywords
  • Document Sections

    1. 1. Introduction
    2. 2. Materials and Methods
    3. 3. Results and Discussions
    4. 4. Conclusions
    Show Full Outline
  • Abbreviations
  • Acknowledgments
  • Author Contributions
  • Data Availability Statement
  • Conflicts of Interest
  • References
  • Cite This Article
  • Author Information