The vertical distribution of sediment concentration in estuaries is the core issue of suspended sediment transport. At present, there are many researches on the vertical distribution of sediment concentration in rivers, and a lot of results have been achieved, but that in estuaries is seldom studied. The Yellow River Estuary (YRE) and the Qiantang River Estuary (QRE) are typical tidal estuaries with strong erosion/deposition and high concentration in China. Under the action of alternating tidal flow, the suspended sediment transport shows significant time-varying and non-equilibrium transport characteristics. The vertical distribution of sediment concentration is quite different from that of ordinary rivers. This paper analyzes the vertical distribution of sediment concentration under the action of tidal currents based on the theory of sediment movement and diffusion. Compared with equilibrium sediment transport, the vertical distribution of sediment concentration only differs by one vertical distribution coefficient. Based on the analysis of the measured data, it is found that the vertical distribution of sediment concentration in the YRE and QRE is mostly exponential. Firstly, the multivariate relationship between the vertical distribution coefficient and the sediment saturation and suspension index is established by means of the measured water and sediment data of the QRE. The correlation coefficient R2 was above 0.64, which has a good correlation. Finally, the established relationship was validated using measured water and sediment data from the YRE, and the results were basically consistent, indicating that the established formula for vertical distribution of sediment concentration is suitable for general tidal estuaries, and has a certain reference value for the simulation of sediment transport in the YRE and QRE.
| Published in | Earth Sciences (Volume 13, Issue 4) |
| DOI | 10.11648/j.earth.20241304.13 |
| Page(s) | 141-150 |
| Creative Commons |
This is an Open Access article, distributed under the terms of the Creative Commons Attribution 4.0 International License (http://creativecommons.org/licenses/by/4.0/), which permits unrestricted use, distribution and reproduction in any medium or format, provided the original work is properly cited. |
| Copyright |
Copyright © The Author(s), 2024. Published by Science Publishing Group |
Vertical Distribution of Sediment Concentration, Vertical Distribution Coefficient, Sediment Saturation, Suspended Index, Sediment Carrying Capacity, Yellow River Estuary, Qiantang River Estuary
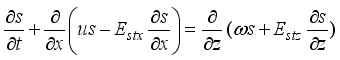 (1)
(1)  ,
,  represent the sediment diffusion coefficients in the flow and vertical directions, respectively; x, z represent the coordinates in the flow and vertical directions, respectively;
  is the sediment settling velocity.
 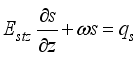 (2)
(2) 
 (3)
(3)  is the source item.
  of the sediment diffusion equation during non-equilibrium sediment transport is not equal to 0, and there are no mature results and data about
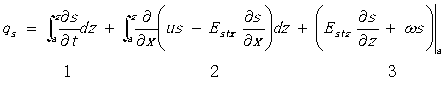
  at present. As a first-order approximation of Eq. (2), item 1 and item 2 reflected in the source item
  can be expressed as a function related to the net exchange item of sediment near the bottom. In this way,
  actually reflects the contribution of net flux of sediment near the bottom to the adjustment of vertical distribution of sediment concentration, and its value is related to suspension index (
  ), saturation degree of sediment transport (
  ), etc. Referring to the method used by Han et al.
 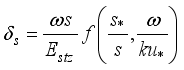 (4)
(4)  is the average vertical sediment concentration;
  is the average vertical sediment carrying capacity;
  is a function;
  is the Karman constant;
  is the friction velocity.
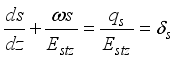
 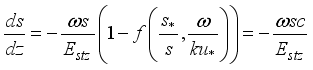 (5)
(5) 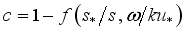 is the correction coefficient for vertical distribution of sediment concentration under non-equilibrium sediment transport (referred to as “distribution coefficient”). When c=1, the sediment transport by water flow is in equilibrium, and the erosion and deposition of the riverbed are balanced; When c<1, the sediment transport by water flow is in a supersaturated state, and the riverbed is deposited; When c>1, the sediment transport by water flow is in an unsaturated state, and the riverbed is eroded.
 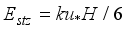 , the vertical distribution index formula of sediment concentration under non-equilibrium sediment transport can be obtained by integrating Eq. (5):
 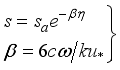 (6)
(6)  is the sediment concentration near the bottom;
  is the relative water depth; H is the water depth.
  was obtained through vertical integration of the formula of sediment concentration.
 item | JB2 | 0509 | JD03 | ZP03 | JD01 | wk01 | wk04 | wk06 | |
|---|---|---|---|---|---|---|---|---|---|
| A* | 8.77 | 15.5 | 3.85 | 2.59 | 2.77 | 2.98 | 2.47 | 0.49 |
B* | 0.41 | 4.80 | 1.42 | 14.7 | 3.75 | 0.55 | 7.27 | 5.44 | |
C* | 0.87 | 9.30 | 2.25 | 0.74 | 3.04 | 1.55 | 1.42 | 4.74 | |
D* | 0.64 | 5.97 | 4.29 | 2.30 | 2.01 | 4.62 | 2.32 | 0.53 | |
β | A | 3.72 | 3.92 | 1.61 | 1.91 | 1.29 | 3.18 | 4.31 | 0.67 |
B | 1.63 | 3.39 | 1.6 | 3.17 | 1.27 | 1.16 | 4.04 | 2.56 | |
C | 0.78 | 1.41 | 0.67 | 2.44 | 1.78 | 1.62 | 2.21 | 2.69 | |
D | 1.57 | 2.08 | 1.92 | 1.45 | 1.62 | 2.5 | 3.04 | 2.21 | |
 ).
).  ), sediment saturation (
  ), the key is to determine the sediment carrying capacity of tidal current, sediment settling velocity and friction velocity of tidal estuaries. The sediment settling velocity was calculated by the formula considering sediment flocculation
 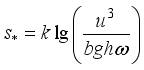 (7)
(7)  ), sediment saturation (
  ), as shown in Eq. (8), and the correlation coefficient R2 was about 0.64. Under the same sediment saturation, the vertical distribution coefficient decreased with the increase of suspension index. Conversely, under the same suspension index, the greater the sediment unsaturation, the greater the vertical distribution coefficient c, and the smaller the vice versa.
 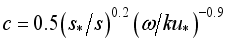 (8)
(8) 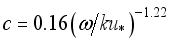 (9)
(9) points | S | Sa | βm | R2 | ω/ku* | c | βc |
|---|---|---|---|---|---|---|---|
A1 | 2.12 | 4.16 | 1.62 | 0.90 | 0.36 | 0.56 | 1.20 |
A1 | 0.83 | 1.21 | 0.81 | 0.99 | 0.39 | 0.50 | 1.18 |
A2 | 0.93 | 1.82 | 1.61 | 0.96 | 0.29 | 0.73 | 1.26 |
A3 | 1.84 | 3.27 | 1.31 | 0.99 | 0.17 | 1.40 | 1.41 |
A3 | 0.79 | 1.67 | 1.79 | 0.97 | 0.15 | 1.62 | 1.45 |
B1 | 4.77 | 9.38 | 1.58 | 0.98 | 0.17 | 1.39 | 1.42 |
B1 | 1.35 | 2.93 | 1.90 | 0.98 | 0.18 | 1.32 | 1.43 |
B2 | 3.55 | 8.40 | 2.16 | 0.98 | 0.10 | 2.63 | 1.58 |
B2 | 1.25 | 2.60 | 1.76 | 0.98 | 0.24 | 0.92 | 1.31 |
B3 | 1.22 | 2.69 | 1.91 | 0.98 | 0.10 | 2.50 | 1.57 |
B3 | 0.35 | 0.53 | 0.90 | 0.91 | 0.29 | 0.72 | 1.26 |
D2 | 1.66 | 2.80 | 1.17 | 0.98 | 0.18 | 1.30 | 1.39 |
D2 | 0.74 | 1.53 | 1.78 | 0.92 | 0.34 | 0.59 | 1.21 |
D3 | 2.99 | 9.39 | 3.59 | 0.84 | 0.28 | 0.74 | 1.26 |
YRE | Yellow River Estuary |
QRE | Qiantang River Estuary |
| [1] | Rouse, H. Experiments on the mechanics of sediments suspension. Proc., 5th International congr. for Applied Mech.. 1938; pp 550-554. |
| [2] | QIAN Ning, WAN Zao-hui. Mechanics of sediment transport. Beijing: Science Press; 1983, pp 311-354. |
| [3] | ZHANG Rui-jin. River sediment dynamics. Beijing: China Water Conservancy and Hydropower Press; 1998, pp 119-123. |
| [4] | NI jin-ren, WANG Guang-qian, ZHANG Hong-wu. Basic theory of solid-liquid two phase flow and its latest applications. Beijing: Science Press; 1991. |
| [5] | HU Chun-hong. Advancement and tendency of sediment research in China, Journal of sediment research. 2014, (2), 1-5. |
| [6] | HAN Qi-wei, CHEN Xu-jian, XUE Xiao-chun. On vertical distribution of sediment concentration in non-equilibrium transport, Advances in water science, 2010, 21(4): 512-523. |
| [7] | ZHAO Lian-jun, WU Guo-ying, WANG Jia-yi. Review and prospect of vertical distribution by non-equilibrium sediment concentration theory, Journal of Hydroelectric Engineering, 2015, 31(4): 63-69. |
| [8] | MA Zhi-pu, GUO Qing-chao, GUAN Jian-zhao, et al. Non-equilibrium vertical distribution formula of suspended sediment concentration, Journal of sediment research, 2022, 47(3): 1-8. |
| [9] | HUO Li, CHENG Dong, DUAN Guang-lei, et al. Study on vertical distribution of suspended sediment concentration in the Jingjiang reach downstream the Three Gorges Dam, Journal of sediment research, 2020, 45(6): 27-32. |
| [10] | TAN Jian-hua, LI Ruo-hua, LIANG Bin. Discussion on vertical structure analysis of suspended sediment concentration of macro-tidal estuaries during spring tide-take Zhapu of Hangzhou Bay as an example, Hydro-Science and Engineering, 2009(2): 39-43. |
| [11] | YANG Hua, ZHAO ChongJiu, HOU Zhihua, et al. Study on sediment vertical distribution under wave and current of silty coast, Journal of waterway and harbor, 2006, 27(3): 142-146. |
| [12] | LI Rui-jie, FENG Qing, CHEN Jun, et al. Analysis on vertical distribution of nearshore fluid velocity and sediment concentration, Marine Science Bulletin, 2012, 31(6): 607-612. |
| [13] | LUO Zhao-sen. Computation of siltation in dredged channel in estuaries, Journal of sediment research, 1987, (2): 13-20. |
| [14] | SUN Zhi-lin, XIA Shan-shan, ZHU Xiao, et al. Formula for sediment carrying capacity of time-varying flow in estuaries, Journal of Tsinghua University (Natural Science Edition), 2010, 50(3): 383-386. |
| [15] | Zhi-lin Sun, En-shang Yang, Dan Xu, et al. Logarithmic Law for Transport Capacity of Nonuniform Sediment, Journal of Hydraulic Engineering, 2018, 144(3): 04017069. |
| [16] | Yingbiao Shi. Numerical Simulation of Salinity and Sediment Transport over Mobile Bed in the Qiantang Estuary. Ph. D. Thesis, Zhejiang University, 2022. |
| [17] | Wang Yangui, Shi Hongling, Cheng yin, et al. Runoff-Sediment Changes and Their Impacts of Major Rivers in China. Beijing: Science Press; 2023, pp 56-72. |
APA Style
Shi, Y., Cheng, W., He, K., Zhang, J. (2024). Study on Vertical Distribution of Sediment Concentration in the Tidal Estuary. Earth Sciences, 13(4), 141-150. https://doi.org/10.11648/j.earth.20241304.13
ACS Style
Shi, Y.; Cheng, W.; He, K.; Zhang, J. Study on Vertical Distribution of Sediment Concentration in the Tidal Estuary. Earth Sci. 2024, 13(4), 141-150. doi: 10.11648/j.earth.20241304.13
AMA Style
Shi Y, Cheng W, He K, Zhang J. Study on Vertical Distribution of Sediment Concentration in the Tidal Estuary. Earth Sci. 2024;13(4):141-150. doi: 10.11648/j.earth.20241304.13
@article{10.11648/j.earth.20241304.13,
  author = {Yingbiao Shi and Wenlong Cheng and Kun He and Jun Zhang},
  title = {Study on Vertical Distribution of Sediment Concentration in the Tidal Estuary
},
  journal = {Earth Sciences},
  volume = {13},
  number = {4},
  pages = {141-150},
  doi = {10.11648/j.earth.20241304.13},
  url = {https://doi.org/10.11648/j.earth.20241304.13},
  eprint = {https://article.sciencepublishinggroup.com/pdf/10.11648.j.earth.20241304.13},
  abstract = {The vertical distribution of sediment concentration in estuaries is the core issue of suspended sediment transport. At present, there are many researches on the vertical distribution of sediment concentration in rivers, and a lot of results have been achieved, but that in estuaries is seldom studied. The Yellow River Estuary (YRE) and the Qiantang River Estuary (QRE) are typical tidal estuaries with strong erosion/deposition and high concentration in China. Under the action of alternating tidal flow, the suspended sediment transport shows significant time-varying and non-equilibrium transport characteristics. The vertical distribution of sediment concentration is quite different from that of ordinary rivers. This paper analyzes the vertical distribution of sediment concentration under the action of tidal currents based on the theory of sediment movement and diffusion. Compared with equilibrium sediment transport, the vertical distribution of sediment concentration only differs by one vertical distribution coefficient. Based on the analysis of the measured data, it is found that the vertical distribution of sediment concentration in the YRE and QRE is mostly exponential. Firstly, the multivariate relationship between the vertical distribution coefficient and the sediment saturation and suspension index is established by means of the measured water and sediment data of the QRE. The correlation coefficient R2 was above 0.64, which has a good correlation. Finally, the established relationship was validated using measured water and sediment data from the YRE, and the results were basically consistent, indicating that the established formula for vertical distribution of sediment concentration is suitable for general tidal estuaries, and has a certain reference value for the simulation of sediment transport in the YRE and QRE.},
 year = {2024}
}
TY  - JOUR
T1  - Study on Vertical Distribution of Sediment Concentration in the Tidal Estuary

AU  - Yingbiao Shi
AU  - Wenlong Cheng
AU  - Kun He
AU  - Jun Zhang
Y1  - 2024/08/20
PY  - 2024
N1  - https://doi.org/10.11648/j.earth.20241304.13
DO  - 10.11648/j.earth.20241304.13
T2  - Earth Sciences
JF  - Earth Sciences
JO  - Earth Sciences
SP  - 141
EP  - 150
PB  - Science Publishing Group
SN  - 2328-5982
UR  - https://doi.org/10.11648/j.earth.20241304.13
AB  - The vertical distribution of sediment concentration in estuaries is the core issue of suspended sediment transport. At present, there are many researches on the vertical distribution of sediment concentration in rivers, and a lot of results have been achieved, but that in estuaries is seldom studied. The Yellow River Estuary (YRE) and the Qiantang River Estuary (QRE) are typical tidal estuaries with strong erosion/deposition and high concentration in China. Under the action of alternating tidal flow, the suspended sediment transport shows significant time-varying and non-equilibrium transport characteristics. The vertical distribution of sediment concentration is quite different from that of ordinary rivers. This paper analyzes the vertical distribution of sediment concentration under the action of tidal currents based on the theory of sediment movement and diffusion. Compared with equilibrium sediment transport, the vertical distribution of sediment concentration only differs by one vertical distribution coefficient. Based on the analysis of the measured data, it is found that the vertical distribution of sediment concentration in the YRE and QRE is mostly exponential. Firstly, the multivariate relationship between the vertical distribution coefficient and the sediment saturation and suspension index is established by means of the measured water and sediment data of the QRE. The correlation coefficient R2 was above 0.64, which has a good correlation. Finally, the established relationship was validated using measured water and sediment data from the YRE, and the results were basically consistent, indicating that the established formula for vertical distribution of sediment concentration is suitable for general tidal estuaries, and has a certain reference value for the simulation of sediment transport in the YRE and QRE.
VL  - 13
IS  - 4
ER  -
Zhejiang Institute of Hydraulics and Estuary (Zhejiang Institute of Marine, Planning and Design), Hangzhou, China; Zhejiang Provincial Key Laboratory of Estuary and Coast, Hangzhou, China
Biography: Yingbiao Shi is a Professor-level Senior Engineer and Assistant Chief Engineer in Zhejiang Institute of Hydraulics & Estuary (ZIHE). From 1985–1989 and 1991–1993, he completed his undergraduate and Master's degree studies in the Department of River Sediment Engineering, Wuhan Hydraulic and Electric Engineering University, and he obtained a Ph. D. in Engergy and Environmental Protection from Zhejiang University in China in 2022. From 1989 to now, he has worked in ZIHE. He is mainly engaged in scientific research on estuary sediment and estuary regulation. His research directions are numerical simulation of estuary sediment, riverbed evolution, water environment and ecology, etc. He developed 1D and 2D movable bed mathematical models of material transport; 2D coupled mathematical model of water flow, sediment transport and riverbed deformation, which have been well applied in flood and salinity prediction in the Qiantang River Estuary.
Research Fields: sediment transport, mathematical model, riverbed evolution, water environment, estuary and coastal engineering, disaster prevention and reduction.

Zhejiang Institute of Hydraulics and Estuary (Zhejiang Institute of Marine, Planning and Design), Hangzhou, China; Zhejiang Provincial Key Laboratory of Estuary and Coast, Hangzhou, China
Research Fields: computational water and sediment dynamics, estuary and coastal engineering, water environment, water conservancy, fluvial process.
Zhejiang Institute of Hydraulics and Estuary (Zhejiang Institute of Marine, Planning and Design), Hangzhou, China; Zhejiang Provincial Key Laboratory of Estuary and Coast, Hangzhou, China
Research Fields: physics model test, tidal bore dynamics, mathematical model, estuary and coastal engineering, wave model test.
Zhejiang Institute of Hydraulics and Estuary (Zhejiang Institute of Marine, Planning and Design), Hangzhou, China; Zhejiang Provincial Key Laboratory of Estuary and Coast, Hangzhou, China
Research Fields: ports and waterways, wave model test, sediment transport, estuary and coastal engineering, mechanics of fluids
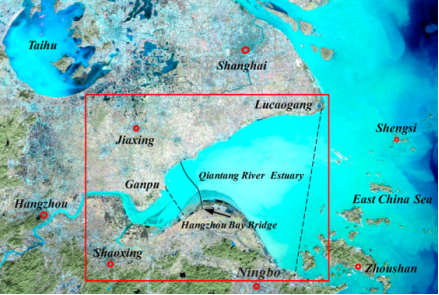
Figure 1. Sketch of the QRE.
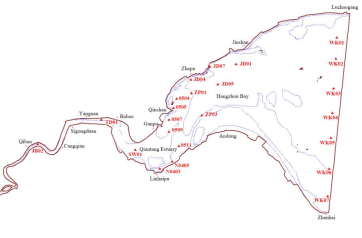
Figure 2. Location and distribution of observation points in the QRE.
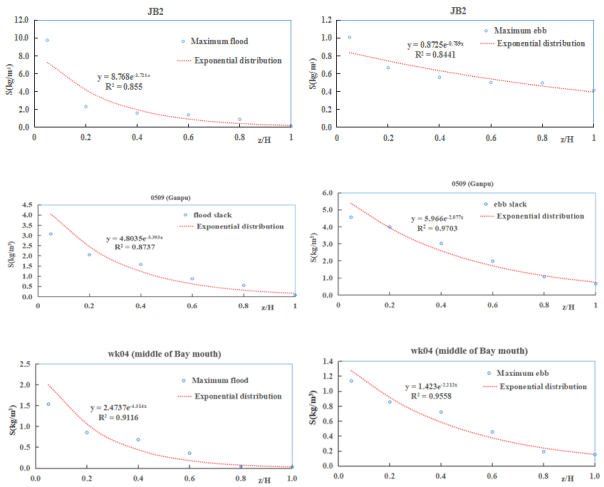
Figure 3. Fitting relationship of vertical distribution of sediment concentration in the QRE.
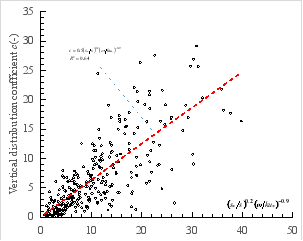
Figure 4. Correlation between vertical distribution coefficient and suspended index, sediment saturation.
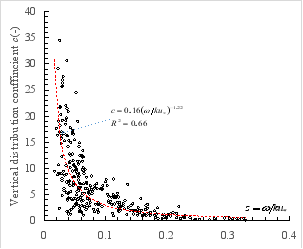
Figure 5. Correlation between vertical distribution coefficient and suspended index.
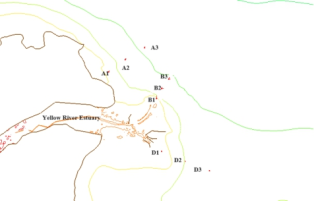
Figure 6. Location of observation points in the YRE.
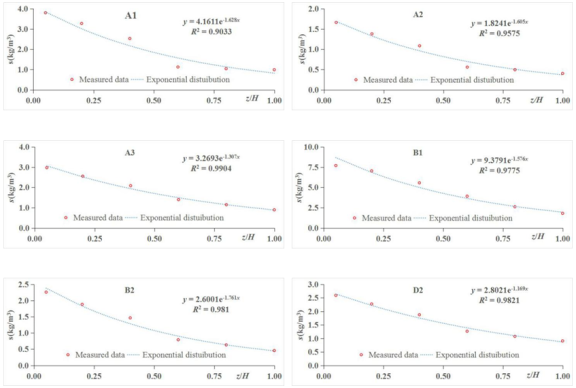
Figure 7. Fitting relationship of vertical distribution of sediment concentration in the YRE.
Information


