Research Article | | Peer-Reviewed

Study on Methylene Blue Adsorption Properties of Biochar/Montmorillonite Composites

Received: 10 July 2024     Accepted: 14 August 2024     Published: 20 August 2024
Views:       Downloads:
Abstract

The textile printing and dyeing industry, as one of the important pillars of the global economy, has become an environmental problem that needs to be solved because of the increasingly serious pollution of dye wastewater generated during its production process. Dye wastewater not only contains high concentrations of organic dyes, but also often accompanied by heavy metal ions, additives and salts and other pollutants, if discharged directly without effective treatment, will seriously pollute the water body, destroying the ecological balance, and affecting the survival and health of human beings and aquatic organisms. In order to deal with the problems of serious pollution, large discharge and high cost of dye wastewater, it is necessary to develop an efficient, economic and environmentally friendly wastewater treatment system. It is particularly important to develop efficient, economical and environmentally friendly wastewater treatment technologies. Adsorption is considered as a promising method for wastewater treatment. In this study, we focused on the development of new and efficient adsorbent materials. Taking methylene blue, a typical dye, as an example, we skillfully composited modified biochar with montmorillonite, a natural mineral material, through pyrolysis and intercalation strategies, and conducted in-depth investigations on the effects of the composites on the adsorption of methylene blue in water, the factors affecting the regeneration performance of the adsorbents, and the thermodynamic characteristics of the adsorption. The effect of the composite material on the adsorption of methylene blue in water, the factors affecting the regeneration performance of the adsorbent and the adsorption thermodynamic characteristics were investigated in depth, with a view to providing certain theoretical and practical references for the effective treatment of dye wastewater.

Published in Earth Sciences (Volume 13, Issue 4)
DOI 10.11648/j.earth.20241304.15
Page(s) 163-181
Creative Commons

This is an Open Access article, distributed under the terms of the Creative Commons Attribution 4.0 International License (http://creativecommons.org/licenses/by/4.0/), which permits unrestricted use, distribution and reproduction in any medium or format, provided the original work is properly cited.

Copyright

Copyright © The Author(s), 2024. Published by Science Publishing Group

Keywords

Biochar, Montmorillonite, Composites, Methylene Blue

1. Introduction
The Dye wastewater generally comes from textile, dyeing, cosmetics, food processing and papermaking industries, With the development of industry, the discharge of dye wastewater has increased significantly. The annual discharge of dye wastewater in China is as high as 7×10⁸ tons, accounting for about 10% of the total national wastewater discharge. The dye wastewater has the characteristics of complex composition, strong toxicity, difficult biodegradation, etc., and does great harm to human body, animals and plants. There are currently more than 100,000 known process dyes . Its main components are benzene, phenols, naphthalene, etc., but also contain heavy metals such as copper, zinc, arsenic and many other toxic substances . Once the dye wastewater is discharged into the water body, the types of pollutants in the water body will increase, the chroma will become darker, and the BOD and COD will rise sharply. In addition, the increase of pollutant types will make the water appear eutrophication and accompanied by odor production; Water discoloration will reduce the transmittance of sunlight and inhibit the photosynthesis of aquatic plants, thus destroying the self-purification ability of water . The significant increase of BOD and COD will cause the pollutants in the water to be unable to be degraded, so as to flow with the water body and cannot be concentrated, which will increase the difficulty of wastewater treatment. Among many kinds of dyes, methylene blue (MB) is one of the most common dye pollutants, which is a cationic solution in water, and contains a large number of toxic organic compounds, such as nitro compounds, amino compounds, halides and so on. Therefore methylene blue is highly toxic, carcinogenic and mutagenic , which will pose a serious threat to aquatic life and human health. Therefore, it is urgent to explore a high efficiency and low consumption treatment method. At present, although the treatment methods and theories of dye wastewater have been studied for a long time, there are still few effective methods that can be successfully applied. At present, the commonly used dye wastewater treatment methods are biological, chemical and physical methods, etc., these methods have advantages and disadvantages, or high energy consumption or high cost, and the treatment effect is not ideal. Therefore, it is urgent to explore a fast and scientific method to treat dye wastewater. In view of this, this study proposed a new idea of using agricultural waste to prepare biochar as an adsorbent to treat methylene blue dye wastewater by waste treatment. In recent years, agricultural waste is regarded as a low-cost, multi-purpose renewable resource, which can be used to prepare biochar for pollutant adsorption treatment. These agricultural wastes mainly include rice husks, wheat, potato straw, pine needles, discarded branches and leaves, sugarcane and corn straw. In this study, biochar/montmorillonite composite material was prepared by using rice husk, which was modified by ZnCl2 to improve its adsorption properties, and then combined with sodium-based montmorillonite by pyrolysis or intercalation in a certain proportion to prepare biochar/montmorillonite composite material. A comprehensive study was conducted on the performance, mechanism, influencing factors and thermodynamic dynamics characteristics of the composite material's adsorption of methylene blue dye. In order to provide a certain theoretical and practical reference for the treatment of dye wastewater.
2. Experimental Materials and Methods
2.1. Preparation of Biochar/Montmorillonite Composites
In this experiment, biochar prepared from rice husk and montmorillonite were selected as composite materials. Rice husk was purchased from farmers' market, and montmorillonite was purchased directly from a chemical company.
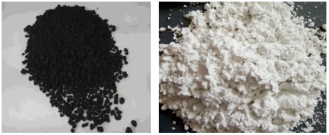
Figure 1. Biochar/montmorillonite preparation materials.
Preparation of composite materials by pyrolysis: According to the mass ratio of montmorillonite: materials with biochar of 2:1, 1.5:1, 1:1 and 1:1.5 were put into the corundum boat, and the corundum boat was shaken to make the materials evenly mixed. The corundum boat was put in a tube furnace and pyrolysis was conducted in 400°C nitrogen at a heating rate of 20°C·min-1 for 4 h to synthesize the composite material, and then the sample was cooled to room temperature.
Preparation of composite materials by intercalation: The sodium montmorillonite was added to the distilled water at 1:30 (m/V) and stirred for 2 h, and the mass was higher than that of montmorillonite: Rice husk carbon with biochar of 2:1, 1.5:1, 1:1 and 1:1.5 was added to NaOH solution with a concentration of 6% at 1:30 (m/V), stirred for 30 min to form a suspension. The rice husk carbon suspension was added to sodium montmorilonite solution, stirred in a mixer for 5 h, centrifugally washed until neutral, and then put into the oven for drying. After grinding 200 mesh sieve set aside.
2.2. Characterization of Materials
2.2.1. Scanning Electron Microscopy (SEM)
Scanning electron microscopy (SEM) uses secondary electron images and backscattered electron images to characterize the microstructure and composition information of materials, which is characterized by high resolution and wide observation area . The magnification of this experiment is 500-10000 times.
2.2.2. X-ray Diffraction Test (XRD)
X-ray diffraction test reflects the lattice space of the material using the diffraction pattern generated by the crystal, so as to reflect the changes of the material more clearly .
2.2.3. Specific Surface Area and Aperture Distribution Test (BET)
In this experiment, the N2 atmosphere was -190°C, the temperature was 250°C, and the time was 8 h. The mesopore was tested, the specific surface area was calculated using BET model, and the pore size distribution was calculated using BJH model to obtain the adsorption and desorption curve and other relevant parameters .
2.2.4. Fourier Transform Infrared Spectroscopy (FTIR)
In this experiment, the crystal structure parameters of the composite materials were obtained to verify the composite of biochar and montmorillonite .
2.3. Experimental Reagents and Instruments
The reagents and instruments used in the experiment are shown in Tables 1 and 2 below.
Table 1. Experimental reagents.

Drug names

Molecular formulate

purity

Nitrogen

N2

99.90~99.95%

sodium hydroxide

NaOH

analytically pure

hydrochloric acid

HCl

analytically pure

nitric acid

HNO3

analytically pure

phosphoric acid

H3PO4

analytically pure

vitriol

H2SO4

analytically pure

zinc chloride

ZnCl2

analytically pure

ultrapure water

H2O

analytically pure

diphenylcarbazide

C13H14N4O

analytically pure

methyl alcohol

CH3OH

analytically pure

imvite

Al2SiO10(OH)·H2O

analytically pure

Table 2. Experimental equipment.

Instrument name

Model

tube furnace

OTF-1200X

High speed univerdal crusher

FW100

ultraviolet and visible spectrophotometer

752

Shaking incubator

SKY-200B

electrothermal blowing dry box

HGZF-101-1

Circulating water multipurpose vacuum pump

SHB-3

electronic scales

FA2004

magnetic stirrer

HJ-4A

water bath

HH-2A

desk centrifuge

TA2-16K

X-ray diffraction

BrukerAXS D8

BET surface analyzer

MicromeriticsASAP2460

Fourier transform infrared spectroscopy

Thermo Scientific Nicolet iS5

2.4. Experimental Reagents and Instruments
2.4.1. Measuring Methoddrug Names
Appropriate amount of biochar/montmorillonite composite material was placed in conical bottle, MB solution was added, and then placed in a shaking table for constant temperature oscillation for adsorption . After adsorption, disposable needle filter was used for filtration. The blank control was ultra-pure water. The absorbance was measured by UV-VIS spectrophotometer after adsorption. The absorption wavelength of MB is 662 nm.
2.4.2. MB Standard Curve Drawing
Methylene blue was accurately weighed in the beaker to obtain solutions with concentrations of 0, 1, 2.5, 5, 8, 10, 13 and 15 mg·L-1, respectively. The absorbance was measured by ultraviolet spectrophotometer at 662 nm with ultra-pure water as the blank control wavelength. The linear regression equation is y=0.1856x+0.0193 (R2=0.9992), and MB standard Figure 2 is drawn.
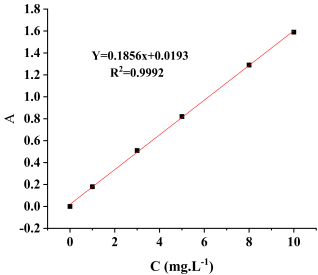
Figure 2. Standard curve of MB.
2.5. ELASA / EILSA / Radioallergosorbent Test
In this experiment, the adsorption properties of biochar/montmorillonite composites were investigated by single factor variables such as adsorption thermodynamics, adsorption isotherm, pH of adsorbent and dosage.
2.5.1. Effect of Composite Ratio of Adsorbent on Adsorption
Weighing 0.01g of composite materials obtained by pyrolysis and intercalation, in which the composite ratios of montmorillonite and biocharcoal were 2:1, 1.5:1, 1:1 and 1:1.5, the composite materials were transferred into methylene blue solution with a concentration of 50mg·L-1 and oscillated for 2 h in the oscillating chamber at 25°C and 180 rpm. The proper amount of filtrate was placed in the ultraviolet spectrophotometer to measure the absorbance, calculate the concentration, and get the best composite ratio.
2.5.2. Effect of Adsorbent Dosage on Adsorption
The methylene blue solution was 50 mL, the concentration was 100mg·L-1, the temperature was 25°C, the adsorption time was 2h, the natural pH, and the rotating speed of the shaker was 180 rpm. The influence of the dosage of different composite materials on the methylene blue adsorption was investigated. The dosage was 0.005, 0.01, 0.015, 0.02, 0.025, 0.03g, respectively.
2.5.3. Effect of Solution pH on Adsorption
Methylene blue solution with a volume of 50 mL, concentration of 50 mg·L-1, temperature of 25°C, adsorption time of 2 h, 0.015g pyrolysis composite R2M1D, 0.01g intercalation composite C1M1C, and shaking speed of 180 rpm, The effects of 1 mol·L-1 HCl and NaOH solution on the adsorption of different composites were investigated when the pH gradients were adjusted to 4, 6, 8, 10 and 12.
2.5.4. Effect of Initial Concentration, Temperature and Reaction Time on Adsorption
The experimental conditions of the influence of initial concentration, temperature and reaction time of adsorbent on adsorption are similar to those of adsorption mechanics and adsorption isotherm.
2.5.5. Adsorption Isotherm and Adsorption Thermodynamics
Methylene blue solution with a volume of 50 mL, concentration of 50, 100, 150, 200, 250 mg.L-1, pH value of 12, temperature gradient of 15°C, 25°C and 35°C, 0.015g pyrolytic composite R2M1D and 0.01g intercalation composite C1M1C were placed in conical bottles, respectively. The absorbance of the solution was determined after the solution was oscillated in the shaking table at 180 rpm for 2 h, and the Ce adsorption equilibrium concentration and qe adsorption equilibrium concentration of the solution concentration were calculated. The Langmuir model and Freundlich model were fitted to obtain the relevant parameters of the isotherm model, and the Van t Hoff formula was fitted. The relevant thermodynamic parameters are obtained .
2.5.6. Reaction Time and the Adsorption Dynamics
Under the experimental conditions of solution volume of 50 mL, concentration of 50 mg·L-1, temperature of 25°C, 0.015g pyrolytic composite R2M1D, 0.01g intercalation composite C1M1C, pH value of 12, and shaking speed of 180 rpm, continuous sampling was conducted. The time points were 5, 10, 20, 40, 60, 90, 120, 180, 150, 180, 240, 300 min. The concentration Ct of the solution was measured, that is, the concentration at time t. The adsorption quantity qt at time t was calculated according to the obtained data, which was used to fit the adsorption kinetic model.
2.5.7. Reaction Time and the Adsorption Dynamics
Through mass from the adsorbent adsorption desorption can make composite material cycle is repeated use, to reduce economic cost . Experimental steps are as follows: the adsorption of composite material from the corresponding saturated solution in leaching, into the 0.01 mol · L-1 NaOH or desorption in HCl solution 4 h, isolated composites with ultrapure water placed in the oven to dry, after cleaning for adsorption, cyclic adsorption five times after the determination of absorbance adsorption calculated and compared.
2.6. Data Processing Method
R=C0-CC×100%(1)
R—removal rate, %;
Cn——Initial concentration of solution, mg·L-1
C——The concentration of the solution in the bottle after adsorption of the adsorption material, mg·L-1;
q=V×(C0-C)M (2)
q—adsorption quantity, mg·g-1;
V——Volume of solution, L;
M——Material dosage, g.
3. Results and Discussion
3.1. Biological Characterization of Carbon/Montmorillonite Composites
3.1.1. SEM Analysis
Figure 3(a), (b), (c) and (d) are the electron microscope images of Modified biochar (ZBC), montmorillonite (MT), R2M1D and C1M1C magnified by 500, 5000 and 10000 times by scanning electron microscope, respectively.
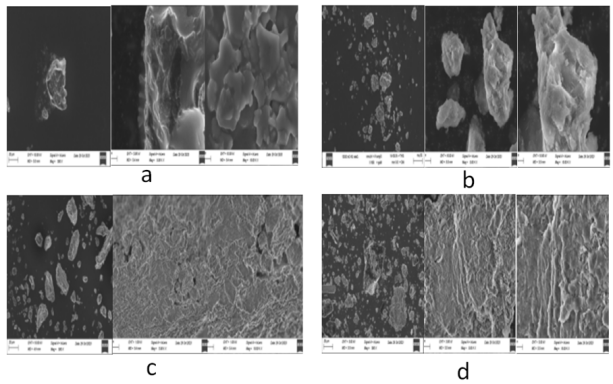
Figure 3. Scanning elevtion microscopy of ZBC, MT, R2M1D andC1M1C.
It can be seen from Figure 3a that ZBC biochar presents a tubular structure with different degrees of depression on the tube wall. These structures make ZBC biochar have more pore structure and larger specific surface area, which lays a foundation for the adsorption and removal of dyes. As can be seen from Figure 3b, MT presents particle states of different shapes and sizes, and its surface has a layered structure. It provides an important basis for the composite of biochar with tubular structure. It can be seen from Figure 3c that the surface of the pyrolysis composite R2M1D has a rough layered structure and certain pores. It can be clearly seen that the layered structure of MT is compounded with the pore structure of ZBC when magnified by 10,000 times. This indicates that biochar/montmorillonite composites with adsorption capacity have stronger adsorption capacity than ZBC and MT. It can be seen from Figure 3d that intercalation composite C1M1C presents the same granular structure as the above materials. At 5000 times magnification, the surface of the material has a layered structure of different shapes, and at 10000 times magnification, it can be obviously seen that the surface of the composite material also has a certain number of tiny pore structures. The combination of the two structures enhanced the adsorption effect of the composite on MB.
3.1.2. XRD Analysis
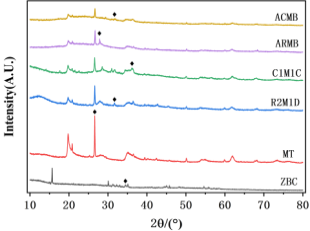
Figure 4. Test stepctrum of XRD.
According to Figure 4, the diffraction peak of ZnC appears at 2θ=34°, which is consistent with ZnCl2 modified biochar. When 2θ is between 26° and 28°, the diffraction peak of SiC appears in MT, which is consistent with the typical Si diffraction peak of montmorillonite. Composites R2M1D and C1M1C contain diffraction peaks matching SiC in the range of 30-38°, respectively, indicating that biochar and montmorillonite have been combined. After adsorption of MB, the ACMB and ARMB of the composite materials contain diffraction peaks matching NCS3CN in the range of 30~38°, and the nitrogen element can be judged to be mainly from MB, which indicates that the composite has a certain adsorption effect on MB.
3.1.3. BET Analysis
The modified biochar (ZBC), montmorillonite (MT), pyrolysis composite R2M1D and intercalation composite C1M1C were analyzed respectively, and the data are shown in Table 3.
Table 3. Pore structure data of ZBC, MT, R2M1D, C1M1C.

Material name

Specificarea (m²/g)

Total pore volume (cm3/g)

Mean poresize (nm)

ZBC

5.2881

0.020202

10.4803

MT

66.5910

0.150489

9.9968

R2M1D

7.0806

0.043878

21.3931

C1M1C

417.4614

0.289751

4.4441

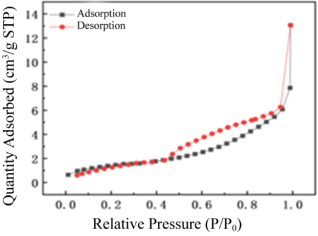
Figure 5. Absorption and desorption curves of Zbc.
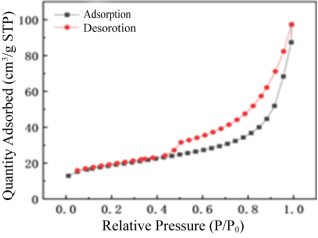
Figure 6. Absorption and desorption curves of MT.
As can be seen from Table 3, in terms of specific surface area, intercalation composite C1M1C has significantly improved compared with ZBC, MT and R2M1D, reaching 417.4614 m².g-1, which is 83 times that of ZBC with the lowest specific surface area value and 6 times that of MT. Moreover, in terms of total pore volume, intercalated composite C1M1C reached 0.289751 cm3.g-1, which was 93% and 48% higher than ZBC and MT, respectively, indicating that intercalated composite C1M1C was significantly different from other materials in terms of specific surface area and total pore volume. In terms of average pore diameter, the pyrolytic composite R2M1D reaches 21.3931 nm, which is 52 times that of ZBC and MT, and is the material with the largest average pore diameter. Intercalation composite C1M1C and pyrolysis composite R2M1D are both composed of ZBC and MT, which indicates that the combination of the two can effectively improve the specific surface area and total pore volume, so that the composite material has enough space to accommodate methylene blue molecules .
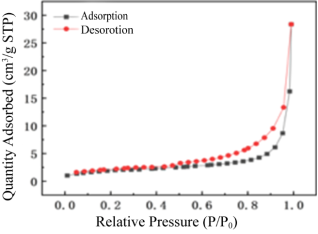
Figure 7. Absorption and desorption curves of R2M1D.
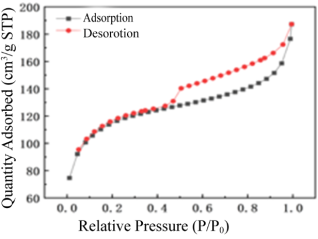
Figure 8. Adsorption and desorption curves of C1M1C.
The nitrogen adsorption-desorption curves of mesoporous materials are mostly type IV, that is, the adsorption and desorption branches cannot completely coincide, forming a hysteresis loop. As can be seen from Figures 5-8, the four materials in the experiment all have hysteresis loops and belong to H3 type. ZBC, MT, R2M1D and C1M1C are typical type IV. Under low relative pressure, the adsorption capacity rises sharply, which belongs to monolayer adsorption. When the relative pressure p/p0 is 0.3~0.5, the adsorption capacity is flat, which belongs to multilayer adsorption . When the relative pressure is high, the adsorbent will condense in capillary tubes, and p/p0 > 0.9 will continue to rise, which is caused by adsorption in large pores.
3.1.4. FRIT Analysis
The Fourier transform infrared spectra of ZBC, MT, R2M1D and C1M1C are shown in Figure 9.
As can be seen from Figure 9, the Fourier transform infrared spectra of MT, R2M1D and C1M1C are quite different from those of ZBC. ZBC has no vibration peak in the range of 1200~400 cm-1, indicating that the peak of the composite material exists because of the composition of MT, and MT is firmly composite on biochar. The four composites all have a peak formed by -OH stretching vibration at 3625 cm-1 and an N-H absorption peak at 3428 cm-1, indicating that several composites contain nitrogen. There is a single peak formed by C=C and C=O stretching vibration at 1637 cm-1, there is a peak formed by Si-O stretching vibration at 1037 cm-1, and there is a peak between 1500 and 400 cm-1, indicating that the vibration has a single bond peak . The peak at 470 cm-1 mainly describes the bending pattern of the silico-oxygen bond (Si-O).
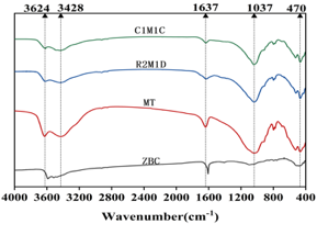
Figure 9. FRIT spectura of ZBC, MT, R2M1D, C1M1C.
3.2. Exploration of Adsorption Properties
3.2.1. FRIT Analysis
Optimum composite ratio of biochar/montmorillonite . The composite ratio of montmorillonite and biocharcoal was 2:1, 1.5:1, 1:1, and 1:1.5, respectively. The montmorillonite was transferred into 50 mL methylene blue solution with a concentration of 100 mg·L-1. After the adsorption was completed, the absorbency was measured and the adsorption capacity and removal rate were calculated, and Figures 9 and 10 were drawn.
It can be seen from the figure that the removal rate and adsorption capacity of MB of biochar/montmorillonite composite material are higher than that of biochar and montmorillonite single material. It can be seen from Figure 10. that the adsorption capacity and removal rate of MB of the pyrolysis composite R2M1D are higher than those of other composites, reaching 176.22mg.g-1 and 70.49%, respectively, which are 13% and 14% higher than that of ZBC. The MB removal rate and adsorption capacity of intercalated composite C1M1C were also higher than those of other intercalation composites, reaching 248.09mg.g-1 and 99%, respectively, which was 39% higher than that of ZBC. Therefore, the best composite ratio of pyrolysis and intercalation composites is montmorillonite: biochar is 2:1 and 1:1, respectively .
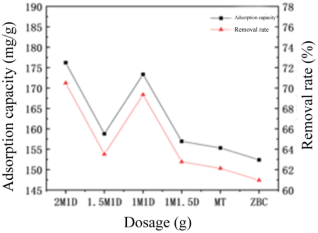
Figure 10. The effect of composite ratio on the adsorption of MB by the pyrolytic composite R2M1D.
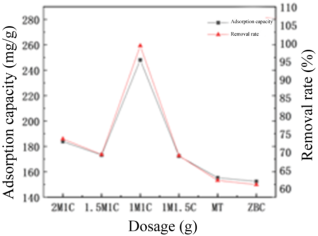
Figure 11. The effect of composite ratio on the adsorption of MB by the pyrolytic composite C1M1C.
3.2.2. Effect of Dosage of Composite Material on Adsorption Efficiency
Added 50 mL of methylene blue solution with a concentration of 50 mg·L-1 to 5 conical bottles, and then added 0.005, 0.01, 0.015, 0.02, 0.025g of pyrolytic composite R2M1D or intercalation composite C1M1C to them for adsorption experiments . Adsorption 2h. After the adsorption is completed, the adsorption amount and removal rate are calculated and shown in Figures 12 and 13.
As can be seen from Figure 12, when the pyrolysis composite R2M1D is in the additive mass range of 0.005~0.03g, the removal rate of methylene blue increases first and eventually tends to be flat, but the adsorption capacity generally shows a trend of decline . This is because with the increase of the dosage of composite materials, the binding sites of composite materials and methylene blue also increase, and the collision probability of adsorption materials and methylene blue molecules in the unit space increases, and the removal rate increases . When the dosage is 0.015g, the removal rate reaches 97% and the adsorption capacity reaches 143.4 mg.g-1. Compared with 0.001g, the removal rate increased by 2%. When the dosage was increased to 0.02g, the removal rate reached 99% and the adsorption capacity reached 124.0 mg.g-1. The removal rate and adsorption capacity tend to be flat as the dosage continues to increase. Pyrolysis composite R2M1D reached adsorption equilibrium for methylene blue solution with concentration of 50 mg.L-1 within 2h. When the dosage is 0.02g, the difference of removal rate is smaller and the adsorption capacity is lower than that of 0.015g. Therefore, from the economic considerations of material, removal rate and adsorption capacity, the optimal dosing amount of pyrolysis composite R2M1D is more appropriate at 0.015g .
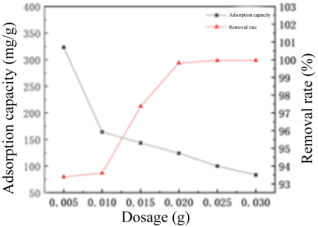
Figure 12. The effect of R2M1D dosage on the absorption of MB.
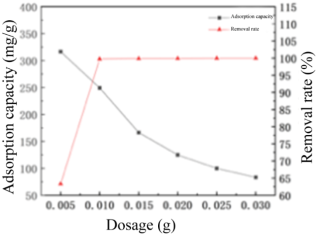
Figure 13. The effect of C1M1C dosage on the absorption of MB.
Similarly, as shown in Figure 13, the adsorption of methylene blue by intercalation composite C1M1C also showed a similar adsorption trend. In the addition range of 0.005~0.03g, the removal of methylene blue by intercalation composite C1M1C first increased with the increase of the dosage, and then tended to be flat when the dosage was 0.01g. The adsorption capacity reached 249.3 mg.g-1, but showed a downward trend overall. Therefore, the optimal dosage of intercalated composite C1M1C for adsorption of methylene blue solution with concentration of 50 mg.L-1 is 0.01g. When the concentration and volume of the wastewater solution are fixed, the more the dosage, the more the adsorption sites of the composite material for MB, the higher the adsorption capacity and removal rate will be .
3.2.3. Effect of pH on Adsorption Efficiency
The concentration of 50 mg·L-1 methylene blue solution was added, and the pH value was adjusted to 4, 6, 8, 10, 12, respectively. Then 0.015g pyrolytic composite R2M1D or 0.01 g intercalation composite C1M1C was added into the solution, respectively. After 2 h, the absorbance was determined by ultraviolet spectrophotometer to obtain the adsorption capacity and removal rate . The effects of different pH environments on MB removal rate and adsorption capacity are shown in Figures 14 and 15.
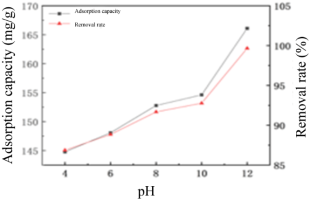
Figure 14. The effect of PH on MB adsorption by R2M1D.
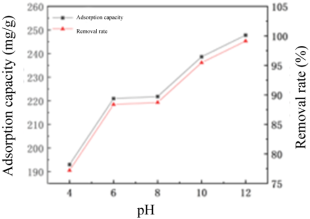
Figure 15. The effect of PH on MB adsorption by C1M1C.
Methylene blue is a cationic dye, which is the same as the positively charged composite material, and the coexistence of the two will cause repulsion, and methylene blue cannot be effectively adsorbed on the material, making the adsorption effect insignificant . Therefore, the pH of the solution is selected as 4, 6, 8, 10, 12. As can be seen from Figure 14, both the methylene blue removal rate and adsorption capacity of the pyrolytic composite R2M1D showed an increasing trend with the increase of pH. When pH value is 12, the removal rate reaches 99% and the adsorption capacity reaches 83.3 mg.g-1. Compared with pH 4, the removal rate increased by 13% and the adsorption capacity increased by 14%, which significantly improved the adsorption effect. When pH is between 10 and 12, the removal rate increases most significantly, with an increase of 7%. The results indicate that the adsorption effect of the pyrolytic composite R2M1D is not significant in acidic environment due to the competitive adsorption of H+ and methylene blue in the solution . Therefore, the adsorption of methylene blue under alkaline conditions is better than that under acidic environment, that is, the positive ions of methylene blue attract each other with the anions in the alkaline environment of the solution, and more adsorption opportunity sites are generated.
The adsorption effect of intercalated composite C1M1C on methylene blue is shown in Figure 15, and the removal rate and adsorption capacity have a similar increasing trend as that of pyrolysis composite R2M1D. When pH was 12, the removal rate reached 99% and the adsorption capacity was 247.8 mg.g-1. Compared with pH 4, the removal rate increased by 22%, the adsorption capacity increased by 21%, and the adsorption effect was significantly improved. The principle of adsorption is the same as that of pyrolysis .
3.2.4. Effect of Initial Concentration on Adsorption Efficiency
50mL methylene blue solution with a concentration of 50, 100, 150, 200, 250mg·L-1 was taken into a conical bottle with a pH of 10, and 0.015g pyrolytic composite R2M1D or 0.01g intercalation composite C1M1C were added into the solution. Two hours later, the absorbance was measured by ultraviolet spectrophotometer to obtain the adsorption capacity and removal rate . The effects of different initial concentrations of solution on MB removal rate and adsorption capacity are shown in Figures 16 and 17.
As shown in Figures 16 and 17 the methylene blue adsorption of the two composite materials decreased with the increase of solution concentration, while the adsorption capacity increased.
As shown in Figure 16, when the solution concentration of the pyrolysis composite R2M1D is 50mg.L-1, the removal rate reaches 99% and the adsorption capacity reaches 166mg.g-1. Compared with 250mg·L-1, the removal rate increases by 8% and the adsorption capacity decreases by 78%. The removal rate decreased the fastest when the solution concentration was between 50 and 100mg.L-1, with a decrease of 4%. The reduction reached 3% between 100 and 150mg.g-1, began to flatline at 200mg·L-1, and the removal rate of 250mg.L-1 was 91%. Therefore, the optimal initial concentration of methylene blue solution adsorbed by R2M1D is 50mg.L-1.
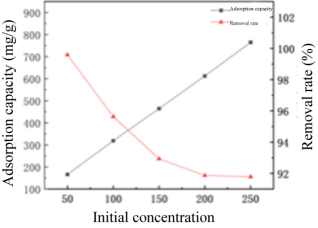
Figure 16. The effect of initial concentration on MB adsorption by R2M1D.
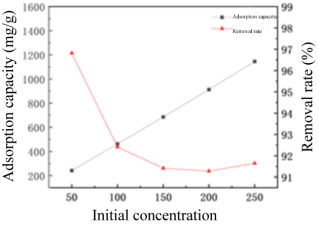
Figure 17. The effect of initial concentration on MB adsorption by C1M1C.
As shown in Figure 17 when the solution concentration of intercalated composite C1M1C was 50 mg·L-1, the removal rate reached 99%, and the adsorption capacity reached 242 mg· g-1, which increased by 5% compared with 250 mg·L-1, and the adsorption capacity decreased by 79%. The removal rate decreased the fastest when the solution concentration was between 50 and 100mg·L-1, the decrease reached 4%, and began to flatten out when the solution concentration was 100mg·L-1. Therefore, the optimal initial concentration of methylene blue solution adsorbed by intercalated composite C1M1C is also 50 mg·L-1.
In the low-concentration solution, the adsorbent has sufficient adsorption sites to supply, so the methylene blue removal rate of the composite material is relatively high in the initial stage of adsorption . With the increase of the methylene blue solution concentration, the adsorption site is gradually occupied completely, the adsorption mass removal rate decreases gradually, the adsorption mass transfer power increases, and the adsorption capacity increases .
3.2.5. Effect of Adsorption Time on Adsorption Efficiency
Take 12 conical bottles, add 0.015g pyrolytic composite R2M1D or 0.01g intercalation composite C1M1C into the bottles, and sample continuously under the experimental conditions of solution volume of 50 mL, concentration of 50 mg·L-1, temperature of 25°C, pH of 12, and shaking speed of 180 rpm. The time points were 5, 10, 20, 40, 60, 90, 120, 180, 150, 180, 240, 300 min. The absorbance was measured after 2h adsorption, and the corresponding concentration and removal rate were calculated. Taking the adsorption time as the horizontal coordinate and the removal rate and adsorption amount as the vertical coordinate, the diagram is as follows:
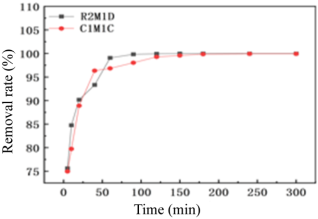
Figure 18. The effect of adsorption time on removal rate.
As can be seen from Figures 18 and 19, with the extension of adsorption time, the adsorption capacity and removal rate of the pyrolytic and intercalation composites show a trend of gradual increase at first and then gradual gradual decrease. The removal rate and adsorption capacity increased significantly within 0~40 min. Among them, the removal rate of 40min reached 93%, and the adsorption capacity reached 156 mg.g-1. Compared with the removal rate of the 5th min, the adsorption capacity reached 19 percentage points. Although the removal rate and adsorption capacity in the first 40~50 min were still increasing, the growth rate was significantly lower than that in the initial 40 min adsorption stage. These results indicate that both composites provide sufficient binding sites for methylene blue in the initial stage of adsorption. At the 60th minute, the removal rate and adsorption capacity showed a steady trend. It shows that the mass transfer rate becomes slow due to the occupation of adsorption sites and the decrease of adsorbent concentration, and the adsorption process eventually tends to be smooth. By comparing the two composite methods, it can be found that the initial adsorption reaction time of pyrolysis composite R2M1D is lower than that of intercalated composite C1M1C, and the removal rate and adsorption capacity of intercalated composite C1M1C do not change at the 150th minute, while that of intercalated composite C1m1C does not change at the 240th minute. Therefore, it can be concluded that the pyrolysis and intercalation composites need 150 min and 240 min respectively to reach the adsorption equilibrium. However, by comparing the removal rate and adsorption capacity in time, it can be concluded that the removal rate and adsorption capacity of the two composites have reached a flat state within 120 min. Therefore, from the economic consideration, it can be determined that the best adsorption time of the two composites is 120 min.
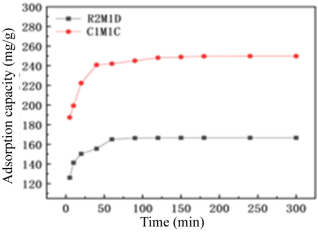
Figure 19. The effect of adsorption time on the absorption capacity.
3.2.6. Effect of Adsorption Temperature on Adsorption Efficiency
At 15°C, 25°C and 35°C, the adsorption of methylene blue on the composite material was determined, as shown in Figures 20 and 21.
It can be seen from Figures 20 and 21 that both the removal rate and adsorption capacity of pyrolysis and intercalation composites increase with the increase of temperature.
They all increased significantly between 15 and 25°C, and reached 165.20 mg.g-1 and 249.95 mg.g-1 at 35°C, respectively. The result shows that the Brownian motion is strong and the collision between methylene blue molecules and composites is intensified. In addition, the increase of temperature is conducive to the methylene blue molecules entering the internal pores of rice husk carbon and montmorillonite, which is conducive to the adsorption of methylene blue by composite materials. In addition, the adsorption process of most materials belongs to endothermic reaction, so the increase of temperature is conducive to the adsorption , which will be further analyzed in combination with adsorption thermodynamics.
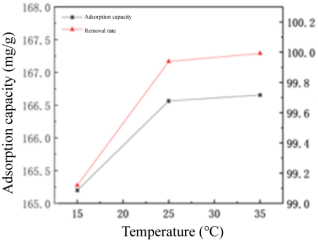
Figure 20. The effect of ambient temperature on MB adsorption by R2M1D.
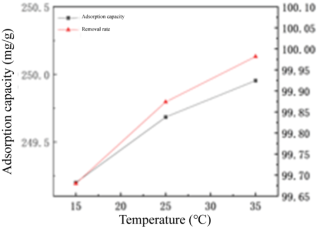
Figure 21. The effect of ambient temperature on MB adsorption by C1M1C.
3.2.7. Adsorption Kinetics
In this paper, the adsorption kinetics of MB by two kinds of composite materials is studied by using the model of in-particle diffusion. The experimental results were fitted by formula (3), (4) and (5) respectively.
1) Quasi-first-order kinetic model
The quasi-first-order kinetic model assumes that the diffusion step of adsorbed material is controlled during the adsorption process, and the adsorption rate is proportional to the difference between the adsorption amount when the adsorbed material reaches the adsorption equilibrium and the adsorption amount at time t. The formula is shown in equation (3).
dqdt=Kf(qe-qt)(3)
qt--the amount of adsorbed material adsorbed at time t;
qe-- Equilibrium adsorption capacity;
kf-- quasi-first-order reaction rate constant;
t-- Contact time.
Transform the formula (3) to get the expression (4).
ln(qe-qt)=ln(qe)-kft(4)
Equation (4) is used to process the experimental data, and linear fitting is performed with the horizontal and vertical coordinates, so that kf and qe can be calculated.
2) Quasi-second-order kinetic mode
The quasi-second-order kinetic model assumes electron exchange between adsorbent and adsorbent material. The formula is shown in equation (5).
dqdt=Ks(qe-qt)2(5)
qe, qt, t has the same concept as formula (3)
ks-- quasi-second-order rate constant, g·(mg·min)-1
The equation (5) is deformed to obtain a linear expression (6).
tqt=1ksqe2+tqe(6)
Equation (6) was used to process the experimental data to obtain the value of t/qt and take t and t/qt as horizontal and vertical coordinates for linear fitting, so that qe and ks can be calculated.
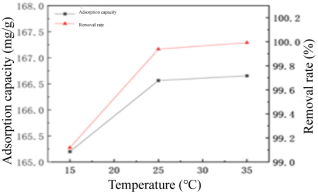
Figure 22. The pseudo-first-order adsorption kinetic model for the adsorption of MB onto R2M1D, C1M1C.
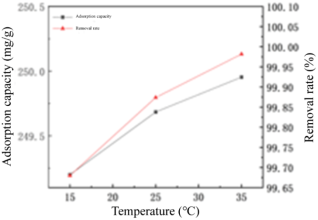
Figure 23. The pseudo- second -order adsorption kinetic model for the adsorption of MB onto R2M1D, C1M1C.
Table 4. Adsorption kinetic parameters of R2M1D, C1M1C for MB.

Materials

qexp (mg·g-1)

The first stage

The second stage

qe (mg·g-1)

kf (min-1)

Radj2

qe (mg·g-1)

ks (g·(mg·min)-1)

Radj2

R2M1D

166.64

52.61

5.48×10⁻²

0.98085

32.09

6.55×10⁻³

0.99895

C1M1C

249.79

55.03

3.00×10⁻²

0.97349

251.89

1.81×10⁻³

0.99998

According to the data in Table 4, the adsorption of MB by the two composites is more consistent with the quasi-second-order adsorption kinetics model. By comparing Radj2 of pyrolysis and intercalation composites, it can be concluded that the values of the pseudo-second-order adsorption kinetic equations are all above 0.99, and all are higher than the pseudo-first-order. The measured equilibrium adsorption capacity of intercalated composite C1M1C is 251.89mg.g-1 and the theoretical equilibrium adsorption quantum fitted by the quasi-second-order kinetic equation is only 2.1 numerically different. Therefore, the quasi-second-order adsorption kinetics model can better explain the adsorption process of MB by R2M1D and C1M1C composites, especially intercalated composites.
3) Intra-particle diffusion model
4) The kinetic equation cannot explain the diffusion on the surface and inside of the adsorbent particles, so in the adsorption process, the diffusion with a slower adsorption rate becomes the main factor affecting the adsorption process. In this experiment, the particle diffusion model was fitted by formula (7), as shown in the chart:
qt=kit0.5+C(7)
ki--Intra-particle diffusion rate constant, mg·g-1·min-0.5;
-Constants related to the thickness of the boundary layer, mg·g-1.
Ki and C can be calculated from the slope and intercept of the fitting equation, in which whether the fitting line passes through the origin or not can be used as the basis for judging the internal diffusion rate mechanism.
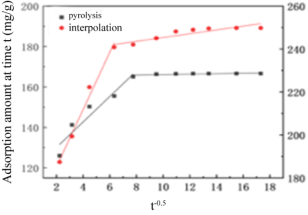
Figure 24. The intra-particle diffusion model for the adsorption of MB onto R2M1D, C1M1C.
Table 5. Intra-particle diffusion parameters of R2M1D, C1M1C for MB.

Materials

The first stage

The second stage

ki (mg·g-1·min-0.5)

Radj2

ki (mg·g-1·min-0.5)

Radj2

R2M1D

6.31034

0.91867

0.12028

0.49788

C1M1C

13.34311

0.98602

0.88297

0.83305

It can be seen from Figure 24 that the adsorption process of MB on the two composites can be divided into two stages: membrane diffusion and intra-particle diffusion, which shows that the pore structure of the composites can also improve the removal rate in the adsorption process. In addition, the fitting curves of the composites did not pass through the origin, which indicated that the adsorption rate was controlled by multiple adsorption mechanisms. It can be seen from Table 5 that with the extension of the adsorption time, the diffusion rate constants of the two composites in the first stage are much larger than those in the second stage, indicating that the adsorption process in the second stage is the main factor affecting the internal diffusion of the adsorbates.
3.2.8. Study on Adsorption Isotherm
In order to explore the adsorption mechanism of two kinds of composites for MB, Langmuir and Freundlich adsorption models will be used for non-linear fitting , as shown in the following chart:
1) Langmuir isothermal adsorption model
The Langmuir isothermal adsorption model assumes that the adsorption sites are limited and the forces acting on the adsorbents at the adsorption sites are the same, and there is no force between the adsorbents, which can achieve dynamic equilibrium and form a single molecular adsorption layer. The formula is like formula (8).
qe=QmaxK1Ce1+K1Ce(8)
In the formula:
qe——Equilibrium adsorption amount when adsorption reaches adsorption equilibrium, mg·g-1;
Ce——The concentration of residual dyes in the solution when the adsorption reaches equilibrium, mg·L-1;
Qmax——Adsorption capacity of unit mass adsorbent for intact monolayer dyes, mg·g-1;
Kl——Langmuir adsorption constant, which is related to the adsorption strength., L·mg-1.
2) Freundlich adsorption model
The Freundlich adsorption model shows that the concentration of adsorbate on the surface of the adsorbent is positively correlated with the concentration of the adsorbent solution. Theoretically, there will be infinite adsorption; in the application of heterogeneous systems, adsorption can only be completed by multi-layer adsorption .
qe=KfCe1n(9)
In the formula:
Kf——Freundlich equilibrium constant, which is related to the type of adsorbent and affinity, mg·g−1·(mg·L−1)−1/n;
n——Freundlich constant, dimensionless.
The size of the value of zone can indicate the adsorption intensity , when 0.1 < 1 area < 0.5, the adsorption process is easy to carry out, and 1 zone > 2.0 indicates that the adsorption is not easy.
According to MB concentration, adsorption capacity and removal rate, the fitting curves of MB removal efficiency of composite materials at different temperatures were drawn Figures 25, 26 and Table 6.
It can be seen from Table 6 that the correlation coefficient of Freundlich model is larger than that of Langmuir model under three ambient temperatures, which shows that Freundlich model is more suitable than Langmuir model to explain the adsorption of MB on composite R2M1D. In addition, the measured value Qme is larger than the curve fitting value Qmax, with a numerical difference of 90.13%. Therefore, it shows that the adsorption of MB by composite R2M1D accords with the hypothesis of Freundlich model, and belongs to multi-layer adsorption. It can also be seen from the table that the Kf increases with the increase of temperature, while the temperature decreases, that is, the heating is beneficial to the adsorption process. The values of 1Pao are all between 0.1 and 0.5, indicating that adsorption is easier to carry out .
Table 6. R2M1D composites adsorption isotherm parameters for MB.

Temperature (°C)

Qme (mg·g-1)

Langmuir

Freundlich

Qmax (mg·g-1)

Kl (L·mg-1)

Radj2

1n

Kf (mg·g1·(mg·L1)1/n)

Radj2

15

767.8214799

700.08882

0.42157

0.71293

0.34296

232.88847

0.71846

25

768.7194684

691.11036

0.57105

0.75866

0.32833

252.24802

0.805

35

770.4436063

666.63871

1.52684

0.78912

0.25517

332.89385

0.9053

Note: "Qme" is the experimental data, mg.g-1.
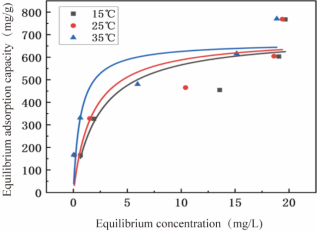
Figure 25. The pseudo-first-order adsorption kinetic model for the adsorption of MB onto R2M1D, C1M1C.
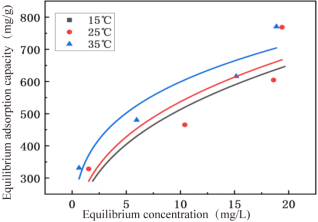
Figure 26. The pseudo- second -order adsorption kinetic model for the adsorption of MB onto R2M1D, C1M1C.
Table 7. C1M1C composites adsorption isotherm parameters for MB.

Temperature (°C)

Qme (mg·g-1)

Langmuir

Freundlich

Qmax (mg·g-1)

Kl (L·mg-1)

Radj2

1n

Kf (mg·g1·(mg·L1)1/n)

Radj2

15

1150.95097

2441.0944

0.03748

0.77887

0.70015

129.27583

0.88188

25

1154.83028

2503.2055

0.03123

0.55923

0.7417

105.33807

0.60029

35

1155.396013

4975.2635

0.01268

0.59548

0.81959

86.24556

0.66481

Note: "Qme" is the experimental data, mg.g-1.
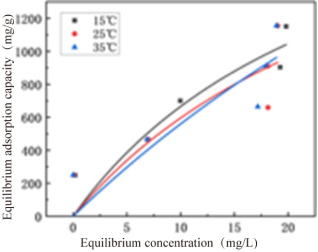
Figure 27. Langmuir adsorption model fit for C1M1C.
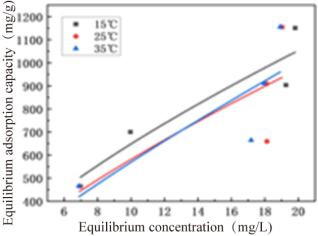
Figure 28. Freundlich adsorption model fit for C1M1C.
From Table 7, the Radj 2 of the Freundlich model is larger than that of the Langmuir model, indicating that the Freundlich model is more suitable for describing the adsorption of MB by C1M1C. By comparing the measured value Qme and the curve fitting value Qmax, we can find that there is a large gap between them, and the values of both are about 0.7, between 0.5 and 2, indicating that this adsorption process is not easy to carry out.
3.2.9. Adsorption Thermodynamics
In order to further explore the adsorption process and its mechanism, the thermodynamic parameters Gibbs free energy change Δ G, enthalpy change Δ H and entropy change Δ S were calculated by using the general formula (10, 11, 12) at 288K, 298K and 308K, respectively. The parameters are shown in Table 8:
G=-RTlnK(10)
G=H-TS(11)
K=qeCe(12)
In the formula:
K——The partition coefficient mL g-1, using the adsorption constant in Freundlich isotherm.;
ΔG——Gibbs free energy, kJ·mol-1;
ΔH——Enthalpy change, kJ·mol-1;
ΔS——Entropy change, kJ·mol-1·K-1;
R——Standard gas constant, 8.314, J·(mol·K)-1;
T——Standard gas constant, K.
Δ G0 can be calculated, Δ G0 and T are linearly fitted, and Δ H0 and Δ S0 are calculated by the intercept and slope of the regression equation.
Table 8. Adsorption thermodynamic parameters of R2M1D, C1M1C composites for MB.

Materials

Temperature (K)

ΔG (kJ·mol1)

ΔH (kJ·mol1)

ΔS (kJ·mol1·K1)

288

-13.05

13.26

0.0911

R2M1D

298

-13.70

308

-14.87

288

-11.41

14.928

0.0114

C1M1C

298

-11.54

308

-11.64

Table 8 shows that the Δ G of the two composites is negative at three ambient temperatures, that is, the adsorption of MB by the two composites does not need to be promoted by external forces. At the same time, the value of Δ G decreases with the increase of ambient temperature, indicating that the heating is beneficial to the adsorption reaction.
In general,-20 < Δ G < 0 kJ ·mol-1 is physical adsorption, Δ G <-40kJ ·mol-1 is chemical adsorption, or Δ H < 25 kJ ·mol-1 is physical adsorption, Δ H > 40 kJ ·mol-1 is chemical adsorption. According to the data in the table, the Δ H of the two composites is 13.26, 14.928 kJ ·mol-1 respectively, which is less than 25 kJ ·mol-1, which indicates that the adsorption process of the two composites to MB is physical adsorption. If the value of Δ H is positive, the adsorption process is endothermic and the heating up is beneficial to the adsorption. If the Δ S values are all positive, the adsorption is a process of entropy increase and the degree of confusion is high. Water molecules are replaced by dye MB molecules on the surface of the composites, resulting in an increase in entropy.
3.3. Cycle Performance of Composites
Desorption the saturated composite in 0.01mol/L HCl solution for 4h, separate the composite and wash it with ultra-pure water, put it in the oven after drying, continue to add the composite to the same solution, repeat five times and calculate the adsorption capacity. The results are as follows:
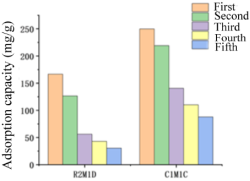
Figure 29. Recycle ability of composites to adsorb MB.
It can be seen from figure 29 that after 5 cycles and repeated experiments, the adsorption capacity of MB on the composites decreased one by one. Among them, the pyrolytic composite material R2M1D decreased from 166.636 mg.g-1 in the first time to 20.388 mg.g-1 in the fifth time, with a decrease of 88%, and the intercalated composite C1M1C decreased from 249.783 mg.g-1 in the first time to 30.905 mg.g-1 in the fifth time, with a decrease of 87%. The recycling performance decreased gradually and the adsorption capacity decreased significantly, because the desorption of MB on the composites was difficult, resulting in a small number of adsorption sites, and NaOH destroyed the pore structure of the composites.
3.4. Adsorption Mechanism
Through Fourier transform infrared spectroscopy, specific surface area and pore size distribution and other characterization methods and adsorption kinetics, adsorption thermodynamics, adsorption isotherm analysis, it is concluded that the adsorption of MB on composites is controlled by a variety of mechanisms. The functional groups on the surface of the composites interact with the positive charge in MB solution and the pH environment of the solution. So that MB molecules can be adsorbed by electrostatic gravitation with functional groups on the surface of composite materials. In addition, the MB molecule contains aromatic rings, which can interact with the π electrons of the composites to achieve the purpose of adsorption. According to the study of isotherm and intra-particle diffusion model, it can be found that the main removal mechanisms of MB in the composites are membrane diffusion, adsorption, intra-particle diffusion and so on. According to the analysis, the whole adsorption process is that MB molecules pass through the solid-liquid interface of the composite surface, and then adsorbed on the composite surface by a series of adsorption mechanisms such as electrostatic gravity, and gradually spread to the internal pore structure, while being transported to the adsorption site by π-π conjugation.
4. Conclusions
(1) single biochar and montmorillonite have certain adsorption capacity to methylene blue, but the adsorption properties of the composites are significantly higher than those of the two single materials. The optimum pyrolysis and intercalation ratio of biochar and montmorillonite is 2:1 and 1:1, and the adsorption capacity is 156.931 and 248.095 mg.g-1, respectively.
(2) the specific surface area of the intercalated composite C1M1C reaches 417.461 mg.g-1, which is 83 times that of ZBC and 6 times that of MT. From the Fourier transform infrared spectrum analysis, it can be concluded that the pyrolytic composite R2M1D, intercalated composite C1M1C, ZBC, MT all have Cmurh, Coluo, Czoc functional groups, and there are many kinds of functional groups.
(3) with the increase of the dosage of pyrolytic composite R2M1D and intercalated composite C1M1C, the removal rate of MB increases, but the adsorption capacity decreases.
(4) the alkaline environment is beneficial to the adsorption of MB. When the temperature is 25°C, the pH value is 12, the concentration of MB is 50 mg ·L-1, the dosage of R2M1D and C1M1C is 0.015 and 0.01 g respectively, the equilibrium adsorption capacity of the two composites to MB is 166.64 and 249.80 mg.g-1 respectively, and the removal rate is 95%.
Abbreviations

MB

Methylene Blue

ZBC

Modified Biochar

MT

Montmorillonite

Conflicts of Interest
The authors declare no conflicts of interest.
References
[1] Xiao W, Jiang X P, et al. Adsorption of organic dyes from wastewater by metal-doped porous carbon materials [J]. Journal of Cleaner Production, 2021, 284: 124773.
[2] Chen Chaojun, Wang Danqing, Han Wei. Application of chemical dye wastewater treatment technology [J]. Chemical Management, 2020(30): 102103.
[3] Xue Feihua, Zhu Baoyu. Study on the treatment of dye wastewater [J]. Environment and Development, 2019, 31(07): 9.
[4] Rajoriya S, Bargole S, George S, Saharan V. K, Hazard. Mater [J]. 2018, 344, 1109-1115.
[5] SEERA S D K, KUNDU D, GAMI P, et al. Synthesis and characterization of xylan-gelatin cros-linked reusable hydrogel for the adsorption of methylene blue [J]. Carbohydrate Polymers, 2021, 256: 117520.
[6] Pan Guiling. Optimization of sample preparation for scanning electron microscope [J]. Journal of Electron Microscopy, 2021, 40(4): 473-478.
[7] Gao Jihong. Standardized expression of quantities, test conditions and analytical parameters in X-ray diffraction analysis [J]. Journal of Ningxia University (Natural Science Edition), 2018.39(1): 93-96.
[8] Wu Jie. Preparation and modification of white poplar sawdust biochar and its adsorption effect on Cr (VI) [D]. Gansu: Lanzhou University of Technology, 2022.
[9] Du Chengzhen. Study on preparation and modification of corn straw biochar and treatment of typical dye wastewater [D]. Gansu: Lanzhou University of Technology, 2021.
[10] Chen Chaofan. Study on the efficiency and mechanism of phosphorus adsorption by Ca-mg modified rice husk-sludge biochar [D]. Heilongjiang: Harbin Institute of Technology, 2022.
[11] Cong Xin, Wang Yu, Li Yao, et al. Study on the adsorption properties of biochar and graphene oxide / biochar composites for antibiotics in water [J]. Journal of Ecological Environment, 2022 and 31(02): 326-334.
[12] Du Hailing, Zhang Yingshuang, Wang Hui, etc. Adsorption behavior of methylene blue by different microplastics [J]. Environmental Chemistry, 20222241(9): 2803-2812.
[13] Xiong Qingyue. Study on preparation and modification of peanut shell biochar and its adsorption properties for typical antibiotics in water [D]. Gansu: Lanzhou University of Technology, 2023.
[14] Romanovski V, Matsukevich I, Lipai Y. Cu/MgO and Ni/MgO composite nanoparticles for fast, high-efficiency adsorption of aqueous lead (II) and chromium (III) ions [J]. Journal of Materials Science, 2021, 56(8).
[15] Mohan D, Singh K P. Single- and multi-component adsorption of cadmium and zinc using activated carbon derived from bagasse-an agricultural waste [J]. Water Research, 2002, 36(9): 2304-2318.
[16] Shang Ziming. Study on preparation and modification of biochar and its removal effect and mechanism of dyes in water [D]. Gansu: Lanzhou University of Technology, 2021.
[17] Hong T T, Okabe H, Hidaka Y, et al. Equilibrium and kinetic studies for silver removal from aqueous solution by hybrid hydrogels [J]. Journal of Hazardous Materials, 2019, 365 (MAR.5): 237-244.
[18] Viglašová E, Galamboš M, Danková Z, Krivosudský L, Lengauer CL, Hood-Nowotny R, Soja G, Rompel A, Matík M, Briančin J. Production, characterization and adsorption studies of bamboo-based biochar/montmorillonite composite for nitrate removal. Waste Management. 2018 79: 385-94.
[19] Pan Ziqian, Huang Huajun, he Xiaowu, et al. Adsorption characteristics and mechanism of methylene blue by sludge liquefied biochar [J]. Chinese Environmental Science, 2020jue 40(01): 217-226.
[20] Liu Q S, Zheng T, Li N, et al. Mod dification of bamboo-based activated carbon using microwave radiation and its eff fects on the adsorption of methylene blue [J]. Applied Surface Science: A Journal Devoted to the Properties of Interfaces in Relation to the Synthesis and Behavi iour of Materi-als, 2010, 256(10): 3309-3315.
[21] Akhtar M, Bhanger M I, Iqbal S, et al. Sorption potential of rice huskfor the removal of 2,4-dichlorophenol from aqueous solutions: kinetic and thermodynamic investigations [J]. Journal of Hazardous Materials, 2006, 128(1): 44-52.
[22] Yang Lin, Wu Pingxiao, Liu Shuai, etc. Study on the adsorption of cadmium and tetracycline in water by amphoteric modified montmorillonite [J]. Journal of Environmental Science, 2016. 36(6): 2033-2042.
[23] Pang W, Tian G, Zong L, et al. Mesoporous hybrid Zn-silicate derived from red palygorskite clay as a high-efficient adsorbent for antibiotics [J]. Microporous and mesoporous materials, 2016, 234: 317-325.
[24] Cai Chenjian. Study on removal efficiency and mechanism of tetracycline in water by activated sludge and magnetic biochar [D]. Lanzhou Jiaotong University, 2021.
[25] Trail Jintao. Study on preparation, characterization and adsorption application of bare walnut shell activated carbon [D]. Xizang University, 2020.
[26] Peng X, Huang D, Odoom-Wubah T, et al. Adsorption of anionic and cationic dyes on ferromagnetic ordered mesoporous carbon from aqueous solution: Equilibrium, thermodynamic and kinetics [J]. Journal of Colloid & Interface Science, 2014, 430: 272-282.
[27] Xiang Q, Lv K, Yu J. Pivotal role of fluorine in enhanced photocatalytic activity of anatase TiO2 nanosheets with dominant (001) facets for the photocatalytic degradation of acetone in air [J]. Applied Catalysis B: Environmental. 2010 Jun 7; 96(3-4): 557-64.
[28] Zhang Jingwen. High gravity enhanced activated carbon modification and treatment of phenol-Cr (VI) composite wastewater [D]. Shanxi: central North University, 2022.
[29] Chen Zhuang. Study on the characteristics and mechanism of adsorption of Cr (VI) by biochar immobilized microbial composites [D]. Suzhou University of Science and Technology, 2021.
[30] Cheng Haiyan, Qiu Yuping, Dai Zhijun, et al. Study on the adsorption behavior of Pb (II) by tidal flat sediments in Pudong airport [J]. Jiangsu Environmental Science and Technology, 2007. 20(2): 1-4.
[31] Dan Y X, Wei Y, Xiong J Y, et al. Impact of post-processing modes of precursor on adsorption and photocatalytic capability of mesoporous TiO2 nanocrystallite aggregates towards ciprofloxacin removal [J]. Chemical Engineering Journal, 2018, 349: 1-16.
[32] Yu F, Yong L, Sheng H, et al. Adsorptive removal of ciprofloxacin by sodium alginate/graphene oxide composite beads from aqueous solution [J]. Journal of colloid and interface science, 2016, 484: 196-204.
[33] Zheng Q, Durkin D P, Elenewski J E, et al. Visible-lightresponsive graphitic carbon nitride.rational design and photocatalytic applications for water treatment [J]. Environmental Science & Technology, 2016, 50(23): 12938-12948.
[34] Deng F, Lu X, Luo Y, et al. Novel visible-light-driven direct Z-scheme CdS/Culns2 nanoplates for excellent photocatalytic degradation performance and highly-efficient Cr (VI) reduction [J]. Chemical Engineering Journal, 2019, 361: 1451-1461.
[35] Li Z, Wang L, Qin L, Lai C, Wang Z, Zhou M, Liu S, Zhang M. Recent advances in the application of water-stable metal-organic frameworks: Adsorption and photocatalytic reduction of heavy metal in water. Chemosphere. 2021. 285: 131432.
[36] Wei CM, Gu JC, Ge YS. Study on chromium sorption from wastewater using activated carbon loaded metal. Applied Mechanics and Materials. 2013. 368: 805-8.
[37] Ding CS, Ni FM, Cai HY, Zhu QF, Zou YL. Study on the absorption action of modified activated carbon for phenol. Advanced Materials Research. 2010. 113: 1981-5.
[38] Yue Jie, Zhang Zongbao. Analysis of environmental monitoring wastewater and industrial wastewater treatment technology [J]. Shanxi Chemical Industry, 2023 and 43(7): 233-235.
[39] Editor-in-chief of Golden Green Pine. Centrifugal separation [M]. Chemical Industry Press, 2008.
[40] Staszak K, Kruszelnicka I, Ginter-Kramarczyk D, Góra W, Baraniak M, Lota G, Regel-Rosocka M. Advances in the removal of Cr (III) from spent industrial effluents—A review. Materials. 2022. 16(1): 378.
Cite This Article
  • APA Style

    Han, Z., Wang, K., Zhang, Y., Xian, A., Wei, X., et al. (2024). Study on Methylene Blue Adsorption Properties of Biochar/Montmorillonite Composites. Earth Sciences, 13(4), 163-181. https://doi.org/10.11648/j.earth.20241304.15

    Copy | Download

    ACS Style

    Han, Z.; Wang, K.; Zhang, Y.; Xian, A.; Wei, X., et al. Study on Methylene Blue Adsorption Properties of Biochar/Montmorillonite Composites. Earth Sci. 2024, 13(4), 163-181. doi: 10.11648/j.earth.20241304.15

    Copy | Download

    AMA Style

    Han Z, Wang K, Zhang Y, Xian A, Wei X, et al. Study on Methylene Blue Adsorption Properties of Biochar/Montmorillonite Composites. Earth Sci. 2024;13(4):163-181. doi: 10.11648/j.earth.20241304.15

    Copy | Download

  • @article{10.11648/j.earth.20241304.15,
      author = {Zhiyong Han and Kexin Wang and Yanxia Zhang and Ao Xian and Xinpeng Wei and Zixuan Wang},
      title = {Study on Methylene Blue Adsorption Properties of Biochar/Montmorillonite Composites
    },
      journal = {Earth Sciences},
      volume = {13},
      number = {4},
      pages = {163-181},
      doi = {10.11648/j.earth.20241304.15},
      url = {https://doi.org/10.11648/j.earth.20241304.15},
      eprint = {https://article.sciencepublishinggroup.com/pdf/10.11648.j.earth.20241304.15},
      abstract = {The textile printing and dyeing industry, as one of the important pillars of the global economy, has become an environmental problem that needs to be solved because of the increasingly serious pollution of dye wastewater generated during its production process. Dye wastewater not only contains high concentrations of organic dyes, but also often accompanied by heavy metal ions, additives and salts and other pollutants, if discharged directly without effective treatment, will seriously pollute the water body, destroying the ecological balance, and affecting the survival and health of human beings and aquatic organisms. In order to deal with the problems of serious pollution, large discharge and high cost of dye wastewater, it is necessary to develop an efficient, economic and environmentally friendly wastewater treatment system. It is particularly important to develop efficient, economical and environmentally friendly wastewater treatment technologies. Adsorption is considered as a promising method for wastewater treatment. In this study, we focused on the development of new and efficient adsorbent materials. Taking methylene blue, a typical dye, as an example, we skillfully composited modified biochar with montmorillonite, a natural mineral material, through pyrolysis and intercalation strategies, and conducted in-depth investigations on the effects of the composites on the adsorption of methylene blue in water, the factors affecting the regeneration performance of the adsorbents, and the thermodynamic characteristics of the adsorption. The effect of the composite material on the adsorption of methylene blue in water, the factors affecting the regeneration performance of the adsorbent and the adsorption thermodynamic characteristics were investigated in depth, with a view to providing certain theoretical and practical references for the effective treatment of dye wastewater.
    },
     year = {2024}
    }
    

    Copy | Download

  • TY  - JOUR
    T1  - Study on Methylene Blue Adsorption Properties of Biochar/Montmorillonite Composites
    
    AU  - Zhiyong Han
    AU  - Kexin Wang
    AU  - Yanxia Zhang
    AU  - Ao Xian
    AU  - Xinpeng Wei
    AU  - Zixuan Wang
    Y1  - 2024/08/20
    PY  - 2024
    N1  - https://doi.org/10.11648/j.earth.20241304.15
    DO  - 10.11648/j.earth.20241304.15
    T2  - Earth Sciences
    JF  - Earth Sciences
    JO  - Earth Sciences
    SP  - 163
    EP  - 181
    PB  - Science Publishing Group
    SN  - 2328-5982
    UR  - https://doi.org/10.11648/j.earth.20241304.15
    AB  - The textile printing and dyeing industry, as one of the important pillars of the global economy, has become an environmental problem that needs to be solved because of the increasingly serious pollution of dye wastewater generated during its production process. Dye wastewater not only contains high concentrations of organic dyes, but also often accompanied by heavy metal ions, additives and salts and other pollutants, if discharged directly without effective treatment, will seriously pollute the water body, destroying the ecological balance, and affecting the survival and health of human beings and aquatic organisms. In order to deal with the problems of serious pollution, large discharge and high cost of dye wastewater, it is necessary to develop an efficient, economic and environmentally friendly wastewater treatment system. It is particularly important to develop efficient, economical and environmentally friendly wastewater treatment technologies. Adsorption is considered as a promising method for wastewater treatment. In this study, we focused on the development of new and efficient adsorbent materials. Taking methylene blue, a typical dye, as an example, we skillfully composited modified biochar with montmorillonite, a natural mineral material, through pyrolysis and intercalation strategies, and conducted in-depth investigations on the effects of the composites on the adsorption of methylene blue in water, the factors affecting the regeneration performance of the adsorbents, and the thermodynamic characteristics of the adsorption. The effect of the composite material on the adsorption of methylene blue in water, the factors affecting the regeneration performance of the adsorbent and the adsorption thermodynamic characteristics were investigated in depth, with a view to providing certain theoretical and practical references for the effective treatment of dye wastewater.
    
    VL  - 13
    IS  - 4
    ER  - 

    Copy | Download

Author Information
  • Abstract
  • Keywords
  • Document Sections

    1. 1. Introduction
    2. 2. Experimental Materials and Methods
    3. 3. Results and Discussion
    4. 4. Conclusions
    Show Full Outline
  • Abbreviations
  • Conflicts of Interest
  • References
  • Cite This Article
  • Author Information