Research Article | | Peer-Reviewed

Geospatial Mapping of Soil Morphological Properties in Irrigated Farmlands of Jahun LGA, Jigawa State, Nigeria

Received: 22 June 2026     Accepted: 7 July 2026     Published: 24 August 2026
Views:       Downloads:
Abstract

Soil morphological properties are important indicators of soil health, agricultural productivity, and sustainable land management. In semi-arid regions such as northern Nigeria, these properties are influenced by climatic conditions, irrigation practices, and land-use activities, affecting soil quality and crop performance. This study employed an integrated geospatial approach to assess and map soil morphological properties within irrigated farmlands of the Habazaya Irrigation Area in Jahun Local Government Area, Jigawa State, Nigeria. Sentinel-2 imagery, Digital Elevation Model (DEM) data, Geographic Information Systems (GIS), and field-based soil survey techniques were combined to examine spatial variability in soil conditions. Field sampling was conducted at 10 locations where soil samples were collected from 0-30 cm depth and analyzed for pH, bulk density, structure, consistency, and texture. Spectral indices, including the Bare Soil Index (BSI) and Normalized Difference Moisture Index (NDMI), were derived from Sentinel-2 imagery and integrated with field observations for spatial and statistical analysis. Ordinary Least Squares (OLS) regression was used to evaluate relationships between soil properties and remotely sensed variables. The findings revealed that sandy loam (29.62%) and sandy clay (21.33%) were the dominant soil textural classes. Approximately 76.38% of the study area exhibited low to very low moisture conditions, while 94.99% of the irrigation area was classified as well-drained. Soil pH ranged from 5.0 to 7.0, whereas bulk density ranged from 1.08 to 1.40 g/cm3. Predictive modeling showed weak performance for pH (R2 = 0.145) but stronger predictive potential for bulk density (R2 = 0.744). Loose soil structure dominated 80% of sampled locations, while slightly sticky consistency accounted for 40%. The study demonstrates the value of integrating remote sensing, GIS, and field observations for improved soil characterization and sustainable irrigation management.

Published in Engineering and Applied Sciences (Volume 11, Issue 4)
DOI 10.11648/j.eas.20261104.14
Page(s) 141-154
Creative Commons

This is an Open Access article, distributed under the terms of the Creative Commons Attribution 4.0 International License (http://creativecommons.org/licenses/by/4.0/), which permits unrestricted use, distribution and reproduction in any medium or format, provided the original work is properly cited.

Copyright

Copyright © The Author(s), 2026. Published by Science Publishing Group

Keywords

Morphology, Sentinel-2, Indices, Geospatial, Regression

1. Introduction
Soil is a vital natural resource that supports agricultural productivity, sustains ecosystems, preserves biodiversity, and maintains overall environmental health. Soil morphological properties are fundamental indicators of soil health, productivity, and suitability for land management, environmental sustainability, and agricultural planning. These properties, including texture, colour, structure, consistency, mottles, cutans, pores, concretions, and horizon boundaries, play a vital role in determining soil fertility, water retention capacity, and overall suitability for irrigation .
In semi-arid regions, particularly in northern Nigeria, soil characteristics exhibit significant spatial variability due to the combined influences of climatic fluctuations, diverse land-use practices, and intensive irrigation activities . In irrigated agricultural systems, soil morphological and physicochemical properties are often modified by processes such as compaction, salinization, erosion, loss of organic matter, nutrient depletion, and waterlogging. These processes can degrade soil structure and productivity, thereby posing challenges to sustainable agricultural development .
Irrigation is widely practiced to enhance crop production in areas experiencing insufficient or erratic rainfall. However, improper irrigation management, particularly over-irrigation, can adversely affect soil morphological and chemical properties, leading to structural degradation, compaction, and increased salinity . Understanding the spatial distribution and variability of these soil properties is therefore essential for effective irrigation planning and sustainable land management.
Traditional soil assessment methods, which rely on field surveys and laboratory analyses, are often labour-intensive, time-consuming, and limited in spatial coverage. In contrast, advancements in geospatial technologies, particularly Remote Sensing and Geographic Information Systems (GIS), have provided efficient tools for analysing and mapping soil properties over large areas. Satellite imagery provides synoptic and repetitive coverage, enabling the cost-effective derivation of indices associated with soil and vegetation conditions. For instance, spectral indices such as the Normalised Difference Vegetation Index (NDVI) and Bare Soil Index (BSI) are widely used to identify vegetation cover and exposed soil surfaces, thereby supporting soil mapping and land degradation assessment when integrated with field observations .
Jahun Local Government Area in Jigawa State is a prominent irrigation zone characterized by extensive agricultural activities. Despite its importance, there is limited detailed spatial information on the distribution of soil morphological properties within its irrigated farmlands. This gap constrains effective land management, irrigation planning, and the adoption of sustainable agricultural practices in the area.
The identification and interpretation of soil morphological characteristics through field-based profile descriptions provide essential information for understanding soil variability. When integrated with geospatial techniques, these characteristics can be effectively analysed and mapped to reveal their spatial distribution, support soil evaluation, and guide sustainable irrigation and land management practices .
Therefore, this study aims to assess and geospatially map the distribution of soil morphological properties in irrigated farmlands of Jahun Local Government Area, Jigawa State, Nigeria. Specifically, the study seeks to characterise the soil morphological properties of selected irrigated farmlands in the study area, analyse their spatial variability using GIS techniques, generate spatial distribution maps of key soil morphological properties, examine the influence of irrigation practices on these characteristics, and evaluate their implications for irrigation suitability and sustainable land management.
2. Materials and Methods
2.1. Study Area
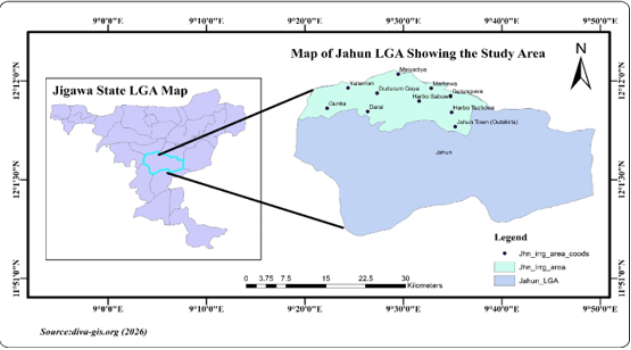
The study area, locally known as Habazaya Irrigation Area, covers approximately 8.18 km2 and is located in the vicinity of Maiyadiya, Harbo Tsohowa/Sabuwa, Markewa, Gurunguwa, Yalleman, Darai, Ganku, Jahun town (outskirts), and Dudurum Gaya in Jahun Local Government Area of Jigawa State, Nigeria. The area lies between latitudes 12°08′08″N and 12°10′32″N and longitudes 09°31′06″E and 09°37′00″E (Figure 1) .
The terrain around the irrigated areas is characterised by a low-lying, gently undulating plain with narrow elevations ranging from approximately 360 to 400 m above mean sea level , indicating a relatively flat terrain. The landscape is predominantly a flat floodplain, exhibiting a dendritic drainage pattern of seasonal streams fed by surface runoff during the rainy season and forming part of the Hadejia River basin floodplain system that supports irrigation agriculture. This gentle topography plays a significant role in soil formation processes and the spatial variability of soil properties.
Climatically, the area falls within the warm semi-arid (BSh) zone according to the Köppen classification. Jahun in Jigawa State experiences temperatures ranging from approximately 13°C to 40°C, with a mean annual rainfall of 520 mm to about 960 mm . The rainfall pattern is highly seasonal, which, combined with irrigation practices, strongly affects soil moisture conditions and salinity dynamics.
Land use within the irrigation area is dominated by cropland and grassland, interspersed with scattered trees of varying species. The inhabitants' socio-economic activities are predominantly agricultural, including crop production, livestock rearing, and limited off-farm activities, all of which contribute to land-use variability and changes in soil conditions within the area.
Figure 1. Index map of Jigawa State showing Jahun Local Government Area and the study area.
2.2. Research Design
This study adopts an integrated geospatial approach combining remote sensing, Geographic Information Systems (GIS), and field-based soil survey techniques. The approach involves satellite image analysis, ground truth data collection, and spatial modelling to map soil morphological properties.
2.3. Data Requirements and Sources
2.3.1. Satellite Data
Multispectral Sentinel-2 imagery was acquired from the Copernicus Open Access Hub and used for land surface analysis and the derivation of soil indices. Cloud-free scenes captured during the dry season were selected to enhance soil surface visibility and reduce vegetation interference . The Sentinel-2 Level-2A product provides atmospherically corrected surface reflectance data in multiple spectral bands. These bands are suitable for generating indices that are sensitive to soil colour, texture, moisture, and mineral composition, particularly under conditions of minimal vegetation cover.
2.3.2. Ancillary Data
The analysis incorporates several ancillary datasets to enhance the understanding of the terrain and land use in the irrigated farmlands of Jahun LGA. A Digital Elevation Model (DEM) is utilised for detailed terrain analysis and to provide essential information on the elevation and topographic characteristics of the study area, which supports spatial interpretation and environmental assessment. In addition, administrative boundary maps are included to delineate the specific irrigated farmlands within Jahun LGA. Existing soil and land-use maps, where available, further support a comprehensive assessment of land characteristics and usage patterns in the study area. These datasets collectively support a more informed analysis of the geographical and environmental context.
2.3.3. Field Data
Field data collection involved soil sampling and morphological descriptions at designated points within irrigated farmlands. A handheld Global Positioning System (GPS) device was used to record the geographic coordinates of each sampling point, ensuring precise mapping of the collected data. This approach facilitates a comprehensive understanding of soil characteristics across the selected agricultural areas.
2.4. Sampling Techniques and Field Survey
2.4.1. Sampling Techniques
The soil sampling procedure comprised a detailed examination of soil profiles at designated sampling points. At each sampling point, soil was excavated to a standard depth of 0-30 cm using a ruler, a garden hand shovel, and a 15 cm quadrat to ensure accurate assessment of soil characteristics. Samples were collected systematically at a uniform depth to enhance data consistency and reliability. This standardised approach ensures the collection of representative soil samples suitable for subsequent analysis.
2.4.2. Field Survey
A field survey was conducted to collect primary data on the soil morphological properties of irrigated farmlands in Jahun Local Government Area, Jigawa State. Representative sampling locations were identified through reconnaissance, and soil profile pits or auger holes were examined in accordance with the Guidelines for Soil Description. Soil properties, including colour, texture, structure, consistency, drainage condition, and horizon characteristics, were described and recorded. The geographic coordinates of each sampling point were obtained using a handheld GPS to support geospatial mapping and spatial analysis in a GIS environment.
2.5. Soil Morphological Properties and Laboratory Analysis
The soil morphological properties assessed include basic parameters that describe the soil’s physical characteristics and determine its suitability for various uses. Soil colour was determined using the Munsell Soil Colour Chart, which provides a standardised method for identifying soil hue, value, and chroma. Soil texture was analysed to estimate the relative proportions of sand, silt, and clay. The soil structure was evaluated based on the arrangement of soil particles and pore spaces, which influence aeration, water movement, and root penetration. Additional field observations included soil drainage conditions and consistency, all of which contribute to understanding soil behaviour and land suitability.
Soil samples collected from designated sampling points were air-dried and oven-dried at 105°C for 24 hours to remove moisture. The dried samples were gently disaggregated using a pestle and mortar and sieved through a 2 mm mesh to obtain the fine fraction (<2 mm), which was used for laboratory analyses.
Bulk density was determined from undisturbed core samples collected using a cylindrical core sampler, following ISO 11272: 2017 standards for dry bulk density determination. Soil pH was measured in accordance with ISO 10390: 2021, which specifies standard procedures for determining soil reaction in water or salt solutions .
Soil colour was further verified in the laboratory by matching moist soil samples with standard colour chips from the Munsell Soil Colour Chart to obtain corresponding hue, value, and chroma codes. Soil consistency was determined using the Atterberg limits in accordance with , which specifies procedures for determining the liquid limit, plastic limit, and plasticity characteristics of fine-grained soils.
Other soil morphological characteristics, including textural class, structure, and drainage, were described in accordance with FAO and the World Reference Base for Soil Resources (WRB) system . These standardised procedures ensured consistency, comparability, and reliability of the soil data generated for analysis.
2.6. Image Processing and Analysis
Satellite imagery was processed using ArcGIS 10.8 for preprocessing, spatial analysis, and extraction of relevant spatial information. GIS provides a framework for the visualization, management, manipulation, and spatial analysis of geospatial datasets .
2.6.1. Pre-processing
In the pre-processing stage, several steps were undertaken to enhance the data's quality and suitability for subsequent analysis. Radiometric and atmospheric corrections were first applied to ensure the images accurately reflect true surface conditions by minimising distortions from atmospheric interference and sensor inaccuracies. Similarly, layer stacking of spectral bands was also performed. This involves combining multiple bands into a single composite image to support more comprehensive analysis. In addition, image subsetting was performed to extract the study area, thereby enabling a more focused examination of the area of interest. This collectively facilitates data preparation and ensures the reliability of subsequent analytical results.
2.6.2. Derivation of Spectral Indices
Spectral indices are ratios derived from multispectral imagery that enhance the detection of specific Earth surface features and support the analysis of vegetation, soil, and water characteristics . The derived indices for this study include:
(i). Normalized Difference Vegetation Index (NDVI)
The Normalized Difference Vegetation Index (NDVI) is a spectral index used to assess vegetation vigour and distinguish vegetated areas from non-vegetated surfaces based on the difference between near-infrared and red reflectance values . In this study, NDVI was computed to distinguish vegetated areas from bare soil surfaces by using the following formula:
NDVI=(NIR−Red)/(NIR+Red)(1)
NDVI=NIR-RedNIR+Red
(ii). Bare Soil Index (BSI)
The Bare Soil Index (BSI) is a remote sensing spectral index designed to identify and differentiate bare soil from vegetation and other land cover types . It uses a combination of visible, near-infrared (NIR), and shortwave infrared (SWIR) bands, making it especially useful for monitoring soil exposure in agricultural and environmental studies. BSI Formula:
BSI=(SWIR+Red) −(NIR+Blue)/(SWIR+Red) +(NIR+Blue)(2)
(iii). Soil Moisture Index (SMI) / Normalized Difference Moisture Index (NDMI)
The Normalized Difference Moisture Index (NDMI), also referred to as the Soil Moisture Index (SMI) in some applications, is a remote sensing spectral index used to estimate vegetation and soil moisture content by utilising the difference between near-infrared (NIR) and shortwave infrared (SWIR) reflectance . It provides essential information on soil moisture conditions, which significantly influence soil structure, consistency, and other physical properties:
NDMI=(NIR-SWIR)/(NIR+SWIR)(3)
Therefore, integrating these spectral indices with field observations and laboratory analyses enhances the accuracy and reliability of soil morphological mapping. Filtering of the Bare Soil Index (BSI), Normalized Difference Moisture Index (NDMI), and Normalized Difference Water Index (NDWI) rasters was performed after computing the indices to reduce noise, smooth pixel-level variations, and enhance spatial interpretability.
2.7. Integration of Field and Remote Sensing Data
The integration of field soil data with satellite-derived indices was performed by overlaying sampling points onto raster datasets, thereby enabling the extraction and analysis of spectral values at each location. Studies have shown that integrating ground-based observations with remote sensing techniques enhances the accuracy and reliability of soil characterization. However, Field-measured soil data and remotely sensed environmental variables were integrated into a single dataset in line with the digital soil mapping framework, which combines field observations with environmental covariates to predict soil properties . Raster values corresponding to each soil sampling point were extracted in ArcGIS using the Extract Multi Values to Points tool . The resulting attribute table was exported as a CSV dataset and used for regression analysis. Ordinary Least Squares (OLS) regression was applied to evaluate the predictive relationship between soil pH and the selected explanatory variables . In contrast, soil consistency and structure, being qualitative properties that largely depend on field observations and laboratory assessments, were evaluated through field investigations and integrated with remotely sensed and terrain-derived variables for spatial interpretation .
2.8. Data Integration and Analysis
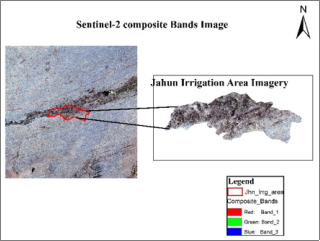
The datasets obtained from field measurements, laboratory analyses, Sentinel-2 imagery (Figure 2), and other ancillary sources are integrated within a GIS environment. The integrated datasets are analyzed using data management tools, spatial analysis tools, statistical techniques, and remote sensing techniques to examine spatial variability, assess relationships among variables, and support informed interpretation of the study findings.
Figure 2. Sentinel-2 composite image used to extract the study area.
3. Results and Discussion
The results presented in Table 1, along with their discussion, offer a detailed analysis and interpretation of the study area’s findings. These insights can support informed decision-making, improve agricultural practices, and enhance land management strategies within the area.
3.1. Soil Morphological Properties
Soil morphological and physical properties such as pH, bulk density, structure, moisture content, consistency, drainage, and soil texture (Table 1) are essential indicators of soil condition. Satellite remote sensing data, particularly from Sentinel-2 imagery, were used in this study to assess and spatially map various soil morphological properties. This was accomplished using selected spectral indices, namely the Soil Index (SI), Bare Soil Index (BSI), and Normalized Difference Moisture Index (NDMI). These indices facilitate the analysis of soil and moisture characteristics, enhancing our understanding of land surface conditions and enabling more effective environmental monitoring and management.
Table 1. Morphological Properties of Soils in the Study Area.

S/N

Sampling site

Horizon depth (cm)

pH

Bulk Density (g/cm3)

Colour

Moisture Content (%)

Structure

Consistency

Drainage

Boundary

1

Gurunguwa

0-30

6.5

1.18

7.5YR7/3 Pink

1.14

Loose

Slightly sticky

Well drained

Diffused

2

Markewa

0-30

5

1.15

7.5YR4/4 Brown

1.82

Loose

Slightly sticky - firm

Well drained

Clear

3

Harbo Tsohowa

0-30

5.5

1.14

7.5YR5/4 Brown

1.21

Friable

Slightly sticky

Well drained

Clear

4

Harbo Sabuwa

0-30

7

1.15

7.5YR2.5/3 Very Dark Brown

1.98

Friable

Low plasticity

Slightly drained

Clear

5

Jahun Town (Outskirts)

0-30

6

1.4

7.5YR6/6 Reddish Yellow

2.01

Loose

Slightly sticky

Well drained

Clear

6

Dudurum Gaya

0-30

6.5

1.12

7.5YR6/6 Reddish Yellow

0.68

Loose

Slightly sticky

Well drained

Clear

7

Maiyadiya

0-30

6

1.12

7.5YR7/8 Reddish Yellow

1.64

Loose

Low plasticity

Well drained

Clear

8

Yalleman

0-30

5

1.15

7.5YR6/6 Reddish Yellow

2.11

Loose

Slightly sticky - firm

Poor drained

Gradual

9

Darai

0-30

6.5

1.11

7.5YR6/7 Brownish-Red

2.15

Loose

Slightly sticky - firm

Well drained

Gradual

10

Gunka

0-30

5.5

1.08

7.5YR 5/4 Brown

1.82

Loose

Slightly plastic

Well drained

Diffused

However, properties such as soil pH, bulk density, structure, and consistency are not directly measurable through remote sensing. These parameters typically require field sampling and laboratory analysis. Their spatial distribution can, however, be estimated and mapped using statistical or geospatial modelling techniques that integrate ground-truth data with remote sensing-derived variables.
3.1.1. Soil Texture
The study identifies the most effective combination of Sentinel-2 inputs for soil texture mapping, including the Bare Soil Index (BSI), Band 11 (B11), Band 12 (B12), the Normalized Difference Moisture Index (NDMI), and a Digital Elevation Model (DEM). The Bare Soil Index (BSI) is primarily used to identify and mask bare soil pixels by enhancing the contrast between bare soil and other land cover types such as vegetation and built-up areas. The Normalized Difference Moisture Index (NDMI) is primarily used to detect and monitor moisture content in vegetation and soils by contrasting the near-infrared (NIR) and shortwave infrared (SWIR) bands . However, BSI alone is insufficient to distinguish between different soil textures. To improve soil characterization, the Short-Wave Infrared (SWIR) bands (Band 11 and Band 12 in Sentinel-2) and NDMI are analyzed, as they are sensitive to soil moisture content, mineral composition, and surface roughness. Incorporating slope and elevation (DEM) into analyses is beneficial, as texture frequently correlates with topographical features. These properties influence reflectance differently across sandy, loamy, and clayey soils. The integration of the Bare Soil Index (BSI) for soil exposure detection with shortwave infrared (SWIR) analysis enhances the ability to infer variations in soil texture .
The descriptive analysis of soil textural classes in the study was conducted by calculating the area (in hectares) covered by each respective soil class. The comparison of the two Tables 2 & 3 reveals a strong level of consistency between the soil texture classes derived from remote sensing and those obtained through field-based laboratory analysis, demonstrating that the classification approach is generally reliable.
Table 2. Soil Texture Classification Derived from Remote Sensing Data.

S/N

Sampling site

Textural Class

Area_ha

Percent (%)

1

Gurunguwa, Gunka

Loamy sand

1008.17

4.16

2

Markewa, Harbo Sabuwa

Sandy clay

5166.33

21.33

3

Harbo Tsohowa, Maiyadiya

Loam

651.99

2.69

4

Jahun Town (Outskirts)

Sandy loam

7175.36

29.62

5

Dudurum Gaya

Silt Loam

4824.43

19.92

6

Yalleman

Clay loam

3188.32

13.16

7

Darai

Sandy clay loam

2209.26

9.12

Table 3. Field-Based Soil Texture Classification Results.

S/N

Sampling site

Sand (%)

Silt (%)

Clay (%)

Textural Class

1

Gurunguwa

82.5

17.5

8.4

loamy sand

2

Markewa

54

3

43

sandy clay

3

Harbo Tsohowa

45.7

33.3

20

loam

4

Harbo Sabuwa

56.6

3.1

40.3

sandy clay

5

Jahun Town (Outskirts)

67

15

18

Sandy loam

6

Dudurum Gaya

18

72

10

Silt Loam

7

Maiyadiya

50

41.6

8.4

Loam

8

Yalleman

33

31

36

clay loam

9

Darai

58

15

27

Sandy clay loam

10

Gunka

86

4

10

Loamy sand

According to Table 2 (Remote Sensing Results), sandy loam (29.62%) and sandy clay (21.33%) are the dominant soil types in the study area, followed by silt loam (19.92%) and clay loam (13.16%). Less extensive classes include sandy clay loam (9.12%), loamy sand (4.16%), and loam (2.69%). Generally, this distribution indicates that moderately coarse to medium-textured soils are the most prevalent across the study area.
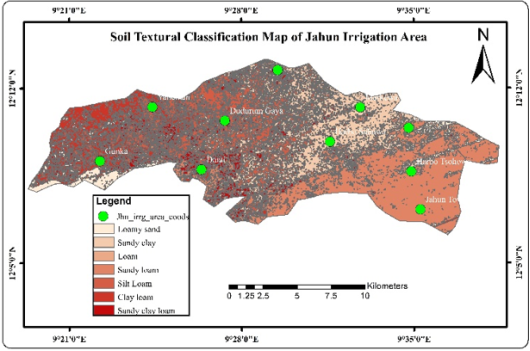
The analysis of the sampling locations reveals a strong correlation with the field data, soil type classifications, and the soil textural map outline (Figure 3). Specifically, Gurunguwa and Gunka are consistently identified as loamy sand across both datasets. Similarly, Markewa and Harbo Sabuwa are classified as sandy clay in both instances. Furthermore, Jahun Town (Outskirts), Dudurum Gaya, Yalleman, and Darai exhibit exact matches in their classifications: sandy loam, silt loam, clay loam, and sandy clay loam, respectively. The consistency observed across the datasets highlights the reliability of the soil classification in the irrigation land areas.
However, a slight variation is observed in Harbo Tsohowa and Maiyadiya. Remote sensing groups them separately (loam at Maiyadiya), whereas field data indicate both locations fall within the loam class. This discrepancy may be due to spectral similarity between soil classes, mixed pixels, or spatial resolution limitations of the satellite imagery.
The analysis reveals a strong consistency between the two soil textural datasets, indicating that remote sensing techniques, when appropriately processed and validated, are effective in mapping soil textural classes. Consequently, the minor discrepancies observed emphasize the importance of field verification in improving classification accuracy and accounting for local variability.
Figure 3. Soil Textural Classification Map of the Study Area Derived from Composite Bands.
3.1.2. Soil Moisture
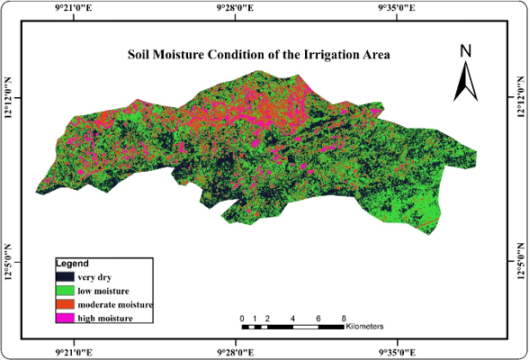
The results for the detection of soil moisture content in the farmland of the irrigation area were obtained through field soil sampling measurements and from the utilisation of the Normalized Difference Moisture Index (NDMI), which monitors vegetation water content and moisture levels, ranging from (-1) to (+1) through dividing the NIR and SWIR bands (i.e., B8 and B11 in Sentinel-2 data). The results present two complementary perspectives on soil moisture in the irrigation area: spatial patterns derived from NDMI (Figure 4) and point-based laboratory measurements (Table 1).
Figure 4. Soil Moisture Content in the Irrigation Area.
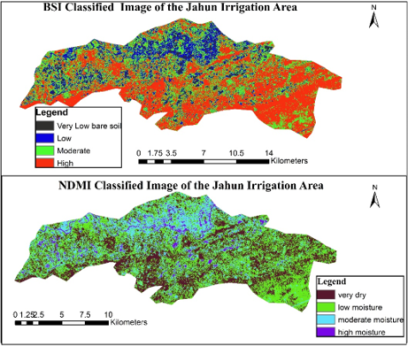
Table 4. Illustrating Soil Moisture Content Across the Irrigation Area Based on NDMI Classification.

S/N

Classes

Area_ha

%

1

very dry

7806.67

32.18

2

low moisture

10721.31

44.2

3

moderate moisture

4527.566

18.66

4

high moisture

1202.101

4.96

24257.65

100

NDMI classification (Table 4) indicates that the area is predominantly characterized by low-to-very-low soil moisture conditions. Specifically, about 76.38% of the total area (32.18% very dry + 44.20% low moisture) falls within moisture-deficient classes. Only a small portion, 23.62%, shows moderate to high moisture, and within that, just 4.96% is classified as high moisture. At the landscape scale, this suggests that the irrigation area is largely experiencing insufficient soil moisture, driven by the seasonal nature of the terrain, where moisture is more abundant during the rainy period, and potentially by inefficiencies in irrigation practices.
Looking at the laboratory results (Table 1), the measured soil moisture content ranges from 0.68% to 2.15%, which is generally low. Sites such as Dudurum Gaya (0.68%) exhibit very dry conditions, consistent with the NDMI “very dry” classification, whereas locations like Darai (2.15%) and Yalleman (2.11%) correspond more closely to relatively higher moisture zones. However, even the highest values remain modest, reinforcing the overall indication of limited soil moisture availability.
3.1.3. Comparative Interpretation of NDMI and BSI Results
The analysis comparing the Bare Soil Index (BSI) and the Normalized Difference Moisture Index (NDMI) (Figure 5) indicates a significant inverse relationship between the extent of bare soil and moisture content in the study area. The BSI results reveal that the high bare soil class occupies the largest area, totaling 11,690.30 hectares, which suggests a substantial presence of exposed surfaces with minimal vegetation. In alignment with this finding, the NDMI results indicate that the very dry and low-moisture classes are prevalent, covering 7,860.48 and 10,623.20 hectares, respectively.
Figure 5. BSI-NDMI Classified Images of Jahun Irrigation Area.
This correlation reinforces the presence of limited moisture conditions across the irrigation area and further emphasizes the impact of bare soil exposure on overall moisture levels.
Moderate classes in both indices also align reasonably well, with 8,033.24 ha under moderate bare soil and 4,556.32 ha under moderate moisture, indicating transitional zones where partial vegetation cover and soil moisture coexist. In contrast, areas with high moisture (1,220.24 ha) are relatively small and likely correspond to regions with dense vegetation or water presence, which is consistent with the very low bare soil area (1,106.32 ha) observed in the BSI output.
Generally, the results indicate that areas with high BSI values correspond to low NDMI values, implying that increased bare soil exposure is linked to reduced moisture availability. This relationship highlights the effectiveness of combining BSI and NDMI for integrated assessment of land surface conditions, particularly for monitoring and distinguishing moist farmland, dry bare soils, soil degradation, and vegetation cover.
3.1.4. Drainage Condition
The Normalized Difference Moisture Index (NDMI) and Digital Elevation Model (DEM) band combination were effectively utilized to assess drainage conditions in the irrigation landscapes, where both soil moisture retention and terrain characteristics influence water movement.
The NDMI essentially indicates surface and near-surface moisture conditions, where high values represent wetter areas (often linked to poor drainage or waterlogging) and low values indicate drier conditions (associated with better drainage or moisture deficit) (USGS, n.d). While the DEM expresses the steepness of the slopes, which typically promotes faster drainage, it reveals water flow pathways, highlights zones where runoff accumulates, and can be further analyzed using the Topographic Wetness Index (TWI), where available .
Figure 6. Spatial Distribution of Drainage Conditions in the Jahun Irrigation Area.

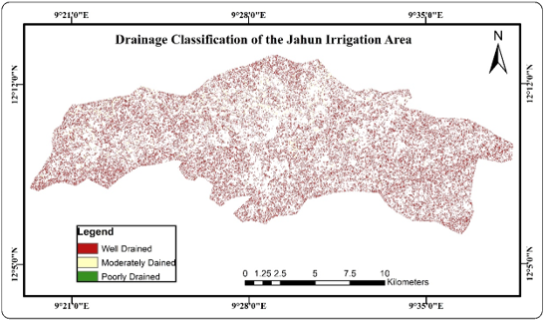
The integration of moisture-related parameters derived from a Digital Elevation Model (DEM), including slope, flow accumulation, topographic wetness index (TWI), and the satellite-based Normalized Difference Moisture Index (NDMI), within a Weighted Overlay Analysis in ArcGIS produced a comprehensive drainage condition map of the Jahun Irrigation Area. The resulting map reveals spatial variations in drainage conditions across approximately 5,561.95 hectares (Figure 6). The well-drained area occupies about 5,283.74 ha, approximately 94.99%. Morphologically, these soils permit effective downward water movement, minimizing prolonged saturation. The moderately drained area is 275.19 ha (i.e., about 4.95%). Such soils in this category may experience short-term saturation during irrigation or rainy periods. The poorly drained area has 3.02 ha, with only about 0.05%. The kind of soil in this category limits zones ' ability to retain water for extended periods, reducing aeration and increasing susceptibility to salinity buildup.
3.2. Predictive Modeling of Other Soil Morphological Properties
Additional soil morphological properties examined in this study, including pH, bulk density, structure, and consistency, are not directly measurable through remote sensing. These properties necessitate field observations and laboratory analyses for accurate assessment. To address this limitation, predictive modeling techniques have been utilized to estimate the spatial distribution of these soil characteristics. By integrating ground-truth soil measurements with remote sensing variables and terrain-derived parameters, predictive modeling provides a more comprehensive understanding of the spatial distribution and variability of soil characteristics across the irrigation area.
Table 5. Integrated Soil and Remote Sensing Variables Used for Predictive Modeling.

Sampling site

pH

Bulk Density (g/cm3)

Structure

Consistency

NDVI

NDMI

BSI

DEM

Slope

Gurunguwa

6.5

1.18

Loose

Slightly sticky

0.226354

-0.08

0.11

377.00

2.86

Markewa

5

1.15

Loose

Slightly sticky - firm

0.271296

-0.08

0.10

375.00

2.26

Harbo Tsohowa

5.5

1.14

Friable

Slightly sticky

0.139532

-0.12

0.15

373.00

3.65

Harbo Sabuwa

7

1.15

Friable

Low plasticity

0.132118

-0.12

0.14

374.00

0.00

Jahun Town (Outskirts)

6

1.4

Loose

Slightly sticky

0.128846

-0.16

0.18

378.00

2.86

Dudurum Gaya

6.5

1.12

Loose

Slightly sticky

0.203776

-0.09

0.12

377.00

1.43

Maiyadiya

6

1.12

Loose

Low plasticity

0.134786

-0.10

0.14

378.00

2.02

Yalleman

5

1.15

Loose

Slightly sticky - firm

0.174148

-0.08

0.11

378.00

0.00

Darai

6.5

1.11

Loose

Slightly sticky - firm

0.254566

-0.07

0.11

381.00

3.20

Gunka

5.5

1.08

Loose

Slightly plastic

0.158614

-0.10

0.14

383.00

3.65

3.2.1. Soil pH Prediction
The descriptive analysis of soil pH values from the sampled locations (Table 5) indicates that the values range from 5.0 to 7.0, signifying that the soils are generally slightly acidic to neutral. The most acidic conditions were observed at Markewa (pH 5.0) and Yalleman (pH 5.0), followed by Harbo Tsohowa (pH 5.5) and Gunka (pH 5.5). The soil pH pattern in the irrigation area indicates high acidity, which could affect nutrient availability and may require soil amendments, such as liming, to boost production.
Moreover, a statistical predictive analysis was conducted to examine the relationship between soil pH and selected remote sensing and terrain-derived variables in the study area.
The regression analysis conducted yielded an R2 value of 0.145, indicating that only 14.5% of the variation in soil pH was explained by the selected remote sensing and terrain variables. This result points to a weak predictive relationship between these explanatory variables and soil pH in the study area. Furthermore, the model's probability value (Prob > F = 0.975) suggests that it lacks statistical significance at the 95% confidence level, and none of the individual predictor variables showed a statistically significant effect on soil pH. The limited performance of the regression model may be attributed to the small sample size, with only 10 soil sampling points utilized in the analysis. This limitation may have constrained the model’s ability to explain the relationship between the variables and soil pH.
3.2.2. Bulk Density Prediction
Bulk density is an essential parametre in the morphological properties of soil that reflects the degree of compaction, porosity, and suitability for plant growth. Bulk density influences root penetration, water infiltration, aeration, and overall soil productivity . The data presented in Table 5 reveal the bulk density values across sampling sites in the irrigation area. The values ranged from 1.08 g/cm3 to 1.40 g/cm3, with an average value of approximately 1.16 g/cm3. This range indicates variations in soil bulk density among the different soil samples. Gunka exhibited the lowest bulk density value (1.08 g/cm3), followed closely by Darai (1.11 g/cm3), Dudurum Gaya (1.12 g/cm3), and Maiyadiya (1.12 g/cm3). Thus, the analysis indicates that lower values are indicative of well-structured soils, which possess greater porosity as prescribed by Soil Science Division Staff . At Jahun Town Outskirts, the soil has the highest bulk density (1.40 g/cm3), indicating that it is more compacted than the soils at the other sampling sites. Undoubtedly, a greater number of sampling sites, including Markewa, Harbo Sabuwa, Yalleman (1.15 g/cm3), and Harbo Tsohowa (1.14 g/cm3), recorded relatively moderate bulk density values, indicating favourable soil structure and adequate pore spaces for water infiltration and root penetration.
Bulk density prediction was performed using Ordinary Least Squares (OLS) regression. In the analysis, Bulk Density (BulkDen) was the dependent variable, while selected remote sensing and terrain-derived variables were used as explanatory variables. The model performance produced an R2 value of 0.744, indicating that approximately 74.4% of the variation in bulk density was explained by the selected predictor variables. This suggests a relatively strong relationship between bulk density and the environmental variables considered in the model. However, the overall regression model was not statistically significant at the 95% confidence level, as the Prob > F value (0.217) exceeded the standard significance threshold of 0.05. The lack of statistical significance may be attributed primarily to the limited number of sampling points used in the analysis, which may have reduced the model's predictive reliability.
3.2.3. Soil Consistency and Structure
In this study, soil consistency and structure were evaluated through both field observations and laboratory analyses, as these properties are qualitative in nature and largely influenced by factors that cannot be directly detected using remote sensing data. Therefore, conventional Ordinary Least Squares (OLS) regression is not appropriate for direct modeling of these properties. The work of supports the statement that OLS regression is inappropriate for directly modeling soil consistency and structure, since these properties are not purely quantitative.
The study's results (Table 5) indicate that a loose structural class is the predominant type across the sampling sites, comprising approximately 80% of the total spatial distribution. In contrast, only two sites, Harbo Tsohowa and Harbo Sabuwa, exhibited a friable structure, representing the remaining 20%.
In terms of soil consistency, slightly sticky soils are the most common class, found in 40% of sampling locations. Variability was observed, with a shift towards firm or low-plasticity soils. Notably, only the Gunka site displayed a slightly plastic consistency.
4. Conclusion
This study demonstrated the applicability of integrating Remote Sensing, Geographic Information Systems (GIS), and field-based soil survey techniques for assessment and mapping of soil morphological properties within the Habazaya Irrigation Area of Jahun Local Government Area, Jigawa State. The integration of Sentinel-2 imagery, terrain-derived variables, and ground-truth observations provided an effective framework for understanding the spatial variability of soil conditions across irrigated farmlands.
The findings revealed considerable variations in soil texture, moisture conditions, drainage characteristics, pH, bulk density, structure, and consistency within the study area. Sandy loam and sandy clay emerged as the dominant soil textural classes, with strong agreement observed between field observations and remotely sensed outputs. Moisture analysis indicated that a large proportion of the irrigation area experienced low and very low moisture conditions, while drainage assessment showed that most areas were well-drained.
The predictive modeling results showed that soil pH had weak relationships with remote sensing and terrain variables; bulk density demonstrated relatively stronger predictive potential, and both models lacked statistical significance due to the limited sample size. Furthermore, soil structure and consistency were found to be qualitative properties that required field observations and could only be interpreted indirectly using remotely sensed and environmental variables.
By and large, the study confirms that geospatial technologies can significantly support soil characterization and irrigation planning when integrated with field and laboratory measurements. However, field verification remains essential for improving the reliability and accuracy of predictive soil mapping.
5. Recommendations
The study provides several recommendations for enhancing soil property prediction. Firstly, increasing the density of soil sampling points is important for improving statistical reliability and strengthening the predictive power of spatial models. A higher sampling density ensures more representative data and reduces uncertainty in predictions.
Secondly, future research should integrate additional environmental variables, such as rainfall patterns, land use/land cover, organic matter content, and climatic conditions, as these factors strongly influence soil variability and can enhance model accuracy.
Finally, employing advanced machine learning techniques, including Random Forest, Support Vector Machine (SVM), and Artificial Neural Networks (ANN), is recommended to develop more robust and reliable predictions of soil properties. These methods can capture complex, nonlinear relationships among variables and often outperform traditional modeling approaches.
Abbreviations

ASTM

American Society for Testing and Materials

BSh

Hot semi-arid steppe climate

BSI

Bare Soil Index

CSV

Comm Separated Values

DEM

Digital Elevation Model

EMT

Environmental Management and Toxicology

GIS

Geographic Information System

GPS

Global Positioning System

ISO

International Organization for Standardization

LGA

Local Government Authority

NDMI

Normalized Difference Moisture Index

NDVI

Normalized Difference Vegetation Index

NDWI

Normalized Difference Water Index

ORCID

Open Researcher and Contributor Identifier

OLS

Ordinary Least Squares

pH

Potential Hydrogen

SWIR

Shortwave Infrared

TWI

Topographic Wetness Index

USGS

United States Geological Survey

WRB

World Reference Base for Soil Resources

Acknowledgments
The researchers sincerely extend their gratitude to the Copernicus Data Space Ecosystem, the primary portal through which the Sentinel-2 data used in this study were accessed. Special appreciation is also given to the individual who generously assisted in obtaining the soil samples, as well as to the dedicated technicians at the EMT laboratory whose invaluable support greatly contributed to the successful analysis of the samples.
Author Contributions
Abubakar Muazu: Conceptualization, Formal Analysis, Investigation, Methodology, Project administration, Resources, Software, Writing – original draft
Kabiru Shehu: Validation, Writing – review & editing
Sajida Rabiu: Investigation, Resources
Khadijah Zubairu Ibrahim: Visualization, Supervision, Writing – review & editing
Conflicts of Interest
The authors declare no conflicts of interest.
References
[1] Akbay Arama, Z., Akın, M. S., Dalyan, İ., & Nuray, S. E. (2020). Estimation of the consistency limits of fine-grained soils Via regression analysis: A special case for high and very high plastic clayey soils in Istanbul. International Advanced Research and Engineering Journal, vol. 4, no. 3, pp. 255-266.
[2] ASTM International. (2020). Standard test methods for liquid limit, plastic limit, and plasticity index of soils (ASTM D4318-20). pp. 3-4.
[3] Burrough, P. A., McDonnell, R. A., & Lloyd, C. D. (2015). Principles of Geographical Information Systems (3rd ed.). Oxford University Press. pp. 28-29.
[4] Chen, W., Liu, L., Zhang, C., Wang, J., Wang, J., & Pan, Y. (2004). Monitoring the seasonal bare soil areas in Beijing using Multi-temporal TM images. In Proceedings of the IEEE International Geoscience and Remote Sensing Symposium (IGARSS) (Vol. 5, pp. 3379-3382). IEEE.
[5] Stenberg, B., Viscarra Rossel, R. A., Mouazen, A. M., & Wetterlind, J. (2010). Visible and near-infrared spectroscopy in soil science. Advances in Agronomy, vol. 107, pp. 163–215.
[6] DIVA-GIS. (2025). The boundary shapefile of Jigawa State Local Government Area.
[7] Ebrahimi, A., Zolfaghari, F., Ghodsi, M., & Narmashiri, F. (2024). Assessing the accuracy of spectral indices obtained from Sentinel images using field research to estimate land degradation. PLOS ONE, vol. 19, no. 7, art. e0305758.
[8] NASA JPL. (2013). NASA Shuttle Radar Topography Mission Global 1 arc second number digital elevation model (SRTMGL1) [Data set]. NASA Jet Propulsion Laboratory.
[9] Esri. (2024). Extract Multi Values to Points (Spatial Analyst) [ArcGIS Pro tool documentation]. Esri.
[10] European Space Agency (ESA). (2024). Sentinel-2 Level-1C imagery (7 February 2024) accessed via Copernicus Data Space Ecosystem Browser. Copernicus Programme.
[11] Food and Agriculture Organization of the United Nations. (2022). World reference base for soil resources 2022: International soil classification system for naming soils and creating legends for soil maps (4th ed.). pp. 233–234. FAO.
[12] Food and Agriculture Organization of the United Nations. (2021). The state of the world's land and water resources for food and agriculture – Systems at breaking point (SOLAW 2021). pp. 55-63. Rome: FAO.
[13] Food and Agriculture Organization of the United Nations. (2021). Guidelines for soil description (4th ed.). pp. 21-67.
[14] Food and Agriculture Organization (2015). Guidelines for Soil Description (4th ed.). FAO.
[15] Gao, B. C. (1996). NDWI-A Normalized Difference Water Index for Remote Sensing of Vegetation Liquid Water from Space. Remote Sensing of Environment, vol. 58, no. 3, pp. 257-266.
[16] Hartemink, A. E. (2006). Encyclopedia of soils in the environment (D. Hillel, J. L., Hatfield, D. S., Powlson, C., Rosenzweig, K. M., Scow, M. J., Singer, & Sparks, D. L., Eds. Geoderma, vol. 131, no. 3-4, pp. 507-509.
[17] International Organization for Standardization. (2021). Soil, treated biowaste and sludge—Determination of pH (ISO 10390: 2021).
[18] International Union of Soil Sciences (IUSS) Working Group WRB. (2022). World reference base for soil resources: International soil classification system for naming soils and creating legends for soil maps (4th ed., update 2022). International Union of Soil Sciences (IUSS). pp. 181-217.
[19] Jensen, J. R. (2007). Remote sensing of the environment: An Earth resource perspective (2nd ed.). Upper Saddle River, NJ: Pearson Prentice Hall. Pp. 358-364.
[20] Kutner, M. H., Nachtsheim, C. J., Neter, J., & Li, W. (2004). Applied Linear Statistical Models (5th ed.). pp. 14-15.
[21] Lal, R. (2015). Restoring soil quality to mitigate soil degradation. Sustainability, vol. 7, no. 5. pp. 5875-5895.
[22] Food and Agriculture Organization of the United Nations. (1985). Water quality for agriculture (FAO Irrigation and drainage paper 29, Rev. 1). FAO. FAO.
[23] Lardy, J. M., DeSutter, T. M., Daigh, A. L. M., Meehan, M. A., & Staricka, J. A. (2022). Effects of soil bulk density and Water content on penetration resistance. Agricultural & Environmental Letters, vol. 7, no. 2, e20096.
[24] Longley, P. A., Goodchild, M. F., Maguire, D. J., & Rhind, D. W. (2015). Geographic Information Science and Systems (4th ed.). Wiley. pp. 323-326.
[25] Elevation City. (2024). Elevation of Jahun, Jigawa State, Nigeria.
[26] Mansyur, N. I., Hanudin, E., Purwanto, B. H., & Utami, S. N. H. (2019). Morphological characteristics and classification of soils formed from acidic sedimentary rocks in North Kalimantan. IOP Conference Series: Earth and Environmental Science, vol. 393, no. 1, 012083.
[27] McBratney, A. B., Mendonça Santos, M. L., & Minasny, B. (2003). On digital soil mapping. Geoderma, vol. 117, no. 1-2, pp. 3-52.
[28] Montanarella, L., Scholes, R., & Brainich, A. (Eds.). (2018). The IPBES assessment report on land degradation and restoration. Secretariat of the Intergovernmental Science-Policy Platform on Biodiversity and Ecosystem Services. pp. XXIII-XXV.
[29] Mulder, V. L., de Bruin, S., Schaepman, M. E., & Mayr, T. R. (2011). The use of remote sensing in soil and terrain mapping— A review. Geoderma, vol. 162, no. 1-2, pp. 1-19.
[30] Nigerian Meteorological Agency (NiMet). (2024). Climate data records for northern Nigeria [Climate dataset]. Abuja, Nigeria: Nigerian Meteorological Agency.
[31] Nsor, M. E., & Ibanga, I. J. (2008). Morphological characteristics and classification of soils derived from diverse parent Materials in Central Cross River State, Nigeria. Global Journal of Pure and Applied Sciences, vol. 14, no. 3, pp. 271-277.
[32] Richards, J. A., & Jia, X. (2006). Remote sensing digital image analysis: An introduction (4th ed.). Berlin, Germany: Springer. pp. 75-76.
[33] Scull, P., Franklin, J., Chadwick, O. A., & McArthur, D. (2003). Predictive soil mapping: A review. Progress in Physical Geography, vol. 27, no. 2, pp. 171-197.
[34] Sharma, P., & Goyal, R. (2020). Influence of irrigation on soil properties and crop productivity. Journal of Soil Science and Plant Nutrition, vol. 20, no. 3, pp. 681-695.
[35] Soil Science Division Staff. 2017. Soil Survey Manual. C. Ditzler, K. Scheffe, and H. C. Monger (eds.). USDA Handbook 18. Government Publishing Office, Washington, D. C. pp. 145-228.
[36] Sørensen, R., & Seibert, J. (2007). Effects of DEM resolution on the calculation of topographical indices: TWI as a case study. Journal of Hydrology, vol. 347, no. 1, pp. 79-89.
[37] Thenkabail, P. S., Lyon, J. G., & Huete, A. (Eds.). (2012). Hyperspectral remote sensing of vegetation. Boca Raton, FL: CRC Press/Taylor & Francis Group.
[38] European Space Agency. (n.d.). Sentinel-2 mission. European Space Agency.
[39] Fick, S. E., & Hijmans, R. J. (2017). WorldClim 2: New 1-km spatial resolution climate surfaces for global land are as. International Journal of Climatology, vol. 37, no. 12, pp. 4302–4315.
Cite This Article
  • APA Style

    Muazu, A., Shehu, K., Rabiu, S., Ibrahim, K. Z. (2026). Geospatial Mapping of Soil Morphological Properties in Irrigated Farmlands of Jahun LGA, Jigawa State, Nigeria. Engineering and Applied Sciences, 11(4), 141-154. https://doi.org/10.11648/j.eas.20261104.14

    Copy | Download

    ACS Style

    Muazu, A.; Shehu, K.; Rabiu, S.; Ibrahim, K. Z. Geospatial Mapping of Soil Morphological Properties in Irrigated Farmlands of Jahun LGA, Jigawa State, Nigeria. Eng. Appl. Sci. 2026, 11(4), 141-154. doi: 10.11648/j.eas.20261104.14

    Copy | Download

    AMA Style

    Muazu A, Shehu K, Rabiu S, Ibrahim KZ. Geospatial Mapping of Soil Morphological Properties in Irrigated Farmlands of Jahun LGA, Jigawa State, Nigeria. Eng Appl Sci. 2026;11(4):141-154. doi: 10.11648/j.eas.20261104.14

    Copy | Download

  • @article{10.11648/j.eas.20261104.14,
      author = {Abubakar Muazu and Kabiru Shehu and Sajida Rabiu and Khadijah Zubairu Ibrahim},
      title = {Geospatial Mapping of Soil Morphological Properties in Irrigated Farmlands of Jahun LGA, Jigawa State, Nigeria},
      journal = {Engineering and Applied Sciences},
      volume = {11},
      number = {4},
      pages = {141-154},
      doi = {10.11648/j.eas.20261104.14},
      url = {https://doi.org/10.11648/j.eas.20261104.14},
      eprint = {https://article.sciencepublishinggroup.com/pdf/10.11648.j.eas.20261104.14},
      abstract = {Soil morphological properties are important indicators of soil health, agricultural productivity, and sustainable land management. In semi-arid regions such as northern Nigeria, these properties are influenced by climatic conditions, irrigation practices, and land-use activities, affecting soil quality and crop performance. This study employed an integrated geospatial approach to assess and map soil morphological properties within irrigated farmlands of the Habazaya Irrigation Area in Jahun Local Government Area, Jigawa State, Nigeria. Sentinel-2 imagery, Digital Elevation Model (DEM) data, Geographic Information Systems (GIS), and field-based soil survey techniques were combined to examine spatial variability in soil conditions. Field sampling was conducted at 10 locations where soil samples were collected from 0-30 cm depth and analyzed for pH, bulk density, structure, consistency, and texture. Spectral indices, including the Bare Soil Index (BSI) and Normalized Difference Moisture Index (NDMI), were derived from Sentinel-2 imagery and integrated with field observations for spatial and statistical analysis. Ordinary Least Squares (OLS) regression was used to evaluate relationships between soil properties and remotely sensed variables. The findings revealed that sandy loam (29.62%) and sandy clay (21.33%) were the dominant soil textural classes. Approximately 76.38% of the study area exhibited low to very low moisture conditions, while 94.99% of the irrigation area was classified as well-drained. Soil pH ranged from 5.0 to 7.0, whereas bulk density ranged from 1.08 to 1.40 g/cm3. Predictive modeling showed weak performance for pH (R2 = 0.145) but stronger predictive potential for bulk density (R2 = 0.744). Loose soil structure dominated 80% of sampled locations, while slightly sticky consistency accounted for 40%. The study demonstrates the value of integrating remote sensing, GIS, and field observations for improved soil characterization and sustainable irrigation management.},
     year = {2026}
    }
    

    Copy | Download

  • TY  - JOUR
    T1  - Geospatial Mapping of Soil Morphological Properties in Irrigated Farmlands of Jahun LGA, Jigawa State, Nigeria
    AU  - Abubakar Muazu
    AU  - Kabiru Shehu
    AU  - Sajida Rabiu
    AU  - Khadijah Zubairu Ibrahim
    Y1  - 2026/08/24
    PY  - 2026
    N1  - https://doi.org/10.11648/j.eas.20261104.14
    DO  - 10.11648/j.eas.20261104.14
    T2  - Engineering and Applied Sciences
    JF  - Engineering and Applied Sciences
    JO  - Engineering and Applied Sciences
    SP  - 141
    EP  - 154
    PB  - Science Publishing Group
    SN  - 2575-1468
    UR  - https://doi.org/10.11648/j.eas.20261104.14
    AB  - Soil morphological properties are important indicators of soil health, agricultural productivity, and sustainable land management. In semi-arid regions such as northern Nigeria, these properties are influenced by climatic conditions, irrigation practices, and land-use activities, affecting soil quality and crop performance. This study employed an integrated geospatial approach to assess and map soil morphological properties within irrigated farmlands of the Habazaya Irrigation Area in Jahun Local Government Area, Jigawa State, Nigeria. Sentinel-2 imagery, Digital Elevation Model (DEM) data, Geographic Information Systems (GIS), and field-based soil survey techniques were combined to examine spatial variability in soil conditions. Field sampling was conducted at 10 locations where soil samples were collected from 0-30 cm depth and analyzed for pH, bulk density, structure, consistency, and texture. Spectral indices, including the Bare Soil Index (BSI) and Normalized Difference Moisture Index (NDMI), were derived from Sentinel-2 imagery and integrated with field observations for spatial and statistical analysis. Ordinary Least Squares (OLS) regression was used to evaluate relationships between soil properties and remotely sensed variables. The findings revealed that sandy loam (29.62%) and sandy clay (21.33%) were the dominant soil textural classes. Approximately 76.38% of the study area exhibited low to very low moisture conditions, while 94.99% of the irrigation area was classified as well-drained. Soil pH ranged from 5.0 to 7.0, whereas bulk density ranged from 1.08 to 1.40 g/cm3. Predictive modeling showed weak performance for pH (R2 = 0.145) but stronger predictive potential for bulk density (R2 = 0.744). Loose soil structure dominated 80% of sampled locations, while slightly sticky consistency accounted for 40%. The study demonstrates the value of integrating remote sensing, GIS, and field observations for improved soil characterization and sustainable irrigation management.
    VL  - 11
    IS  - 4
    ER  - 

    Copy | Download

Author Information
  • Abstract
  • Keywords
  • Document Sections

    1. 1. Introduction
    2. 2. Materials and Methods
    3. 3. Results and Discussion
    4. 4. Conclusion
    5. 5. Recommendations
    Show Full Outline
  • Abbreviations
  • Acknowledgments
  • Author Contributions
  • Conflicts of Interest
  • References
  • Cite This Article
  • Author Information