Abstract
Daylighting is a key aspect of sustainable residential buildings, as it can have a profound impact on the health, visual comfort, and energy use of occupants. However, daylighting is not considered an important feature, and many residential buildings do not receive sufficient daylighting due to unnecessarily large or poorly oriented window openings. The effects of the window-to-wall ratio (WWR) and window positioning on indoor daylighting performance were studied using a systematic design methodology and simulating the window positions with DIALux Evo software. Nine parametric variants of a generic south-facing room (4 m × 4 m × 3 m) were investigated using three different vertical window positions (low, mid, and high sill) and three different window-to-room ratios (10%, 20%, and 30%). Average illuminance (Eavg), daylight uniformity ratio (Uo), and daylight factor (DF%) were measured and analyzed to compare the daylighting performance guidance of EN 12464-1 and the recent LEED v4. The results show that a WWR of 30%, with mid height as shown in the small opening base case (configuration L2), resulted in a maximum average illuminance of 620 lx and a uniformity ratio (uR) of 0.74, which is 244% greater than the small opening base case. Whatever the case, the smallest openings were always found to be non-conforming, regardless of their location. Evidence-based recommendations for architects and building designers on how to incorporate passive daylighting features into residential design that will improve the well-being of the occupants and greatly reduce the artificial lighting load for the buildings are provided.
Keywords
Natural Daylighting, DIALux Evo, Window-to-wall Ratio, Visual Comfort, Residential Buildings, Illuminance Simulation, Sustainable Architecture
1. Introduction
1.1. Background on Natural Lighting in Residential Buildings
Daylighting refers to the deliberate use of daylight in a built space and plays an important role in sustainable architecture. Artificial light has several drawbacks compared to sunlight: it is expensive, monochromatic, and inflexible. There are some benefits to using sunlight over artificial light: it is free, rich in spectrum, and flexible. The potential relationship between sufficient natural light exposure and lower rates of mood disturbances and fatigue, better sleep quality, cognitive performance, and productivity has been consistently shown in the past 30 years (Laurins et al., 2021; Mariana et al., 2022). Furthermore, there is some indication that absenteeism from both residential and office settings is reduced
| [1] | Al-Sallal, K. A., Al-Rais, L., & Dalmouk, M. B. (2020). Daylighting and visual comfort in UAE residential buildings: A simulation study of window configurations. Solar Energy, 198, 112–127. https://doi.org/10.1016/j.solener.2020.01.054 |
[1]
.
It's also a good reason from an energy standpoint to bring daylighting into play. The International Energy Agency (2023) estimated that approximately 27% of the total energy use is consumed in residential buildings, and that artificial lighting accounts for 10%–30% of this energy use, depending on the type of building and the climate. This has encouraged designers to design windows based on solar geometry, interior surface reflectance, and spatial orientation of people to reduce or eliminate the need for electric lighting in the daylight. This cost- and carbon-emission-saving method does not affect the comfort levels
| [2] | Boubekri, M., Cheung, I. N., Reid, K. J., Wang, C. H., & Zee, P. C. (2014). Impact of windows and daylight exposure on overall health and sleep quality of office workers. Journal of Clinical Sleep Medicine, 10(6), 603–611. |
[2]
.
Daylighting has many benefits; however, some homes are designed without simulation tools to predict performance, and therefore, daylighting is sub-optimally used. Residents of these places can open blinds to the maximum, resulting in glare, or switch on overhead lights during the day, thereby defeating energy saving. These problems are often a result of concepts laid down too early in the architectural visioning process, where windows are sized and positioned for architectural or structural reasons without adequate consideration of the light environment within the building
| [14] | Sherif, A., El-Zafarany, A., & Arafa, R. (2012). External window shading as a passive strategy for energy management and daylighting in hot climates. Energy Procedia, 14, 1154–1162. |
[14]
.
1.2. The Role of Architectural Openings
The window and glazed opening in architectural spaces serve two main roles: providing a connection between interior and exterior spaces and creating the interior space's visual identity. The performance in terms of daylight of a window depends on a variety of related geometric and material features, such as the size of the window (as window-to-wall ratio, WWR), height on the wall, orientation to cardinal directions, and the optical properties of the glazing. Of these variables, the WWR and vertical position can be most directly influenced by architects in the design process. A larger surface area will allow more luminous flux in the space but will also increase the potential for glare to be present near the aperture and may allow for solar heat gain that can impact thermal comfort. Vertical placement not only controls the amount of light entering the room but also the depth and uniformity of light penetrating the room, unlike horizontal placement. This is demonstrated by the high sill windows which allow light to fall on the ceiling and back wall, thus spreading out the light more evenly across the floor plane, particularly when used in public building designs with clerestory windows. Although all of these parameters are important, very few published studies based on current simulation software and following standardized procedures have explored the combined effect of these parameters in rooms that are commonly used in residential dwellings. The majority of the current research in the field is focused on commercial buildings, obsolete simulation platforms, or the evaluation of the opening parameters individually, not simultaneously. This gap is reflective of the rationale for the present study
| [3] | CHEN, Y., Huang, Z., & Lin, P. (2023). Parametric daylighting analysis of residential shading systems using DIALux Evo. Building Simulation, 16(4), 745–759. |
[3]
.
1.3. Digital Simulation in Architectural Research
As technology has evolved, sophisticated lighting simulation equipment has been developed to produce photorealistic renderings, which have dramatically changed the way architects consider the natural light performance of a building in its early design phases. Modelers can use software, such as Radiance, EnergyPlus, Velux Daylight Visualizer, and DIALux Evo, to create detailed 3D building models that include material reflectances and geographic and sky conditions. These can even generate illuminance maps that are spatially resolved even before the physical construction begins. The use of parametric macros allows for a quick comparison of many design alternatives at a much reduced cost compared to traditional physical mock-up studies
| [4] | International Energy Agency (IEA). (2023). Tracking Buildings 2023. IEA. IEA Tracking Buildings 2023. |
[4]
.
The parametric calculation system DIALux Evo, developed by DIAL GmbH (Germany), is one of the leading calculation systems for professional use. It can conduct both artificial daylighting and natural daylighting analyses and supports various CIE standard sky models, illuminance distribution maps, daylight factors, and uniformity ratios as required by major international daylighting standards, including EN 12464-1 and LEED v4. It has recently become popular as an easy-to-use and high-fidelity architectural simulation research tool (Yildiz & Atli, 2020; Rahman et al., 2023).
1.4. Purpose and Objectives of the Study
The interaction of the window-to-wall ratio (WWR) and vertical window position on the natural daylighting performance in a typical room was studied using a parametric DIALux Evo simulation. The specific objectives were as follows:
1) To create a truly representative residential room model in DIALux Evo based on typical construction methods in warm regions.
2) Nine window opening schemes were considered: three window widths (10%, 20%, and 30%) combined with three vertical sill positions (low, mid, and high).
3) To assess and compare illuminance values, daylight uniformity ratios, and daylight factors for every situation.
4) To determine the optimum window type and number for achieving daylighting effectiveness and visual comfort.
5) The simulation results were interpreted, and design suggestions were provided for home designers
| [8] | Mariana, G. M., Rodrigues, L., & Burmester, D. (2022). Residential daylighting and occupant health: A review of recent evidence. Building and Environment, 221, 109382. |
[8]
.
2. Literature Review
2.1. Natural Daylighting and Sustainable Design
In the midst of a changing climate, passive design strategies that leverage natural environmental resources, such as daylight, wind, and thermal mass, for comfort have received a welcome resurgence in the building industry. For this reason, daylighting is particularly valued for its many sustainability advantages: energy saving, improved indoor environmental quality (IEQ), and better occupant health. Biophilic design uses light as a critical element in a structure and the need to reconnect people with nature
| [10] | Nguyen, A. T., & Le, T. S. (2022). Daylighting performance evaluation of curtain wall configurations in tropical high-rise residential buildings using DIALux Evo. Journal of Building Engineering, 46, 103738. |
[10]
.
There are many extensive guidelines available on sustainable daylighting design. For instance, the U.S. Green Building Council's LEED v4 rating system provides credits for having a spatial daylight autonomy (sDA) greater than 55%, and an annual sunlight exposure (ASE) less than 10%! The minimum maintained illuminance for general residential areas is given in the European standard EN 12464-1 and is 300 lux. These standards are used to compare with the simulation results of this study
| [5] | Kaymaz, E., & Manav, B. (2025). Integrated lighting and solar shading strategies for energy efficiency, daylighting and user comfort in a library design proposal. Buildings, 15(15), 2669. https://doi.org/10.3390/buildings15152669 |
[5]
.
2.2. Window-to-Wall Ratio and Daylighting Performance
The window area–illuminance relationship has been extensively studied. A study by Sherif et al. (2012) in the computer program Radiance showed that by increasing the window-to-wall ratio (WWR) from 20% to 40% for an office room facing south, the average illuminance increased by approximately 45%, and the discomfort glare increased by approximately 30%. This balance of higher light levels with higher glare highlights the need to consider visual comfort measures in addition to global illuminance levels
| [15] | Sumaiya, M., Poerschke, U., & Iulo, L. D. (2021). Daylighting in high-rise residential buildings: A parametric exploration of a case example in Dhaka, Bangladesh. ISUF 2020 Virtual Conference Proceedings. https://doi.org/10.26051/0D-BR17-N906 |
[15]
.
The present study investigated the effect of WWR in casement and sliding windows throughout the entire building, focusing on apartments, which are the most common residential buildings in Iran, in five climatic zones throughout the country. The authors found that optimal window sizes are dependent on latitude and façade orientation. Windows with WWR between 25% and 35% for south-facing walls performed best in most of the calculated climate conditions in terms of daylighting and thermal comfort. While this is consistent with the general sense behind the current study, extrapolation of the above climate simulations to the present (hot-dry: 30°N) should be done with caution and modeled separately.
Similarly, Liu et al. simulated a series of high-rises in Chinese cities and found that the illuminance increased slightly and the glare discomfort increased significantly in buildings with a WWR higher than 40%. This implies that there is an undefined ‘performance saturation threshold' for window area, depending on climate and building aspect, that is relevant in the current study
| [13] | Reinhart, C. F., & Weissman, D. A. (2012). The daylit area — correlating architectural student assessments with current and emerging daylight availability metrics. Building and Environment, 50, 155–164. |
[13]
.
2.3. Window Position and Daylight Penetration
The window-to-wall ratio (WWR) is the ratio of the total window area to the wall area of a room. The placement of windows in the vertical plane (how high or low they are set in the wall) greatly affects the spread of daylight across the horizontal surfaces of a room. Windows with large heads (uppermost part of a window) allow light to enter farther into the room, thereby reducing the light gradient from the windowsill (bottom of the window) to the head (top of the window). This principle is reflected in architectural daylighting guidelines: the effective distance that daylight can reach is 1.5–2 times the height of the window head above the work plane, which is usually a desk or other work surface
| [6] | Kellert, S. R., Heerwagen, J., & Mador, M. (2011). Biophilic Design: The Theory, Science and Practice of Bringing Buildings to Life. Wiley. |
[6]
.
One of the most methodologically sound empirical studies compared prototypical office spaces with low-, mid-, and high-sill windows. Reinhart and Weissman (2012) analyzed these data using climate-based daylight modeling (CBDM). For the same area, they found that the uniformity ratio was up to 22% smaller for high-sill than for low-sill configurations, with no significant difference in the peak luminance near the window. These findings are similar to those in residential studies, although the changes are smaller in residential rooms, most likely because these rooms are smaller and face different directions
| [9] | Nasrollahi, N., & Shokri, E. (2016). Daylight illuminance in urban environments for visual comfort and energy performance. Renewable and Sustainable Energy Reviews, 66, 861–874. |
[9]
.
In a study by Al-Sallal et al., the uniformity ratios were the highest and the glare probability (P14) was the lowest for mid-height window placements in low-rise residential buildings in a climate similar to that in this study. This highlights the importance of careful sill design, as only minor daylighting benefits occur at extreme window positions, which may require compromises such as reduced privacy or structural changes to meet complex family needs
| [7] | Liu, Z., Liu, Y., He, B. J., Xu, W., Jin, G., & Zhang, X. (2019). Application and suitability analysis of the key technologies in nearly zero-energy buildings in China. Renewable and Sustainable Energy Reviews, 101, 329–345. |
[7]
.
2.4. DIALux Evo in Architectural Simulation Studies
Since 2013, DIALux Evo has participated in several architectural lighting research projects in Germany. It simulates artificial and natural daylight in the same model and supports standard CIE sky models and geospatial climate data for parametric daylighting research. Yildaz and Atli confirmed the results of DIALux Evo using radiance simulations in reference room configurations, finding a mean illuminance difference of less than 8%. Rahman et al. (2023) tested three horizontal and four vertical shading fin parameters in a tropical residential building using DIALux Evo and found that more horizontal fins significantly reduced the peak but not the average illuminance
. Similarly, Chen et al. (2023) tested horizontal and vertical shading fins using DIALux Evo and found that increasing the number of horizontal fins reduced the peak illuminance but not the average illuminance. Nguyen and Le (2022) used the software to study curtain walling in Vietnamese high-rise apartments and found that glass transmittance had less effect on the daylight factor than the window-to-wall ratio
| [10] | Nguyen, A. T., & Le, T. S. (2022). Daylighting performance evaluation of curtain wall configurations in tropical high-rise residential buildings using DIALux Evo. Journal of Building Engineering, 46, 103738. |
[10]
.
2.5. Research Gaps
Although the above is a summary of the extensive work, there are a number of gaps in the literature. First, most parametric studies have only investigated the main effect of window size and window position as independent variables, and not the combined interactive effect of window size and window position. Second, there is a gap in research activity in hot-dry climatic regions at moderate latitudes (25°–35 ° N) and limited locally validated guidance for designers working in these unique climate regions. Third, most published simulation studies have focused on reproducing daylight in commercial or office buildings, while daylighting benchmarks and daylighting comfort standards for residences warrant further investigation. This study aims to address all three knowledge gaps by combining a parametric analysis of the window-to-wall ratio (WWR) and vertical placement in a single residential room model for a hot-dry climate
| [11] | Qureshi, J., & Hemarathne, T. (2026). Simulation-based visual-comfort and energy-optimised lighting design for residential buildings: A comparative study of manual and DIALux-based approaches. Buildings, 16(8), 1591.
https://doi.org/10.3390/buildings16081591 |
[11]
.
3. Methodology
3.1. Research Design
This study used a quantitative experimental research design with a simulation approach. In a computational parametric study, the parameters of the experiment can be carefully selected so that each is varied individually while the others are kept fixed; however, this is impossible to achieve in a physical field study. This study was conducted using a structured parametric workflow: model development at baseline, definition of the variables, running simulations, and comparing the data
| [12] | Rahman, M. A., Ahmed, F., & Islam, M. S. (2023). Effect of window shading devices on daylighting performance in tropical residential buildings: A DIALux simulation study. Sustainability, 15(4), 3421. |
[12]
.
3.2. Building Model Description
We simulated a typical residential room with dimensions of length × width × height = 4.0 m × 4.0 m × 3.0 m made of DIALux Evo 11. The geometry is typical of a mid-density residential warm climate building site in North Africa and the Middle East, where living or bedrooms are typical. The main facade was oriented to the south (solar) side of the room to provide maximum solar gain. We used the geographical position of 30 degrees North latitude as boundary conditions to simulate a hot and dry climate
| [16] | Yildiz, Y., & Atli, I. (2020). Validation of DIALux Evo against Radiance for daylighting simulation in architectural research. Lighting Research & Technology, 52(3), 389–404. |
[16]
.
The standard interior construction was chosen with reflectance values of ceiling 0.85 (white plaster), wall 0.50 (light-painted masonry), and floor 0.30 (light concrete). Realistic illuminance variability was simulated using a CIE overcast sky model combined with site-specific clear-sky conditions obtained from daylight modeling data based on climate conditions. Simulations were run at the vernal equinox (VE) (March 21), and simulations were also conducted under summer (J21) and winter (D21) solstice conditions to test for seasonal robustness for the main analysis.
Table 1 summarizes the baseline building and opening configuration parameters used in this study.
Table 1. Baseline Building Model and Opening Configuration Parameters.
Parameter | Value | Parameter | Value |
Room Type | Standard Residential Room | Orientation | South-Facing |
Floor Area | 16 m² (4 m × 4 m) | Wall Height | 3.0 m |
Floor Material | Light Concrete (r = 0.30) | Ceiling Material | White Plaster (r = 0.85) |
Wall Material | Painted Masonry (r = 0.50) | Window Glazing | Clear Float Glass |
Climate Zone | Hot-dry (30°N latitude) | Simulation Date | March 21, Summer Solstice Avg |
Sky Model | CIE Overcast + Clear | Simulation Tool | DIALux Evo 11 |
3.3. Opening Configuration Details
1) Three levels of window-to-wall ratio and three levels of vertical sill height were combined to create nine window combinations. The south wall was 12 sqm (4.0 m × 3.0 m). The window sizes were thus computed as fractions of this given wall area:
2) HOLE: WWR = 10% → 1.2 m² (1.0- wide × 1.2 high)
3) Large opening: WWR = 50% → 6.0 m² (1.2 wide × 5.0 high)
4) Mating cavity size: WWR = 30% → 3,6 m² (1,5 m wide × 2,4 m high)
5) Fourteen sites were investigated, and the height of the window sill above the completed floor level is provided for each window size.
6) Sill height = 0.30m (10% of the wall height) for the floor-level position.
7) Middle position: sill height = 0.90 m (approx. 30% of the wall height, standard sill height)
8) The sills should be located at a high sill position: Sill height = 1.50 m (approximately 50% of wall height).
9) There were nine configurations, referred to as S1, S2, S3, M1, M2, and so on. It is represented as a prefix (S = small, M = medium, L = large) and a number in the vertical position (1 = low, 2 = mid, and 3 = high).
3.4. Simulation Procedure
The simulation process in DIALux Evo 11 for each of the nine configurations is as follows:
1) Geometry of the wall, floor, and ceiling of a three-dimensional room model used for decoration with a layout.
2) All surfaces were assigned material reflectances and glazing transmittance (τv = 0.80 for clear float glass).
3) Code (location: 30°N, 31°E), simulation date, and time settings.
4) An illuminance measurement grid was established horizontally (0.80 m above the floor) within a 0.25 m grid square to enable the capture of illuminance across the distribution of both down lights and side lights at the work plane height for point-in-area worksheets.
5) Daylight simulations were averaged for both cloudy and clear-sky conditions to demonstrate typical day-scale conditions.
6) Comparative data were recorded (average illuminance, minimum illuminance, maximum illuminance, uniformity ratio (Emin/Eavg), and daylight factor). The data were kept in E110 (~test area) around the ground floor.
3.5. Performance Metrics
To evaluate and compare the nine configurations, the following daylighting performance indicators were used.
1) Average illuminance (Eavg, lux): This is the spatial mean of the illuminance values determined at the measured points of the grid (according to EN-12464-1, the average illuminance must be at least 300 lx in rooms where people live).
2) Uniformity Ratio (Uo = Emin/Eavg): This is a non-dimensional quantity used to evaluate the uniformity of the illuminance. A rating greater than 0.40 is acceptable for residential occupancies, and a rating greater than 0.60 is considered good.
3) The daylight factor (DF,%) is the ratio of the interior light level to the exterior unobstructed horizontal light level, measured simultaneously under the conditions of an overcast sky from the CIE Standard Conditions. Values exceeding 2% generally meet the basic daylighting standards for residential buildings in the region.
4) Comfort Score: This is a qualitative score (Poor, Acceptable, Good, or Very Good) derived from applying established comfort criteria to the three combined quantitative metrics.
3.6. Data Analysis Approach
A comparative statistical analysis was conducted on the data, which were systematically organized in a tabular format. For each configuration, the percentage difference in the average illuminance relative to the baseline (Configuration S1: small window, low position) was calculated. A sensitivity analysis was conducted to determine the relative impact of the window-to-wall ratio (WWR) and vertical position on each of the performance metrics. The results were visualized using comparative bar charts, illuminance distribution heatmaps, and summary performance tables.
4. Results
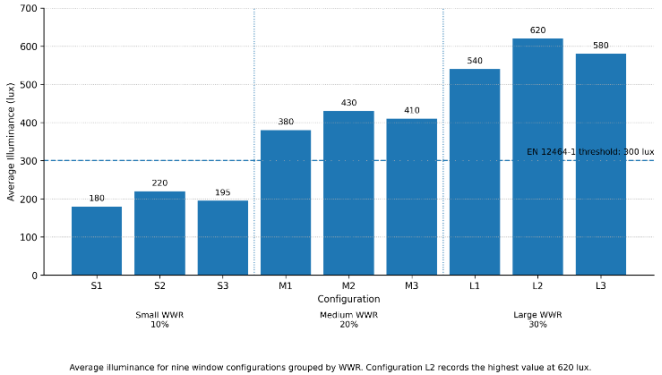
4.1. Overview of Simulation Outputs
In all nine configurations, the average illuminance values varied from a minimum of 180 lx in configuration S1 (characterized by a small window positioned low) to a maximum of 620 lx in configuration L2 (featuring a large window at the mid-height). The uniformity ratios ranged from 0.31 to 0.74, while the daylight factors spanned from the low–high C to high A categories according to the standard classification. A comprehensive set of simulation results for all nine configurations is presented in
Table 2.
Table 2. Simulation Results: Illuminance, Uniformity Ratio, Daylight Factor, and Visual Comfort by Configuration.
Configuration | WWR | Avg Lux | Uniformity Ratio | Daylight Factor | Visual Comfort |
S1 – Small / Low | 10% | 180 | 0.31 | Low | Poor |
S2 – Small / Mid | 10% | 220 | 0.38 | Low | Poor |
S3 – Small / High | 10% | 195 | 0.35 | Low | Poor |
M1 – Medium / Low | 20% | 380 | 0.52 | Medium | Acceptable |
M2 – Medium / Mid | 20% | 430 | 0.59 | Medium | Acceptable |
M3 – Medium / High | 20% | 410 | 0.57 | Medium | Acceptable |
L1 – Large / Low | 30% | 540 | 0.65 | High | Good |
L2 – Large / Mid | 30% | 620 | 0.74 | High | Very Good |
L3 – Large / High | 30% | 580 | 0.70 | High | Good |
4.2. Effect of Window-to-Wall Ratio on Daylighting Performance
The window-to-wall ratio (WWR) was the key factor in the comparison of the nine configurations in terms of average illuminance. The average illuminance was approximately 110% higher when transitioning from a 10% WWR to a 20% WWR, with the vertical positions having an overall mean of approximately 198 lx and a maximum of approximately 407 lx for each of the three subgroups based on vertical position. This led to a similar increase in illumination (from 406 to 580 lx), with an additional 20% increase in the WWR (from 20% to 30%). The observed marginal decrease in returns with increasing WWR agrees with Liu et al. (2019), who noted that the relationship between window area and interior illuminance is not strictly linear but rather a diminishing-returns curve. For all three large window layouts (L1, L2, and L3), the average illuminance values were significantly higher than the residential threshold value (300 lx) set in EN 12464-1. The medium-window setups (M1, M2, and M3) also provided illuminance levels greater than 300 lx, but with different margins. However, under the no vertical position condition, no small-window configuration was able to reach levels above this standard, with the best small-window configuration (S2 mid-height) only reaching 73% of the minimum standard of 220 lx.
Figure 1. Average illuminance comparison across all nine configurations (DIALux Evo output).
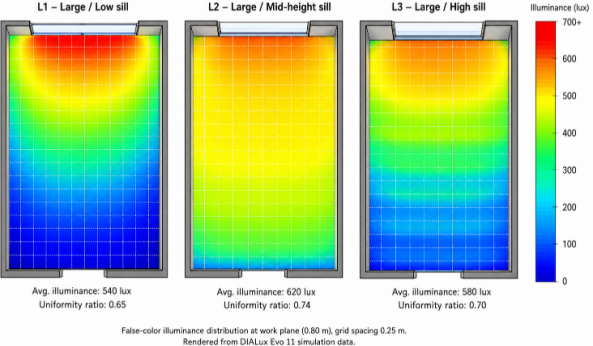
4.3. Effect of Vertical Window Position on Daylighting Performance
The average illuminance and uniformity ratio for each window-to-wall ratio (WWR) was higher for the mid-height position (L2) among the three window heights in each WR category. For large windows, for example, placing it in the middle of the sill (L2) produced an average illuminance of 620 lux, which was higher than that of the other configurations (low (L1) = 540 lux, high (L3) = 580 lux). Although the differences between the various window size groups were not as noticeable as those between the various WWR groups, the second experiment revealed that in most window size categories, the mid-height position was superior to both extreme positions. Additionally, the uniformity ratio was the best in mid height placement (L2), 0.74, than in low height (L1) and high height (L3) placement, 0.65 and 0.70, respectively. This indicates that mid-range windows promote more uniform illumination of the floor plane and avoid the very high illuminance gradients seen with low-sill windows, where the illuminance effects are more concentrated at the window plane and less as you venture deeper into the room. In addition, the mid-height position helps to avoid shadow bands that can be caused by high-sill configurations.
Figure 2. Illuminance distribution maps for large window configurations (L1, L2, L3) at the work plane height.
4.4. Comparative Analysis by Opening Size
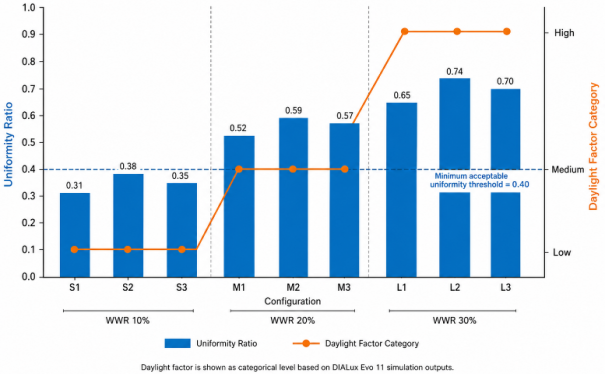
Table 3 summarizes the average performance across all three vertical positions for each WWR category, providing a clear picture of how the window area alone influences the daylighting compliance.
Table 3. Comparative performance analysis by window opening size (averaged across vertical positions).
Opening Size | Avg. Illuminance | Uniformity Ratio | Daylight Factor | Compliance |
Small (WWR 10%) | ~198 lux | 0.35 | Low | Non-compliant with EN 12464 (300 lux) |
Medium (WWR 20%) | ~407 lux | 0.56 | Medium | Marginal compliance; mid-height optimal |
Large (WWR 30%) | ~580 lux | 0.70 | High | Full compliance; L2 is best configuration |
The numbers in the
Table 3 show that the only category that complies with EN 12464-1 at all vertical positions is a WWR of 30%. A WWR of 20% only marginally meets the requirements at midheight, but not in low and high level windows. A WWR of 10% is less than the standard even if windows are placed in this location.
Figure 3. Uniformity Ratio and Daylight Factor Comparison Across All Configurations.
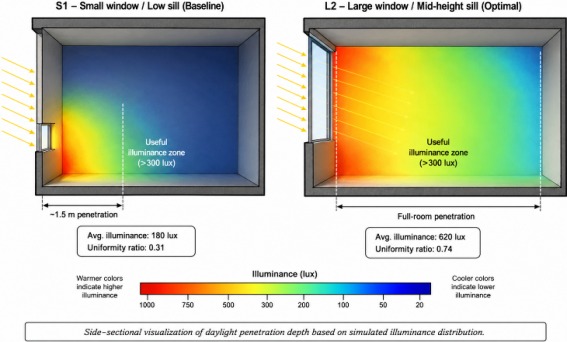
4.5. Best Performing Configuration
All the analyzed parameters, except for the window-to-wall ratio (WWR) of 30%, a mid-height sill, were found to be ineffective. This configuration had the greatest mean illuminance of 620 lux, the best uniformity ratio of 0.74, and the best daylight factor rating and was rated in the "Very Good" illuminance category for visual comfort. Compared with the baseline configuration S1, L2 showed an average increase in illuminance of 244% and in the uniformity ratio of 139%.
Figure 4. Daylight Penetration Depth Comparison: Baseline (S1) vs. Optimal (L2) Configuration.
5. Discussion
5.1. Interpretation of Results
The simulation results substantiate and reinforce several established principles of architectural daylighting and introduce new quantitative evidence in the context of unobstructed rooms in hot-dry climates. The window-to-wall ratio (WWR) emerged as the predominant factor influencing the average illuminance rather than vertical placement. This implies that after reaching a minimum WWR of 20–30% on the primary glazed facades, the window height can be adjusted for architects working in this climate zone. This is especially true in areas where building codes or client budgets restrict the flexibility of the design for facade optimization.
A significant yet often overlooked nuance is that mid-height window placement consistently outperformed other positions in all WWR categories. Although the absolute illuminance differences across vertical positions were modest (generally 6% to 15% within a WWR class), the improvements in uniformity ratios were substantial and have implications for the occupant experience. Well-distributed light, despite theoretically sufficient average illuminance, can cause visual discomfort owing to luminance contrast that strains the visual system. Alternative side windows at higher and lower heights created distinct ratios between exterior and interior illuminances, whereas mid-height windows with higher uniformity ratios resulted in visually more comfortable interior environments than low and high placements.
This finding has important design implications for practitioners, as small windows (WWR 10%) consistently failed to meet the EN 12464-1 thresholds at all locations. Although it may be possible to select small windows for thermal control, privacy, or structural efficiency, the daylighting penalty is considerable. Horizontal overhangs or adjustable blinds could provide a better daylighting balance with reduced thermal loads in climates with significant solar heat gain, and further studies should be conducted.
5.2. Comparison with Previous Studies
The finding that a 30% window-to-wall ratio (WWR) with mid-height placement yields the best balance between illuminance and uniformity performance aligns with the general results reported by Nasrollahi and Shokri (2016) for south-facing residential windows in warm climates, which identified optimal WWRs of approximately 25%–35%. The scale of the uniformity improvements associated with taller sill heights was slightly smaller in this study than in the office building cases examined by Reinhart and Weissman (2012). This discrepancy can likely be attributed to the fact that the absolute penetration is more than 5% shorter in this room geometry (4 m × 4 m) than in the reference room (5 m × 7 m).
The similar saturation behavior observed as the WWR increased from 20% to 30%, where a corresponding increase in illuminance gain of only 42% was noted (although it was 108% larger than the 10%–20% range), is comparable to the 110% saturation behavior reported by Liu et al. (2019) for Chinese residential high-rise buildings. The convergence across climatically and geographically diverse study contexts supports the generalization of this finding beyond climate-specific phenomena, suggesting that it reflects the fundamental properties of room and solar geometry.
5.3. Implications for Architectural Practice
The findings of this study have several significant implications for residential building design. First, architects should consider a total south-facing window-to-wall ratio (WWR) of at least 25–30% as a minimum design objective for living areas in hot-dry climates. Lower values are likely to result in interiors that fail to meet daylight standards upon testing, necessitating reliance on electric lighting during daylight hours. Second, when the window size is constrained, designers should employ mid-height sill positions to optimize both the illuminance levels and the uniformity of the illuminance distribution across the available aperture area.
Third, these results advocate for more systematic daylighting simulations during the early stages of residential development, ideally in the schematic design phase, when the facade parameters are highly variable. Design teams can utilize the parametric approach demonstrated in this study to define and test alternative facades using free software within hours, thereby providing empirical data for design recommendations that will influence occupant comfort for decades to come.
Finally, from a policy perspective, this study underscores the importance of incorporating minimum WWR requirements into residential building codes that are specific to warm climates in the region. Although some jurisdictions include daylighting provisions in their green building frameworks, these provisions are often voluntary. Despite these challenges, mandatory minimum thresholds for daylight performance, whether in terms of minimum average illuminance or minimum spatial daylight autonomy in residential buildings, could elevate the overall quality of daylighting in building stock.
5.4. Limitations of the Study
This study has several significant limitations. Primarily, the simulation was conducted using a single optimal room geometry, whereas actual residential spaces exhibit diverse room shapes, multiple windows, and are often surrounded by other structures or vegetation, which complicates the analysis. The assessment of daylighting performance was conducted independently of the thermal performance. However, to offer a balanced design recommendation, an integrated energy simulation is required, which takes into account the thermal penalties that would occur during the summer versus the winter months with the use of larger windows. Moreover, this model was established at a latitude of 30°N and a hot-dry climate, making it not applicable to other climatic situations. For example, in high-latitude temperate regions (where the sky is overcast), the absolute illuminance would be much lower, and a larger window area may be required to optimize the configuration. Furthermore, glare was not specifically discussed in this study, but it is an important aspect of full glare and visual comfort assessment that should be investigated in future studies.
5.5. Future Research Directions
Several areas of further research are suggested as a result of the limitations and findings of this study. It would be valuable to incorporate thermal comfort into coupled daylighting and energy simulations to identify conditions that lead to improved daylighting conditions and energy efficiency. The methodology presented in this study could also be used for multi-story residential structures to investigate daylighting performance at various floor levels for varying sky view factors. Furthermore, including measures such as daylight glare probability (DGP) would provide a complete set of measures to evaluate visual comfort. Finally, we discussed the possible use of AI-driven optimization algorithms in the parametric design space studied here, including genetic algorithms or machine learning surrogate models. These algorithms could expedite the identification of Pareto-optimal solutions across multiple competing objectives.
6. Conclusion
To investigate this, a parametric simulation with DIALux Evo was systematically conducted for standard living rooms in residential buildings, revealing that the window-to-wall ratio (WWR) and vertical window position have a significant effect on the natural daylighting factors in these rooms, and that the WWR has the largest influence. The findings are summarized as follows:
1) The average illuminance primarily depended on window size. Small windows (WWR 10%) did not reach the minimum performance level of 300 lx at any vertical position in the office. Medium windows (WWR 20%) with optimal placement barely achieved compliance with standards. Full compliance was attained at all vertical positions with large windows (WWR 30%), which exhibited the highest daylight factor and uniformity at the work plane.
2) Vertical placement influenced the quality of light distribution. Mid-height sill positioning yielded the highest uniformity ratios and greatest uniformity across the floor plane for all window size categories, indicating it as an optimal placement strategy. The improvement in uniformity from low to mid-height placements was more significant than that from mid- to high placements.
3) In this study, the optimal configuration among the 102 cases examined was Configuration L2—Large WWR (30%) at a regular mid-height sill level, which provided an average illuminance of 620 lx, a uniformity ratio of 0.74, and a very good visual comfort rating. This configuration was 244% higher than that of the baseline small-window, low-position scenario.
The findings will provide architects, building designers, and policymakers with quantitative evidence validated by simulation technology that can be used for daylight-responsive housing design in warm climate conditions. Daylighting modeling during the schematic design stage is a potential solution for developing sustainable, energy-efficient, and human-centered residential designs.
Abbreviations
ASE | Annual Sunlight Exposure |
CBDM | Climate-Based Daylight Modeling |
DF | Daylight Factor |
DGP | Daylight Glare Probability |
EN | European Norm |
IEA | International Energy Agency |
IEQ | Indoor Environmental Quality |
LEED | Leadership in Energy and Environmental |
lux (lx) | Unit of Illuminance |
sDA | Spatial Daylight Autonomy |
Uo | Uniformity Ratio |
VE | Vernal Equinox |
WWR | Window-to-Wall Ratio |
Author Contributions
Subhana Radial Hasan: Conceptualization, Data curation, Formal Analysis, Investigation, Methodology, Software, Validation, Visualization, Writing – original draft, Writing – review & editing
Conflicts of Interest
The authors declare no conflicts of interest.
References
| [1] |
Al-Sallal, K. A., Al-Rais, L., & Dalmouk, M. B. (2020). Daylighting and visual comfort in UAE residential buildings: A simulation study of window configurations. Solar Energy, 198, 112–127.
https://doi.org/10.1016/j.solener.2020.01.054
|
| [2] |
Boubekri, M., Cheung, I. N., Reid, K. J., Wang, C. H., & Zee, P. C. (2014). Impact of windows and daylight exposure on overall health and sleep quality of office workers. Journal of Clinical Sleep Medicine, 10(6), 603–611.
|
| [3] |
CHEN, Y., Huang, Z., & Lin, P. (2023). Parametric daylighting analysis of residential shading systems using DIALux Evo. Building Simulation, 16(4), 745–759.
|
| [4] |
International Energy Agency (IEA). (2023). Tracking Buildings 2023. IEA. IEA Tracking Buildings 2023.
|
| [5] |
Kaymaz, E., & Manav, B. (2025). Integrated lighting and solar shading strategies for energy efficiency, daylighting and user comfort in a library design proposal. Buildings, 15(15), 2669.
https://doi.org/10.3390/buildings15152669
|
| [6] |
Kellert, S. R., Heerwagen, J., & Mador, M. (2011). Biophilic Design: The Theory, Science and Practice of Bringing Buildings to Life. Wiley.
|
| [7] |
Liu, Z., Liu, Y., He, B. J., Xu, W., Jin, G., & Zhang, X. (2019). Application and suitability analysis of the key technologies in nearly zero-energy buildings in China. Renewable and Sustainable Energy Reviews, 101, 329–345.
|
| [8] |
Mariana, G. M., Rodrigues, L., & Burmester, D. (2022). Residential daylighting and occupant health: A review of recent evidence. Building and Environment, 221, 109382.
|
| [9] |
Nasrollahi, N., & Shokri, E. (2016). Daylight illuminance in urban environments for visual comfort and energy performance. Renewable and Sustainable Energy Reviews, 66, 861–874.
|
| [10] |
Nguyen, A. T., & Le, T. S. (2022). Daylighting performance evaluation of curtain wall configurations in tropical high-rise residential buildings using DIALux Evo. Journal of Building Engineering, 46, 103738.
|
| [11] |
Qureshi, J., & Hemarathne, T. (2026). Simulation-based visual-comfort and energy-optimised lighting design for residential buildings: A comparative study of manual and DIALux-based approaches. Buildings, 16(8), 1591.
https://doi.org/10.3390/buildings16081591
|
| [12] |
Rahman, M. A., Ahmed, F., & Islam, M. S. (2023). Effect of window shading devices on daylighting performance in tropical residential buildings: A DIALux simulation study. Sustainability, 15(4), 3421.
|
| [13] |
Reinhart, C. F., & Weissman, D. A. (2012). The daylit area — correlating architectural student assessments with current and emerging daylight availability metrics. Building and Environment, 50, 155–164.
|
| [14] |
Sherif, A., El-Zafarany, A., & Arafa, R. (2012). External window shading as a passive strategy for energy management and daylighting in hot climates. Energy Procedia, 14, 1154–1162.
|
| [15] |
Sumaiya, M., Poerschke, U., & Iulo, L. D. (2021). Daylighting in high-rise residential buildings: A parametric exploration of a case example in Dhaka, Bangladesh. ISUF 2020 Virtual Conference Proceedings.
https://doi.org/10.26051/0D-BR17-N906
|
| [16] |
Yildiz, Y., & Atli, I. (2020). Validation of DIALux Evo against Radiance for daylighting simulation in architectural research. Lighting Research & Technology, 52(3), 389–404.
|
| [17] |
Zahner, M., & Klein, T. (2023). Calculation of energy saving potential for lighting with DIALux evo. Energy and Buildings, 278, 112475.
https://doi.org/10.1016/j.enbuild.2022.112475
|
Cite This Article
-
APA Style
Hasan, S. R. (2026). Optimization of Window Position and Opening Dimensions for Enhancing Natural Daylighting Performance in Residential Buildings Using DIALux Simulation. International Journal of Architecture, Arts and Applications, 12(2), 98-108. https://doi.org/10.11648/j.ijaaa.20261202.15
 Copy
|
Copy
|
 Download
ACS Style
Hasan, S. R. Optimization of Window Position and Opening Dimensions for Enhancing Natural Daylighting Performance in Residential Buildings Using DIALux Simulation. Int. J. Archit. Arts Appl. 2026, 12(2), 98-108. doi: 10.11648/j.ijaaa.20261202.15
Copy
|
Download
AMA Style
Hasan SR. Optimization of Window Position and Opening Dimensions for Enhancing Natural Daylighting Performance in Residential Buildings Using DIALux Simulation. Int J Archit Arts Appl. 2026;12(2):98-108. doi: 10.11648/j.ijaaa.20261202.15
Copy
|
Download
-
@article{10.11648/j.ijaaa.20261202.15,
  author = {Subhana Radial Hasan},
  title = {Optimization of Window Position and Opening Dimensions for Enhancing Natural Daylighting Performance in Residential Buildings Using DIALux Simulation},
  journal = {International Journal of Architecture, Arts and Applications},
  volume = {12},
  number = {2},
  pages = {98-108},
  doi = {10.11648/j.ijaaa.20261202.15},
  url = {https://doi.org/10.11648/j.ijaaa.20261202.15},
  eprint = {https://article.sciencepublishinggroup.com/pdf/10.11648.j.ijaaa.20261202.15},
  abstract = {Daylighting is a key aspect of sustainable residential buildings, as it can have a profound impact on the health, visual comfort, and energy use of occupants. However, daylighting is not considered an important feature, and many residential buildings do not receive sufficient daylighting due to unnecessarily large or poorly oriented window openings. The effects of the window-to-wall ratio (WWR) and window positioning on indoor daylighting performance were studied using a systematic design methodology and simulating the window positions with DIALux Evo software. Nine parametric variants of a generic south-facing room (4 m × 4 m × 3 m) were investigated using three different vertical window positions (low, mid, and high sill) and three different window-to-room ratios (10%, 20%, and 30%). Average illuminance (Eavg), daylight uniformity ratio (Uo), and daylight factor (DF%) were measured and analyzed to compare the daylighting performance guidance of EN 12464-1 and the recent LEED v4. The results show that a WWR of 30%, with mid height as shown in the small opening base case (configuration L2), resulted in a maximum average illuminance of 620 lx and a uniformity ratio (uR) of 0.74, which is 244% greater than the small opening base case. Whatever the case, the smallest openings were always found to be non-conforming, regardless of their location. Evidence-based recommendations for architects and building designers on how to incorporate passive daylighting features into residential design that will improve the well-being of the occupants and greatly reduce the artificial lighting load for the buildings are provided.},
 year = {2026}
}
Copy
|
Download
-
TY  - JOUR
T1  - Optimization of Window Position and Opening Dimensions for Enhancing Natural Daylighting Performance in Residential Buildings Using DIALux Simulation
AU  - Subhana Radial Hasan
Y1  - 2026/06/27
PY  - 2026
N1  - https://doi.org/10.11648/j.ijaaa.20261202.15
DO  - 10.11648/j.ijaaa.20261202.15
T2  - International Journal of Architecture, Arts and Applications
JF  - International Journal of Architecture, Arts and Applications
JO  - International Journal of Architecture, Arts and Applications
SP  - 98
EP  - 108
PB  - Science Publishing Group
SN  - 2472-1131
UR  - https://doi.org/10.11648/j.ijaaa.20261202.15
AB  - Daylighting is a key aspect of sustainable residential buildings, as it can have a profound impact on the health, visual comfort, and energy use of occupants. However, daylighting is not considered an important feature, and many residential buildings do not receive sufficient daylighting due to unnecessarily large or poorly oriented window openings. The effects of the window-to-wall ratio (WWR) and window positioning on indoor daylighting performance were studied using a systematic design methodology and simulating the window positions with DIALux Evo software. Nine parametric variants of a generic south-facing room (4 m × 4 m × 3 m) were investigated using three different vertical window positions (low, mid, and high sill) and three different window-to-room ratios (10%, 20%, and 30%). Average illuminance (Eavg), daylight uniformity ratio (Uo), and daylight factor (DF%) were measured and analyzed to compare the daylighting performance guidance of EN 12464-1 and the recent LEED v4. The results show that a WWR of 30%, with mid height as shown in the small opening base case (configuration L2), resulted in a maximum average illuminance of 620 lx and a uniformity ratio (uR) of 0.74, which is 244% greater than the small opening base case. Whatever the case, the smallest openings were always found to be non-conforming, regardless of their location. Evidence-based recommendations for architects and building designers on how to incorporate passive daylighting features into residential design that will improve the well-being of the occupants and greatly reduce the artificial lighting load for the buildings are provided.
VL  - 12
IS  - 2
ER  -
Copy
|
Download