Biostimulants have been extensively studied in horticultural and high-value crops, particularly in developed countries. However, their application in low-value broad-acre crops under diverse hill agro-ecosystems investigations are limited, especially in developing countries dominated by smallholder farming systems. This study evaluated three biostimulant formulations—seaweed extract + vitamin, seaweed extract + humic and fulvic acids, and protein hydrolysate + humic acids—in soybean across three western Himalayan hill agro-climatic zones: Zone I (Akrot; sub-montane low-hill subtropical), Zone II (Palampur; mid-hill sub-humid), and Zone III (Awarna; high-hill temperate wet). Field experiments were conducted in a randomized block design with ten treatments and three replications. Growth and yield parameters were analysed through individual and pooled ANOVA, while treatment responses across environments were assessed using location × treatment interactions. Significant effects of both location and treatment (p < 0.01) were observed for all measured traits. Palampur was the most favourable environment, followed by Akrot, whereas Awarna imposed relatively constrained conditions. Among treatments, T6 showed the most consistent performance and recorded a 48.5% yield advantage over the control, while T9 and T3 performed statistically at par. The findings demonstrate the potential of biostimulants to enhance soybean productivity across diverse Himalayan hill agro-ecosystems.
| Published in | International Journal of Applied Agricultural Sciences (Volume 12, Issue 3) |
| DOI | 10.11648/j.ijaas.20261203.13 |
| Page(s) | 97-109 |
| Creative Commons |
This is an Open Access article, distributed under the terms of the Creative Commons Attribution 4.0 International License (http://creativecommons.org/licenses/by/4.0/), which permits unrestricted use, distribution and reproduction in any medium or format, provided the original work is properly cited. |
| Copyright |
Copyright © The Author(s), 2026. Published by Science Publishing Group |
Biostimulants, Soybean, Agro-climatic Zones, Seaweed Extract + Vitamin, Seaweed Extract + Humic and Fulvic Acids, Protein Hydrolysate + Humic Acids
Treatment | Biostimulant Description | Dosage |
|---|---|---|
T1 | Bio Liquid SF (seaweed extract + vitamin) | 250 mL ha-1 |
T2 | Bio Liquid SF (seaweed extract + vitamin) | 325 mL ha-1 |
T3 | Bio Liquid SF (seaweed extract + vitamin) | 500 mL ha-1 |
T4 | Bio Liquid HA (seaweed extract + humic and fulvic acids) | 500 mL ha-1 |
T5 | Bio Liquid HA (seaweed extract + humic and fulvic acids) | 750 mL ha-1 |
T6 | Bio Liquid HA (seaweed extract + humic and fulvic acids) | 1000 mL ha-1 |
T7 | Bio Granules FG (protein hydrolysate + humic acids) | 12.5 kg ha-1 |
T8 | Bio Granules FG (protein hydrolysate + humic acids) | 18 kg ha-1 |
T9 | Bio Granules FG (protein hydrolysate + humic acids) | 25 kg ha-1 |
T10 | Control (untreated) | — |
Attribute | Method | Reference |
|---|---|---|
pH | Glass electrode pH meter | (Jackson et al., 1967) [1 8] |
EC (dS m-1) | Digital conductivity meter | (Jackson et al., 1973) [ 19] |
Organic carbon (%) | Walkley and Black method | (Walkley et al., 1934) [2 0] |
Available N (kg ha-1) | Alkaline permanganate method | (Subbiah et al., 1956) [2 1] |
Available P (kg ha-1) | Olsen method | (Olsen et al., 1954) [2 2] |
Available K (kg ha-1) | Ammonium acetate extraction | (AOAC., 1970) [ 23] |
Soil parameters | Unit | Zone I (Akrot) | Zone II (Palampur) | Zone III (Awarna) |
|---|---|---|---|---|
pH | 6.80 | 5.54 | 5.43 | |
Electrical conductivity | dS m-1 | 1.382 | 0.284 | 0.248 |
Organic carbon | g kg-1 | 7.6 | 10.6 | 12.6 |
Available nitrogen | kg ha-1 | 245.3 | 350.4 | 316.7 |
Available phosphorus | 28.6 | 18.2 | 14.6 | |
Available potassium | 268.0 | 246.4 | 226.2 |
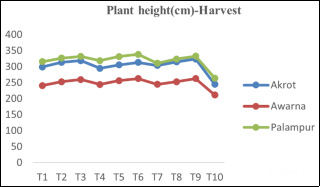
Location | Plant height 30 DAS (cm) | Plant height 60 DAS (cm) | Plant height 90 DAS (cm) | Plant height at harvest (cm) |
|---|---|---|---|---|
Akrot | 37.95±0.33c | 77.13±1.35b | 95.90±1.40b | 101.10±1.35b |
Palampur | 36.05±0.37b | 76.93±1.09b | 100.77±1.35c | 106.50±1.38c |
Awarna | 27.53±0.20a | 59.10±0.61a | 79.31±0.99a | 82.97±0.97a |
SED (±) | 0.316 | 0.567 | 0.59 | 0.6050 |
CD (P = 0.05) | 1.37 | 2.46 | 2.57 | 2.62 |
Treatment | Plant height 30 DAS (cm) | Plant height 60 DAS (cm) | Plant height 90 DAS (cm) | Plant height at harvest (cm) |
|---|---|---|---|---|
T1 | 33.33bc | 70.03±3.21b | 90.57±3.63b | 95.05±3.82b |
T2 | 34.52bcd | 72.18±3.09bc | 94.39±3.47bc | 99.28±3.95bc |
T3 | 35.26d | 74.11±3.36bc | 95.99±3.49c | 101.20±3.82c |
T4 | 32.82ab | 70.21±3.15b | 90.63±3.48b | 95.36±3.71b |
T5 | 34.14bcd | 72.16±3.18bc | 94.16±3.39bc | 99.26±3.74bc |
T6 | 34.76cd | 73.74±3.27bc | 96.00±3.44c | 101.59±3.85c |
T7 | 33.33bc | 71.13±3.30bc | 90.67±3.64b | 95.46±3.51b |
T8 | 34.48bcd | 73.61±3.62bc | 95.20±3.72bc | 99.12±3.86bc |
T9 | 34.80cd | 75.77±3.35c | 97.17±3.28c | 102.20±3.74c |
T10 | 30.99a | 57.60±2.06a | 75.16±2.47a | 80.03±2.72a |
SED | 0.316 | 1.020 | 1.09 | 0.9481 |
CD (P = 0.05) | 1.37 | 4.77 | 5.10 | 4.43 |
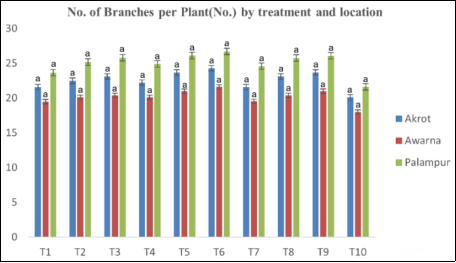
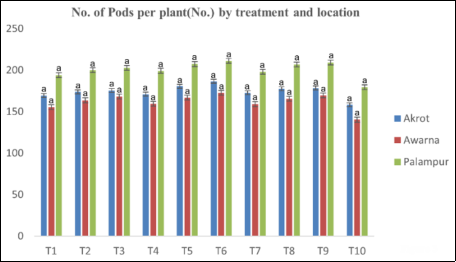
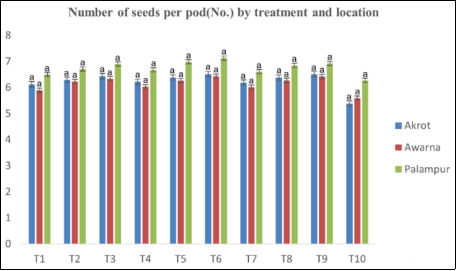
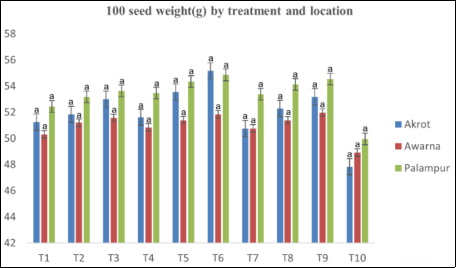
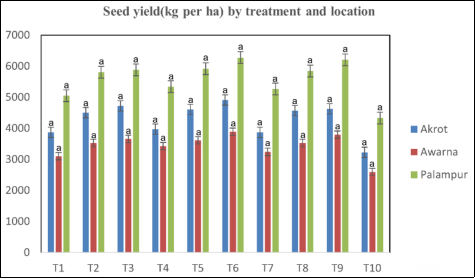
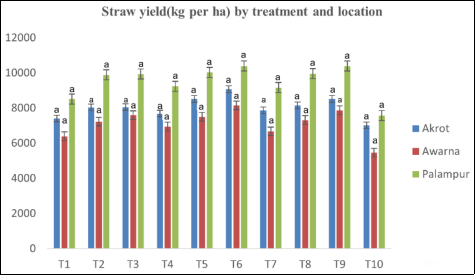
Location, L | Number of Branches per Plant Average ± SE | No. of Pods per plant (No.) Average ± SE | Number of seeds per pod (No.) Average ± SE | 100 seed weight (g) Average ± SE | Seed yield (kg per ha) Average ± SE | Straw yield (kg per ha) Average ± SE |
|---|---|---|---|---|---|---|
Akrot | 7.527±0.101b | 58.156±0.637b | 2.081±0.029a | 17.350±0.161ab | 1,429.69±33.28b | 2,677.716±41.321b |
Palampur | 8.343±0.106c | 66.944±0.675c | 2.252±0.018b | 17.799±0.097b | 1,863.97±38.45c | 3,169.167±57.008c |
Awarna | 6.719±0.085a | 54.037±0.674a | 2.049±0.021a | 17.007±0.070a | 1,145.45±27.03a | 2,370.367±51.122a |
SED | 0.0826 | 0.4537 | 0.0187 | 0.1078 | 16.6213 | 32.1242 |
CD (P = 0.05) | 0.3582 | 1.9688 | 0.0811 | 0.4678 | 72.1197 | 139.3868 |
Treatment, T | Number of Branches per Plant (No.) Average ± SE | No. of Pods per plant (No.) Average ± SE | Number of seeds per pod (No.) Average ± SE | 100 seed weight (g) Average ± SE | Seed yield (kg per ha) Average ± SE | Straw yield (kg per ha) Average ± SE |
|---|---|---|---|---|---|---|
T1 | 7.189±0.229ab | 57.640±2.000b | 2.057±0.039ab | 17.112±0.151b | 1336.07±94.82b | 2,478.890±108.129b |
T2 | 7.528±0.251bcd | 59.757±1.910bc | 2.137±0.038bc | 17.360±0.125bc | 1537.17±111.24cd | 2,793.876±133.628cd |
T3 | 7.699±0.266bcd | 60.720±1.857bc | 2.186±0.034bc | 17.580±0.133bc | 1584.86±108.52d | 2,842.906±121.310cd |
T4 | 7.469±0.238bcd | 58.871±2.115b | 2.103±0.038bc | 17.326±0.196bc | 1415.46±95.83bc | 2,651.242±115.433bc |
T5 | 7.862±0.257cd | 61.667±2.029bc | 2.182±0.048bc | 17.700±0.165bc | 1570.65±113.06d | 2,894.157±125.082de |
T6 | 8.064±0.258d | 63.399±1.945c | 2.230±0.043c | 17.986±0.201c | 1674.82±117.30d | 3,067.997±112.985e |
T7 | 7.300±0.262bc | 58.871±1.981b | 2.090±0.031bc | 17.210±0.171b | 1375.55±105.06b | 2,633.341±125.167bc |
T8 | 7.693±0.273bcd | 61.120±2.166bc | 2.167±0.035bc | 17.536±0.146bc | 1549.20±116.84cd | 2,824.416±132.035cd |
T9 | 7.861±0.268cd | 61.933±2.066bc | 2.205±0.030bc | 17.746±0.132bc | 1625.66±120.54d | 2,975.402±128.941de |
T10 | 6.633±0.336a | 53.146±2.549a | 1.917±0.086a | 16.300±0.382a | 1127.61±101.56a | 2,228.602±146.630a |
SED | 0.1382 | 0.9297 | 0.0362 | 0.1639 | 32.3213 | 47.1554 |
CD (P = 0.05) | 0.6459 | 4.3442 | 0.1689 | 0.7661 | 151.0275 | 220.3433 |
Source of Variation | df | Number of Branches | No. of Pods | No. of Seeds/pod | 100-seed weight g (F-value) | Seed yield (F-value) | Straw yield (F-value) |
|---|---|---|---|---|---|---|---|
Location (L) (F-value) | 2 | 96.707** | 211.099** | 33.988** | 13.547** | 473.971** | 157.316** |
Treatment (T) (F-value) | 9 | 8.942** | 9.535** | 6.457** | 8.008** | 26.209** | 27.799** |
L × T (F-value) | 18 | 0.190ns | 0.147ns | 0.207ns | 0.561ns | 0.654ns | 0.869ns |
Error (a) MS | 6 | 0.2045 | 6.1766 | 0.0105 | 0.3487 | 8288.0076 | 30958.8964 |
Error (b) MS | 54 | 0.1720 | 7.7792 | 0.0118 | 0.2419 | 9401.9689 | 20012.7270 |
CV (a) (%) | — | 6.00 | 4.16 | 4.81 | 3.40 | 6.15 | 6.42 |
CV (b) (%) | — | 5.51 | 4.67 | 5.10 | 2.83 | 6.55 | 5.16 |
ANOVA | Analysis of Variance |
RCBD | Randomized Completely Block Design |
CD | Critical Difference |
DAS | Days After Sowing |
| [1] | Hartman, G. L.; West, E. D.; Herman, T. K. Crops that feed the World 2. Soybean—Worldwide production, use, and constraints caused by pathogens and pests. Food Secur. 2011, 3, 5–17. |
| [2] | FAOSTAT. FAO Statistical Database; Food and Agriculture Organization of the United Nations: Rome, Italy, 2023. Available online: |
| [3] | Salvagiotti, F.; Cassman, K. G.; Specht, J. E.; Walters, D. T.; Weiss, A.; Dobermann, A. Nitrogen uptake, fixation and response to fertilizer N in soybean: A review. Field Crops Res. 2008, 108, 1–13. |
| [4] | Peoples, M. B.; Brockwell, J.; Herridge, D. F.; Rochester, I. J.; Alves, B. J. R.; Urquiaga, S.; Boddey, R. M.; Dakora, F. D.; Bhattarai, S. L.; Maskey, S. L.; et al. The contributions of nitrogen-fixing crop legumes to agricultural productivity. Symbiosis. 2009, 48, 1–17. |
| [5] | Sinclair, T. R.; Marrou, H.; Soltani, A.; Vadez, V.; Chandolu, K. C. Soybean production potential and crop physiology. Field Crops Res. 2015, 182, 30–38. |
| [6] | Liu, X.; Jin, J.; Wang, G.; Herbert, S. J. Soybean yield physiology and development under changing climate conditions. Field Crops Res. 2020, 248, 107714. |
| [7] | Board, J. E.; Kahlon, C. S. Soybean yield formation: What controls it and how it can be improved. In Soybean Physiology and Biochemistry; El-Shemy, H. A., Ed.; InTech: Rijeka, Croatia, 2011; pp. 1–36. |
| [8] | Gaspar, A. P.; Conley, S. P.; Naeve, S. L.; Casteel, S. N.; Kovács, P. Response of soybean yield to management and environment. Agron. J. 2017, 109, 1–12. |
| [9] | Egli, D. B. Soybean yield physiology: Principles and processes of yield production. CAB Rev. 2017, 12, 1–13. |
| [10] | Assefa, Y.; Purcell, L. C.; Salmeron, M.; Naeve, S.; Casteel, S. N.; Kovács, P.; Archontoulis, S.; Licht, M.; Below, F. E.; Orlowski, J. M.; et al. Assessing variation in US soybean seed composition (protein and oil). Field Crops Res. 2019, 242, 107580. |
| [11] | Purcell, L. C.; Salmeron, M.; Ashlock, L. Soybean yield formation and environmental stress response mechanisms. Agronomy 2021, 11, 1235. |
| [12] | Zhang, J.; Liu, X.; Wang, G.; Herbert, S. J.; Jin, J. Physiological responses of soybean to heat and drought stress under climate variability. Field Crops Res. 2021, 270, 108197. |
| [13] | Kumagai, E.; Araki, T.; Hamaoka, N.; Ueno, O. Photosynthetic regulation and yield stability of soybean under elevated temperature and variable moisture conditions. Front. Plant Sci. 2022, 13, 873421. |
| [14] | Yan, W.; Kang, M. S. GGE Biplot Analysis: A Graphical Tool for Breeders, Geneticists and Agronomists; CRC Press: Boca Raton, FL, USA, 2003. |
| [15] | Gauch, H. G. Statistical analysis of yield trials by AMMI and GGE. Crop Sci. 2006, 46, 1488–1500. |
| [16] | Smith, A. B.; Cullis, B. R.; Thompson, R. The analysis of crop cultivar breeding and evaluation trials: An overview. Aust. N. Z. J. Stat. 2005, 47, 483–496. |
| [17] | Gauch, H. G. A simple protocol for AMMI analysis of yield trials. Crop Sci. 2013, 53, 1860–1869. |
| [18] | Jackson, M. L. Soil Chemical Analysis; Prentice Hall: New Delhi, India, 1967. |
| [19] | Jackson, M. L. Soil Chemical Analysis; Prentice Hall: New Delhi, India, 1973. |
| [20] | Walkley, A.; Black, I. A. An examination of the Degtjareff method for determining soil organic matter. Soil Sci. 1934, 37, 29–38. |
| [21] | Subbiah, B. V.; Asija, G. L. A rapid procedure for the determination of available nitrogen in soils. Curr. Sci. 1956, 25, 259–260. |
| [22] | Olsen, S. R.; Cole, C. V.; Watanabe, F. S.; Dean, L. A. Estimation of available phosphorus in soils by extraction with sodium bicarbonate. USDA Circ. 1954, 939, 1–19. |
| [23] | AOAC. Official Methods of Analysis; AOAC: Washington, DC, USA, 1970. |
| [24] | Ray, D. K.; Gerber, J. S.; MacDonald, G. K.; West, P. C. Climate variation explains a third of global crop yield variability. Nat. Commun. 2015, 6, 5989. |
APA Style
Patel, F. Y., Kumar, S., Manuja, S., Meenakshi, Shah, N. J. (2026). Response of Soybean to Different Category of Biostimulants Across Contrasting Himalayan Hill Agro-Climatic Zones. International Journal of Applied Agricultural Sciences, 12(3), 97-109. https://doi.org/10.11648/j.ijaas.20261203.13
ACS Style
Patel, F. Y.; Kumar, S.; Manuja, S.; Meenakshi; Shah, N. J. Response of Soybean to Different Category of Biostimulants Across Contrasting Himalayan Hill Agro-Climatic Zones. Int. J. Appl. Agric. Sci. 2026, 12(3), 97-109. doi: 10.11648/j.ijaas.20261203.13
@article{10.11648/j.ijaas.20261203.13,
  author = {Femida Yunus Patel and Suresh Kumar and Sandeep Manuja and Meenakshi and Neil Jaykumar Shah},
  title = {Response of Soybean to Different Category of Biostimulants Across Contrasting Himalayan Hill
Agro-Climatic Zones},
  journal = {International Journal of Applied Agricultural Sciences},
  volume = {12},
  number = {3},
  pages = {97-109},
  doi = {10.11648/j.ijaas.20261203.13},
  url = {https://doi.org/10.11648/j.ijaas.20261203.13},
  eprint = {https://article.sciencepublishinggroup.com/pdf/10.11648.j.ijaas.20261203.13},
  abstract = {Biostimulants have been extensively studied in horticultural and high-value crops, particularly in developed countries. However, their application in low-value broad-acre crops under diverse hill agro-ecosystems investigations are limited, especially in developing countries dominated by smallholder farming systems. This study evaluated three biostimulant formulations—seaweed extract + vitamin, seaweed extract + humic and fulvic acids, and protein hydrolysate + humic acids—in soybean across three western Himalayan hill agro-climatic zones: Zone I (Akrot; sub-montane low-hill subtropical), Zone II (Palampur; mid-hill sub-humid), and Zone III (Awarna; high-hill temperate wet). Field experiments were conducted in a randomized block design with ten treatments and three replications. Growth and yield parameters were analysed through individual and pooled ANOVA, while treatment responses across environments were assessed using location × treatment interactions. Significant effects of both location and treatment (p < 0.01) were observed for all measured traits. Palampur was the most favourable environment, followed by Akrot, whereas Awarna imposed relatively constrained conditions. Among treatments, T6 showed the most consistent performance and recorded a 48.5% yield advantage over the control, while T9 and T3 performed statistically at par. The findings demonstrate the potential of biostimulants to enhance soybean productivity across diverse Himalayan hill agro-ecosystems.},
 year = {2026}
}
TY  - JOUR
T1  - Response of Soybean to Different Category of Biostimulants Across Contrasting Himalayan Hill
Agro-Climatic Zones
AU  - Femida Yunus Patel
AU  - Suresh Kumar
AU  - Sandeep Manuja
AU  - Meenakshi
AU  - Neil Jaykumar Shah
Y1  - 2026/06/29
PY  - 2026
N1  - https://doi.org/10.11648/j.ijaas.20261203.13
DO  - 10.11648/j.ijaas.20261203.13
T2  - International Journal of Applied Agricultural Sciences
JF  - International Journal of Applied Agricultural Sciences
JO  - International Journal of Applied Agricultural Sciences
SP  - 97
EP  - 109
PB  - Science Publishing Group
SN  - 2469-7885
UR  - https://doi.org/10.11648/j.ijaas.20261203.13
AB  - Biostimulants have been extensively studied in horticultural and high-value crops, particularly in developed countries. However, their application in low-value broad-acre crops under diverse hill agro-ecosystems investigations are limited, especially in developing countries dominated by smallholder farming systems. This study evaluated three biostimulant formulations—seaweed extract + vitamin, seaweed extract + humic and fulvic acids, and protein hydrolysate + humic acids—in soybean across three western Himalayan hill agro-climatic zones: Zone I (Akrot; sub-montane low-hill subtropical), Zone II (Palampur; mid-hill sub-humid), and Zone III (Awarna; high-hill temperate wet). Field experiments were conducted in a randomized block design with ten treatments and three replications. Growth and yield parameters were analysed through individual and pooled ANOVA, while treatment responses across environments were assessed using location × treatment interactions. Significant effects of both location and treatment (p < 0.01) were observed for all measured traits. Palampur was the most favourable environment, followed by Akrot, whereas Awarna imposed relatively constrained conditions. Among treatments, T6 showed the most consistent performance and recorded a 48.5% yield advantage over the control, while T9 and T3 performed statistically at par. The findings demonstrate the potential of biostimulants to enhance soybean productivity across diverse Himalayan hill agro-ecosystems.
VL  - 12
IS  - 3
ER  -
Agri Biochem Research Lab, M/s. Pushpa J. Shah, Ankleshwar, India
Department of Agronomy, Chaudhary Sarwan Kumar Himachal Pradesh Krishi Vishvavidyalaya, Palampur, India
Department of Agronomy, Chaudhary Sarwan Kumar Himachal Pradesh Krishi Vishvavidyalaya, Palampur, India
Department of Agronomy, Chaudhary Sarwan Kumar Himachal Pradesh Krishi Vishvavidyalaya, Palampur, India
Agri Biochem Research Lab, M/s. Pushpa J. Shah, Ankleshwar, India
Information