
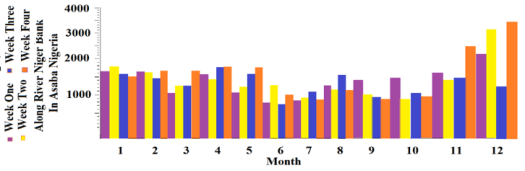
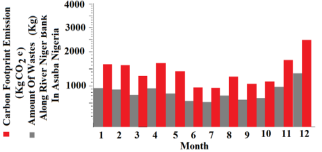
Environmental impact assessment is the study of the effects exertible on the environment from a specific action. With respect to refuse waste disposals, the generative actions are mostly from people. Refuse waste disposal means rejected useless materials disposed away. Their unpleasantness extend to unsightliness accompanied bad smell, emissions and climate change contributions, fire outbreaks from contents burning, chemical poisonings upon contacts, pollution from leakages to surrounding soil, groundwater, and surface waters, and others. Wastes are among the top 5 largest generator of total greenhouse gas emissions. Carbon constituent the largest content of the total greenhouse gases, and are mostly deployed in determining such emissions. Refuse waste carbon emissions are generatable from mostly decays and burnings which facilitate carbon emissions movement back to the atmosphere of the environment. This calls for observatories, documentaries, strategies, and others, necessary for effective management. And, healthy management yields remarkable sustainability. This positively benefits agriculture (food production), ecology (good dwelling and interactions), health (good body state), engineered products and services (stable good conditions enable peak functions and services), etc. Thus, "environmental impact assessment of carbon emissions from refuse waste disposals along River Niger bank in Asaba - a footprint approach" was conducted. Results showed that 1,427.85 kgCO2e and 793 Kg were the carbon emissions and refuse wastes amounts. The carbon emissions and wastes ranged between 730.80 - 3445.20 KgCO2e, and 406 - 1914 Kg respectively, invariably low to moderate. It was concluded that the carbon emissions from the refuse wastes disposals had low impact to the environment.
| Published in | International Journal of Environmental Chemistry (Volume 10, Issue 2) |
| DOI | 10.11648/j.ijec.20261002.12 |
| Page(s) | 34-42 |
| Creative Commons |
This is an Open Access article, distributed under the terms of the Creative Commons Attribution 4.0 International License (http://creativecommons.org/licenses/by/4.0/), which permits unrestricted use, distribution and reproduction in any medium or format, provided the original work is properly cited. |
| Copyright |
Copyright © The Author(s), 2026. Published by Science Publishing Group |
EIA, Refuse Waste Disposal, Carbon Emissions, Footprint
SN | Month | Amount Of Waste (Kg) | Carbon Footprint Emissions (Kg CO2 e) | Impact Classification |
|---|---|---|---|---|
1 | January | 918 | 1652.40 | Low |
2 | February | 912 | 1641.60 | Low |
3 | March | 582 | 1047.60 | Low |
4 | April | 869 | 1564.20 | Low |
5 | May | 597 | 1074.60 | Low |
6 | June | 440 | 792.00 | Low |
7 | July | 468 | 842.40 | Low |
8 | August | 698 | 1256.40 | Low |
9 | September | 790 | 1422.00 | Low |
10 | October | 832 | 1497.60 | Low |
11 | November | 890 | 1602.00 | Low |
12 | December | 1,210 | 2178.00 | Moderate |
Total | - | 9,206 | 16,570.80 | - |
Average | - | 767 | 1,380.90 | Low |
SN | Month | Amount Of Waste (Kg) | Carbon Footprint Emissions (Kg CO2 e) | Impact Classification |
|---|---|---|---|---|
1 | January | 996 | 1792.80 | Low |
2 | February | 896 | 1612.80 | Low |
3 | March | 691 | 1243.80 | Low |
4 | April | 791 | 1423.80 | Low |
5 | May | 673 | 1211.40 | Low |
6 | June | 709 | 1276.20 | Low |
7 | July | 507 | 912.60 | Low |
8 | August | 631 | 1135.80 | Low |
9 | September | 560 | 1008.00 | Low |
10 | October | 495 | 891.00 | Low |
11 | November | 780 | 1404.00 | Low |
12 | December | 1,730 | 3114.00 | Moderate |
Total | - | 9,459 | 17,026.20 | - |
Average | - | 788 | 1,418.85 | Low |
SN | Month | Amount Of Waste (Kg) | Carbon Footprint Emissions (Kg CO2 e) | Impact Classification |
|---|---|---|---|---|
1 | January | 882 | 1587.60 | Low |
2 | February | 815 | 1467.00 | Low |
3 | March | 683 | 1229.40 | Low |
4 | April | 984 | 1771.20 | Low |
5 | May | 882 | 1587.60 | Low |
6 | June | 406 | 730.80 | Low |
7 | July | 610 | 1098.00 | Low |
8 | August | 863 | 1553.40 | Low |
9 | September | 515 | 927.00 | Low |
10 | October | 605 | 1089.00 | Low |
11 | November | 830 | 1494.00 | Low |
12 | December | 690 | 1242.00 | Low |
Total | - | 8,765 | 15,777.00 | - |
Average | - | 730 | 1,314.75 | Low |
SN | Month | Amount Of Waste (Kg) | Carbon Footprint Emissions (Kg CO2 e) | Impact Classification |
|---|---|---|---|---|
1 | January | 834 | 1501.20 | Low |
2 | February | 937 | 1686.60 | Low |
3 | March | 924 | 1663.20 | Low |
4 | April | 996 | 1792.80 | Low |
5 | May | 968 | 1742.40 | Low |
6 | June | 561 | 1009.80 | Low |
7 | July | 483 | 869.40 | Low |
8 | August | 624 | 1123.20 | Low |
9 | September | 495 | 891.00 | Low |
10 | October | 528 | 950.40 | Low |
11 | November | 1,380 | 2484.00 | Moderate |
12 | December | 1,914 | 3445.20 | Moderate |
Total | - | 10,644 | 19,159.20 | - |
Average | - | 887 | 1,596.60 | Low |
SN | Month | Amount Of Waste (Kg) | Carbon Footprint Emissions (Kg CO2 e) | Impact Classification |
|---|---|---|---|---|
1 | January | 908 | 1634.40 | Low |
2 | February | 890 | 1602.00 | Low |
3 | March | 720 | 1296.00 | Low |
4 | April | 910 | 1638.00 | Low |
5 | May | 780 | 1404.00 | Low |
6 | June | 529 | 952.20 | Low |
7 | July | 517 | 930.60 | Low |
8 | August | 704 | 1267.20 | Low |
9 | September | 590 | 1062.00 | Low |
10 | October | 615 | 1107.00 | Low |
11 | November | 970 | 1746.00 | Low |
12 | December | 1386 | 2494.80 | Moderate |
Total | - | 9,519 | 17,134.20 | - |
Average | - | 793 | 1,427.85 | Low |
KgCO2e | Kilogram Carbon Dioxide Equivalent |
Kg | Kilogram |
CO2 | Carbon Dioxide |
| [1] | Salman M. Y., Hasar H. Review On Environmental Aspects In Smart City Concept:Water, Waste, Air Pollution And Transportation Smart Applications Using IoT Techniques. Sustainable Cities And Society. 2023, 92(104567). p 2, & 4. |
| [2] | Ichipi E. B., Senekane M. F. An Evaluation Of The Impact Of Illegal Dumping Of Solid Waste On Public Health In Nigeria:A Case Study Of Lagos State. International Journal Of Environmental Resources And Public Health. 2023, 20(22), 7069, pp 1 - 19. |
| [3] | Pudcha T., Phongphiphat A., Towprayoon S. Greenhouse Gas Mitigation And Energy Production Potentials From Municipal Solid Waste Management In Thailand Through 2050. Earth System And Environment. 2023, 7, pp 83 - 97. |
| [4] | Olaniyan U., Massoud M. A., Alameddine I., Al - Hindi M. Beneath The Surface:Assessing Pollution Levels Near Major Solid Waste Dumpsites In Lagos, Nigeria. Environmental Monitoring And Assessment. 2024, 196(11), pp 1 - 12. |
| [5] | Raphela T., Manqele N., Erasmus M. The Impact Of Improper Waste Disposal On Human Health And The Environment:A Case Of Umgungundlovu District In KwaZulu Natal Province, South Africa. Frontiers Of Sustainability. 2024, 5(1386047), pp 1 - 13. |
| [6] | Zhang Z., Chen Z., Zhang J., Liu Y., Chen L., Yang M., Osman A. I., Farghali M., Liu E., Hassan D., Ihara I., Lu K., Rooney D. W., Yap P. S. Municipal Solid Waste Management Challenges In Developing Regions:A Comprehensive Review And Future Perspectives For Asia And Africa. Science Of The Total Environment. 2024, 930(172794), pp 1 - 18. |
| [7] | World Heritage Convention. WHC:Environmental Impact Assessment. UNESCO World Heritage Centre, Viet Nam, 2025, p 1. Available From: |
| [8] |
Environmental Protection Agency. EPA:Environmental Impact Assessment - Overview. Wexford, Republic Of Ireland, 2025, p 1. Available From:
https://epa.ie/our-services/monitoring--assessment/assessment/environmental-impact-assessment/ |
| [9] | European Commission Of The European Union. EC - EU:Environmental Impact Assessment. Environment - Environmental Assessments, European Union; 2025, p 1. Available From: |
| [10] | Khalil E. E., El - Sherif D. M. Innovative Smart Applications For Solid Waste Management (Chapter 17). Smart Cities Policies And Financing Approaches And Solutions. 2022, pp 239 - 247; 239. |
| [11] | Watson M. Waste Management. International Encyclopedia Of Human Geography (Second Edition). 2020, pp 225 - 231; 225. |
| [12] | Wikipedia Encyclopedia. W. E:Carbon Dioxide. Wikipedia, 2025, p 7. Available From: |
| [13] |
Myclimate. MC:What Is Carbon Dioxide (CO2)? Environmental Climate Organisation, 2025, p 2. Available From:
https://myclimate.org/en/information/faq/faq-detail/what-is-co2-and-where-does-it-come-from/ |
| [14] |
Europe Statistics Of European Commission. ES - EC:Greenhouse Gas Emissions From Waste. Eurostat, European Union; 2020, p 4. Available From:
https://ec.europa.eu/eurostat/web/products-eurostat-news/-/ddn-20200123-1 |
| [15] | Derbyshire E. J., Finnigan T. J. A. Mycoprotein:A Futuristic Portrayal (Chapter 16). Future Foods Global Trends, Opportunities, And Sustainability Challenges. 2022, pp 287 - 303; 289. |
| [16] | Chen R., Zhang R., Han H. Where Has Carbon Footprint Research Gone? Ecological Indicators. 2021, 120(106882), p 6. |
| [17] | Sarkar S., Garai S., Saha S., Ghosh S., Brahmachari K. Management Of Carbon And Nitrogen Footprints For A Better Environment. Encyclopedia Of Sustainable Technologies (Second Edition). 2024, 2, pp 694 - 709; 697. |
| [18] |
New York State Energy Research And Development Authority. NYSERDA:Steps To Lower Your Carbon Footprint. New York State Government, USA; 2025, p 6. Available From:
https://nyserda.ny.gov/Featured-Stories/Steps-to-Lower-Your-Carbon-Footprint#footnote6 |
| [19] | Byjus Learning App. BLA:Methods Of Wastes Disposals. Biology, 2025, p 2. Available From: |
| [20] | Premkumar A. Assessment Of Carbon Footprint From Household Solid Waste In Tamil Nadu, India:Pathways For Achieving Low - Carbon Economy. Circular Economy And Sustainability. 2025, 5, pp 483 - 504; 483. |
| [21] | Yin J., Wang M., Yu X., Wang M., Zhang Y., Chen T., Liu J. Carbon Footprint Impact Of Waste Sorting On The Municipal Household Waste Treatment System:A Mommunity Case Study Of Hangzhou. Circular Economy. 2024, 3(4):100114, p 1. |
APA Style
Okolotu, G. I., Nwadiolu, R., Akwenuke, O. M., Okeke, C. G. (2026). Environmental Impact Assessment of Carbon Emissions from Refuse Waste Disposals Along River Niger Bank in Asaba - A Footprint Approach. International Journal of Environmental Chemistry, 10(2), 34-42. https://doi.org/10.11648/j.ijec.20261002.12
ACS Style
Okolotu, G. I.; Nwadiolu, R.; Akwenuke, O. M.; Okeke, C. G. Environmental Impact Assessment of Carbon Emissions from Refuse Waste Disposals Along River Niger Bank in Asaba - A Footprint Approach. Int. J. Environ. Chem. 2026, 10(2), 34-42. doi: 10.11648/j.ijec.20261002.12
@article{10.11648/j.ijec.20261002.12,
  author = {Godspower Ikechukwu Okolotu and Romanus Nwadiolu and Onoziogie Moses Akwenuke and Chineze Glory Okeke},
  title = {Environmental Impact Assessment of Carbon Emissions from Refuse Waste Disposals Along River Niger Bank in Asaba - A Footprint Approach},
  journal = {International Journal of Environmental Chemistry},
  volume = {10},
  number = {2},
  pages = {34-42},
  doi = {10.11648/j.ijec.20261002.12},
  url = {https://doi.org/10.11648/j.ijec.20261002.12},
  eprint = {https://article.sciencepublishinggroup.com/pdf/10.11648.j.ijec.20261002.12},
  abstract = {Environmental impact assessment is the study of the effects exertible on the environment from a specific action. With respect to refuse waste disposals, the generative actions are mostly from people. Refuse waste disposal means rejected useless materials disposed away. Their unpleasantness extend to unsightliness accompanied bad smell, emissions and climate change contributions, fire outbreaks from contents burning, chemical poisonings upon contacts, pollution from leakages to surrounding soil, groundwater, and surface waters, and others. Wastes are among the top 5 largest generator of total greenhouse gas emissions. Carbon constituent the largest content of the total greenhouse gases, and are mostly deployed in determining such emissions. Refuse waste carbon emissions are generatable from mostly decays and burnings which facilitate carbon emissions movement back to the atmosphere of the environment. This calls for observatories, documentaries, strategies, and others, necessary for effective management. And, healthy management yields remarkable sustainability. This positively benefits agriculture (food production), ecology (good dwelling and interactions), health (good body state), engineered products and services (stable good conditions enable peak functions and services), etc. Thus, "environmental impact assessment of carbon emissions from refuse waste disposals along River Niger bank in Asaba - a footprint approach" was conducted. Results showed that 1,427.85 kgCO2e and 793 Kg were the carbon emissions and refuse wastes amounts. The carbon emissions and wastes ranged between 730.80 - 3445.20 KgCO2e, and 406 - 1914 Kg respectively, invariably low to moderate. It was concluded that the carbon emissions from the refuse wastes disposals had low impact to the environment.},
 year = {2026}
}
TY  - JOUR
T1  - Environmental Impact Assessment of Carbon Emissions from Refuse Waste Disposals Along River Niger Bank in Asaba - A Footprint Approach
AU  - Godspower Ikechukwu Okolotu
AU  - Romanus Nwadiolu
AU  - Onoziogie Moses Akwenuke
AU  - Chineze Glory Okeke
Y1  - 2026/11/16
PY  - 2026
N1  - https://doi.org/10.11648/j.ijec.20261002.12
DO  - 10.11648/j.ijec.20261002.12
T2  - International Journal of Environmental Chemistry
JF  - International Journal of Environmental Chemistry
JO  - International Journal of Environmental Chemistry
SP  - 34
EP  - 42
PB  - Science Publishing Group
SN  - 2640-1460
UR  - https://doi.org/10.11648/j.ijec.20261002.12
AB  - Environmental impact assessment is the study of the effects exertible on the environment from a specific action. With respect to refuse waste disposals, the generative actions are mostly from people. Refuse waste disposal means rejected useless materials disposed away. Their unpleasantness extend to unsightliness accompanied bad smell, emissions and climate change contributions, fire outbreaks from contents burning, chemical poisonings upon contacts, pollution from leakages to surrounding soil, groundwater, and surface waters, and others. Wastes are among the top 5 largest generator of total greenhouse gas emissions. Carbon constituent the largest content of the total greenhouse gases, and are mostly deployed in determining such emissions. Refuse waste carbon emissions are generatable from mostly decays and burnings which facilitate carbon emissions movement back to the atmosphere of the environment. This calls for observatories, documentaries, strategies, and others, necessary for effective management. And, healthy management yields remarkable sustainability. This positively benefits agriculture (food production), ecology (good dwelling and interactions), health (good body state), engineered products and services (stable good conditions enable peak functions and services), etc. Thus, "environmental impact assessment of carbon emissions from refuse waste disposals along River Niger bank in Asaba - a footprint approach" was conducted. Results showed that 1,427.85 kgCO2e and 793 Kg were the carbon emissions and refuse wastes amounts. The carbon emissions and wastes ranged between 730.80 - 3445.20 KgCO2e, and 406 - 1914 Kg respectively, invariably low to moderate. It was concluded that the carbon emissions from the refuse wastes disposals had low impact to the environment.
VL  - 10
IS  - 2
ER  -
Department Of Agricultural Engineering, Southern Delta University, Ozoro, Nigeria
Biography: Godspower Ikechukwu Okolotu (B. Eng., M. Eng., M. NSE, PhD, Re-COREN) is an academia of Southern Delta University, Ozoro Nigeria, West Africa, in the department of Agricultural Engineering 2023 to present. He attained the climax of his education in 2021 with a PhD in Soil and water engineering from department of Agricultural and Bioresource Engineering, at the Enugu State University of Science and Technology, Nigeria, upon M. Eng., and B. Eng., (2015 and 2011) in same. He also holds a certificate of practicing from Council for the regulation of Engineering In Nigeria from 2021 to present. Scholarly, he has authored multiple published papers.
Research Fields: soil and water conservation and management, hydro status and health, aquatic environments, sphere water recharges, ecosystem, etc.

Department Of Agricultural Economics, Southern Delta University, Ozoro, Nigeria
Biography: Romanus Nwadiolu is an academia of Southern Delta University, Ozoro Nigeria (2021 till date). He holds his PhD, masters degree, and bachelors degree in the area of agricultural economics, faculty of agriculture. He has authored various research works, and has registered a substantial record in academics.
Research Fields: agriculture, agroresource, agroconservation, agro safe environment, water relative to agriculture, etc.

Department Of Civil and Water Resources Engineering, Southern Delta University, Ozoro, Nigeria
Biography: Onoziogie Moses Akwenuke (B. Eng., M. Eng., PhD, Re-COREN), graduated with a B. Eng in Civil Engineering from Bendel State University in 1986, M. Sc in Environmental Resources Management, Lagos State University, Ojo, Lagos, 2000, PhD in Water Resources/ Environmental Health Engineering, University of Benin, 2015, have published a number of international, national and local research articles in reputable journals, have practiced civil engineering over the years both in the private and public sectors that involves design, construction, management and lecturing.
Research Fields: water resources management and conservation, environment, soil, groundwater, Waterways, etc.
Department Of Agricultural and Bioresource Engineering, Enugu State University of Science and Technology, Enugu, Nigeria
Biography: Chineze Glory Okeke (B. Eng., M. Eng., PhD, Re-COREN), an academia of Enugu State University of Science and Technology, Nigeria, holds a PhD (2019) in Bioprocessing Engineering from the department of Agricultural and Bioresource Engineering at Enugu State University of Science and Technology, Nigeria. She has published various research papers in various publishing places.
Research Fields: bio processing, crop processing, agricultural processing, agroconservation, agroenvironments, etc.


Information



 Share This Article
 Twitter
 Linked In
 Facebook

 Copy
 Download