Research Article | | Peer-Reviewed

Design and Analysis of an Offshore Platform for Oil and Gas Production in Gulf of Guinea Basin

Received: 15 April 2026     Accepted: 8 May 2026     Published: 11 July 2026
Views:       Downloads:
Abstract

Offshore oil and gas platforms are critical infrastructures for the extraction of hydrocarbons from the sea bed. The design of these platforms is complex and requires multidisciplinary approaches which include following standards such as the API standards. The aim of this study was to design and analyze an offshore platform structure that could be used in the Gulf of Guinea Basin to extract oil and gas from the sub sea bed. In order to design a safe and reliable structure, factors such as the functions and location parameters were taken into account. With these factors loading conditions for the weight of equipment, water depth, currents and wind were designed and used in analyzing the structure. Firstly those parameters permitted to select the platform type which was the fixed offshore jacket platform due to its stability in shallow water regions and according to the API RP 2A WSD standard. Secondly a conceptual model for the offshore platform was designed in SACS software by selecting the appropriate material which was A36 steel mainly due to its weldablity. Solidworks were used to design the cellar deck layout. Finally the structure was optimized by performing stress and deflection analysis. The maximum deflection and unity check ratio were found to be 8.6cm and 1.0 respectively. These values were both cause by a bending stress of 5.77kg/mm2 acting in the local y-axis of the structure. In accordance to the API standards a comprehensive platform design was generated to withstand the environmental conditions of Gulf of Guinea Basin.

Published in International Journal of Mechanical Engineering and Applications (Volume 14, Issue 3)
DOI 10.11648/j.ijmea.20261403.11
Page(s) 43-59
Creative Commons

This is an Open Access article, distributed under the terms of the Creative Commons Attribution 4.0 International License (http://creativecommons.org/licenses/by/4.0/), which permits unrestricted use, distribution and reproduction in any medium or format, provided the original work is properly cited.

Copyright

Copyright © The Author(s), 2026. Published by Science Publishing Group

Keywords

Design, Finite Element Analysis, Offshore Platform, Gulf of Guinea Basin

1. Introduction
Cameroon is a country located in Central Africa with vast oil and gas reserves. The country's oil and gas industry has been growing steadily over the years, with several offshore oil and gas fields being discovered. The Gulf of Guinea is a sub-basin of the Niger Delta, an area in which over 34.5 billion barrels of oil have been discovered, with 2.5 billion barrel of oil equivalent (boe) attributed to the Cameroonian section. The Gulf of Guinea Basin has, to date, produced over one billion barrels of oil and has estimated remaining reserves of 1.2 billion boe, primarily within depths of less than 2,000 meters . An oil platform (or oil rig, offshore platform, oil production platform, and similar terms) is a large structure with facilities to extract and process petroleum and natural gas that lie in rock formations beneath the seabed. Depending on the circumstances, the platform may be fixed to the ocean floor, consist of an artificial island, or float . According to Frank Sliggers , the move to offshore primarily began in the Gulf of Mexico and was primarily driven by Nationalization of private oil companies by OPEC countries. Offshore oilfields are an important source of energy for global economies. According to a study by Al-Sulaiman and Rahman , offshore oilfields have the potential to meet the growing global demand for oil and gas. These fields are often located in deep waters and may have significant reserves of oil and gas. Offshore platforms play a crucial role in the development of such marginal oilfields. According to a study by Abass et al. , offshore platforms enable the production of oil and gas from marginal fields that would otherwise be uneconomical to develop.
In 1980, the Alexander L. Kiell and semi-submersible offshore platform located in the North Sea capsized, killing 123 people. The cause of the disaster was found to be the failure of one of the platform legs due to poor structural integrity in the design of the leg . The design of offshore oil and gas platforms is a complex process that requires engineering expertise and technical knowledge. Water depth, wave and wind loads, soil conditions, environmental regulations, and proximity to existing infrastructure are some of the location parameters that must be considered in the platform's design. Most offshore oil and gas fields in Cameroon are located in water depths of between 50 and 100 meters , with the highest wave height and wind speed values occurring during the rainy season which exert significant load on offshore facilities. Load analysis is a crucial aspect of offshore platform design for oil and gas production. To have a better understanding of the impact of load on offshore platforms, engineers carryout load analysis. One approach to load analysis is the use of finite element analysis (FEA). As stated by Zhang et al. , FEA can be used to simulate the behavior of an offshore platform under different load conditions, enabling designers to optimize the platform's structural design for maximum efficiency and safety. According to the International Association of Oil and Gas Producers (IOGP), safety must be at the forefront of all design decisions and should be incorporated into the platform's layout, equipment selection, and emergency response plans . The applicable standards in the design of an offshore platform in Cameroon for oil and gas production are governed by various national and international organizations. One of the most important organizations that set standards for offshore platform design is the American Petroleum Institute (API). The API standards cover various aspects of offshore platform design, including structural design, materials, safety, and environmental protection. As noted by Zhang et al. , the incorporation of a lifecycle perspective into the platform's design and operation can help to optimize its performance and minimize environmental impacts.
There are several different types of offshore platforms, including fixed platforms, compliant towers, tension leg platforms, semi-submersible platforms, and floating production storage and offloading (FPSO) vessels. Each type of platform has its own unique design and construction characteristics, and is used for specific oil and gas extraction applications. Different offshore structures are designed for various water depths. Petroleum can be drilled up to 3.000 meters . The design of offshore platforms for oil and gas production is a crucial activity that requires a high level of accuracy and safety.
Lokman studied the conceptual design support tool for offshore platform Jacket Design. This study discusses the development of a software tool to support the conceptual design of offshore platform jackets. The tool was developed using the MATLAB programming language and includes features for generating concept sketches, evaluating concept designs, and generating reports .
Romly studied the design of fixed offshore platform to marine growth thickness in Malaysian water with particular attention to the effects of marine growth. The study discusses the use of software to model the effects of marine growth on offshore platforms and to optimize the design of platforms to minimize the effects of marine growth .
Umar. studied the design for safety framework for offshore oil and gas platforms This study presents a framework for the design of offshore oil and gas platforms that considers safety as a primary design criterion. The framework includes a number of software tools that can be used to assess the safety of offshore platforms .
Sadeghian and Ghasemi studied a methodology for the conceptual design of offshore jacket platforms. The methodology uses a combination of software tools and expert judgment to generate and evaluate concept designs .
Zare and Sadeghi, studied the application of the finite element method (FEM) for the structural analysis of offshore platforms. The study presents a number of case studies that demonstrate the use of FEM for offshore platform design .
Zhao and Xie used genetic algorithm-based optimization approach for the design of offshore platforms. The approach uses a genetic algorithm to search for the optimal design of an offshore platform that satisfies a set of design constraints .
In conclusion, the seven studies reviewed in this section provide valuable insights into the design of offshore platforms. The studies cover a wide range of topics, including conceptual design, marine growth, safety, structural analysis and optimization. The studies also use a variety of methods, including software tools, expert judgments and optimization algorithms. The findings can be used to improve the design of offshore platforms and make them more save, efficient and cost effective. The use of computer-aided techniques in the design process can enhance the accuracy, efficiency, and safety of the platform, as well as reduce the time and cost of the design process for our area of interest which is the Rio Del Rey basin. Moreover, these techniques can provide a better understanding of the complex interactions between the platform, the ocean, and the environment, which is critical for the success of offshore operations.
2. Material and Methods
2.1. Material
2.1.1. Softwares
There were two softwares used for this work, the software are SOLIDWORKS and SACS. SOLIDWORKS was used for the design of the cellar deck layout while SACS was used for the design of the platform structure and its simulation. SACS software is a finite element structural analysis software application developed by Bentley Systems. It is used by engineers to design and analyze offshore structures, such as oil and gas platforms, wind farms, and floating platforms.
2.1.2. Standards
In order to design offshore platforms it is necessary to select an appropriate standard to follow in order to ensure safety of the platform. In offshore platform design and construction the standards used are the API standards. The API standards are a set of technical guidelines and requirements developed by the American Petroleum Institute (API). The selected API standard was the API RP 2A WSD which is a recommended practice pushed for the planning, designing and constructing fixed offshore platforms using working stress design (WSD).
2.2. Methods
Here the process that was used to design our platform was described. The methodology was broken down into three main parts given below:
1) Defining the parameters and standards required for the design.
2) The generation of the conceptual design of the platform.
3) The performing of the simulations and analysis to produce an optimal platform.
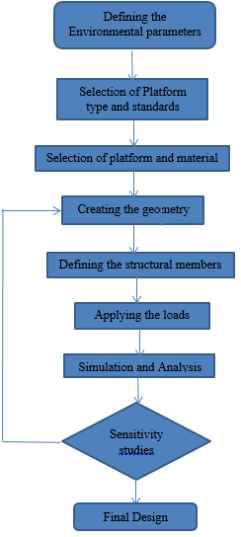
The above main parts where further broken into smaller task which were combined in order to produce a flowchart which summarizes the whole method of project. The flow chart is represented in Figure 1.
Figure 1. Flowchart of methodology.
2.2.1. Defining the Parameters and Standards Required for the Design
Available data
In order to design a platform in a specific area it is necessary to conduct a feasibility study to assess the potential of the site, the environmental impact, and the economic viability of the project. Therefore this feasibility of the site was performed and since our job was to design the structure we were mostly interested in environmental parameters and loads that are exerted on the platform during its service life. Table 1 below presents some necessary for the design.
Table 1. Equipment Parameters.

Equipment

Weight (lb)

Skid (lb)

Total (lb)

Dimensions (m)

Seperator

14100

1400

15500

1.5x3

Valves

654

100

745

0.244x0.435

Manifold

14000

1650

15650

4x2x1.2

Pig launcher

2400

500

2500

4x2x1.5

And the final data given was that of the wells and the conductor dimensions. Six wells were drilled. According to the reservoir capacity of the field calculations were made and the dimensions of the conductors of these wells were gotten as seen in Table 2 below.
Table 2. Conductor Dimensions.

Part

Dimension

OD cm

t cm

Conductors

60.96

1.59

Environmental parameters
Here various location parameters such as water depth, wind loads, wave and currents in the Rio Del Ray basin were collected. For most of these parameters there are two different conditions taken into consideration which are operating and storm conditions. Operating conditions refer to normal conditions on which the platform will normally be subjected to during its service life while storm conditions are extreme conditions which are hazards that may occur occasionally and exert extreme loads on the platform. The parameters are shown in Table 3 below.
Table 3. Parameters.

Parameter

Value

General Criteria

Water Depth

40m

Deck width

14

Deck length

20

Wind Load

Operating Conditions

20 m/s

Storm Conditions

31 m/s

Wave & Current Loads, Operating Conditions

Significant Wave Height

5.74 m

Wave Period

6.67 s

Tidal Total

0.69 m

Current Speed (surface)

1.17 m/s

Current Speed (seabed)

0.39 m/s

Load Waves & Current Storm Conditions

Maximum Wave Height

5.98 m

Wave Period

7.43 s

Tidal Total

1.2 m

Current speed (surface)

1.3 m/s

Current speed (seabed)

0.5 m/s

Storm surge

1.20 m

Marine Growth

Adding OD tubular member

0.025 – 0.05m

2.2.2. Selection of Platform Type
After defining the parameters it was necessary to select the platform type before in order to select the appropriate standard. In order to select the best platform type the main factors that were taken into account were the water depth and the environmental parameters (e.g., wave heights, currents, wind speeds). Also other factors include: Stability, Durability, Cost-effectiveness, Flexibility, and Environmental impact.
2.2.3. Material Selection
There are a wide variety of steel used in the designing of offshore platform so in order to choose our desired material the following factors were taken into account. Strength, Weldability, Corrosion resistance, Cost.
2.2.4. Creating the Geometry
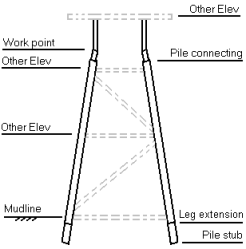
This involved creating the 3D model of the platform in SACS using the platform dimensions, including the dimensions of the legs, deck, and other components. A representation of the elevations is shown in Figure 2 below. We also identified Leg Data, Conductor Data, Connectivity Data, Deck Girder. Table 4 below presents Elevations data.
Figure 2. Elevations.
Table 4. Elevations data.

Name

Elevation (m)

Work point

3

Mudline

-40

Pile stud

-40

Pile connection

2

Cellar deck

7

Main deck

11

Heli deck

15

Brace elevations

-40,-26.4,-12.7 & 1

2.2.5. Defining the Structural Members
This involves defining the structural members that make up the platform, such as the legs, bracings, and deck beams. The properties of each member can be defined in SACS, including the material properties, cross-sectional properties, and boundary conditions. A grouping of parts was done in order to facilitate the structural defining of each member. A typical offshore platform is made up of two types of members which are I beams which are the girders that support the frame of the deck and hollow cylindrical members which make up the piles and legs of the structure. In order to get the dimensions of these parts some calculations for deck beam and cylindrical member were done.
2.2.6. Applying the Loads
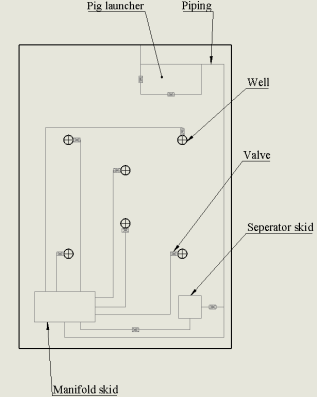
Cellar deck loads: In order to apply the loads it was necessary to know the locations of the particular loads and their area of action. Due to this fact, it was necessary to bring out the layout of each deck showing the locations of the equipment, wells, piping and other components of the deck. The cellar deck or first deck was designed to carry all processing equipment, the main deck or second deck was designed to carry maintenance equipment and finally the third or helideck was designed to accommodate helicopters to allow people access the platform. But due to the fact that our team was working mainly on the processing equipment a clear layout could only be generated for the cellar deck carrying the processing equipment. Therefore loads applied on the other decks could only be approximated. The layout was designed in solidworks. After designing the layout in solidworks, the loads were applied to the cellar deck according to their global coordinates. Firstly, the weights of the different equipment were added under footprint weight by inputting the different required dimensions. The coordinates of each geometrical centres of the equipment were calculated and inputted alone with other useful data.
All the weights of the different equipment were grouped under one group called EQPT.
After applying all the weight, they were converted into loads. To covert a weight into load the first thing that was done was to create our canter of roll. For our model our chosen centre of roll was the origin and it was given the name COR. The next thing was to create a loading condition for the particular load we were about to apply. After that the centre of roll COR was chosen and the traditional acceleration is in the z direction since we wanted our acceleration to act only in the z direction. 1G in z direction implies the acceleration due to gravity on the z axis is equal to the magnitude of the acceleration due to gravity which is equal to 9.81m/s. After this was done the changes where applied and the conversion of equipment weights to loads was complete.
Environmental loads: In order to add the environmental load the first step is to define the drag coefficient (Cd) for the cylindrical members of the structure. This was done in order to define the resistance the structure has to air and water forces. The coefficient of moment (Cm) is also added to define how the structure bends due to the force exerted by the flow of water and wind. The values for this are gotten from charts found in API RP 2A-WSD (API, 2012).
The next step was to add the marine growth to the structure beneath the sea. The structure has different thickness of marine growth due to the difference of concentration of living organisms at the different sea level. The lower you go the higher the roughness of the marine growth.
The next environmental condition was the sea state loads. Here the loads involved were current, wind, and dead loads. The initial crest position refers to the position at the beginning of the wave we want to analyse and the chosen position was zero degree. Here we also considered the waves coming from different directions to the platform structure these directions were in the 0°, 45° and 90° respectively. This is done in other to get the response of the platform at the different angles respectively. For each of these directions, both the operating conditions and the storm conditions were considered. Hence 6 load were created combinations all together were created.
After defining the different seastate loads in the software, the next step was to override the member. Overriding the member involves defining which members will take part in the hydrodynamic calculations or not. This was done in order to carter for the live loads (dynamic loads) in order to get much more realistic results after the simulation. Some members were overridden automatically by the software because they don’t take part in the hydrodynamic analysis such as the piles. The coefficient of members like the jacket legs were increased because they have high dynamic load (life loads) acting on them.
After that, the next step was to create appropriate load combination for analysis. Load combination was done by combining different load condition to create a design loading scenario which we desire to apply on the structure in order to analyse its response. There are two specific scenarios when it comes to analysing platform structures which are operating condition and storm condition. The overall operating condition of the platform was formed by the addition of the equipment loading and the operating seastate conditions while the overall storm condition of the platform was an addition of the equipment load and seastate storm condition loads. After thee grouping was done an additional loading factor was added in order to carter for live loads such as humans and weight of fluid that will act on the platform.
2.2.7. Running the Simulation and Analysing
Before doing the simulation analysis the first step was to check the model to make sure that the model has no errors such as disconnected members, undefined members or members that were defined but are not present in the model. Next thing to do in order to do the simulation and analysis, two separate files where created for the static and seastate conditions this is done in order to analyse seastate (loads due to environment) and static loads (loads due to structural weight and equipment) separately. After this we clicked the analysis generated option where we inputted the type of analysis and the type of data we want in the results and those we don’t want in the results. There are two main analysis parameters we were concerned with which are:
Deflected shapes analysis
This shows us a clear picture of the deflection and deformation of members after being subjected the different load cases or conditions. The deflected shapes under all the different loads where separately analysed in order to get a full picture of the behaviour and response of the structure to the different loads.
Unity Check analysis
It was used to identify different members of the structure which had failed while running the analysis. These members were members who would not be able to withstand the loads and will collapse during the life span of the structure therefore there was a need to redesign them. The unity check is synonymous to the stresses in the structure and is given by equation (1) below:
Unity Check (UC) =Actual peformanceMaximum allowable performance value(1)
According to API standards UC ≤ 1.
2.2.8. Sensitivity Studies
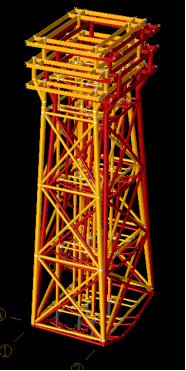
Based on the results of the analysis, changes to the design will be done to optimize it for performance and safety. This was done by iterating through the previous steps several times until a satisfactory design is obtained. As shown in Figure 3 in order to perform sensitivity studies, passing through conceptual design stage to the analysis stage was done until conditions of unity check and deflections are suitable as per the API standards. After performing the different steps mentioned above, a final optimum design was arrived at.
3. Results and Discussion
3.1. Initial Geometry Created
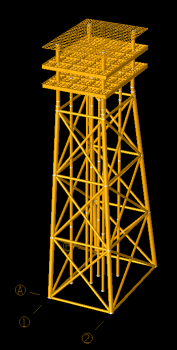
After inputting all the required data we obtained our initial conceptual wireframe geometry seen on Figure 3 below:
Figure 3. Initial conceptual wireframe design.
3.2. Structural Definitions Results
After performing the calculations on Deck Member and Jacket Member the following structural parameters were gotten as presented on Table 5 and Table 6 respectively. By using SolidWorks we could calculate the specific parameters it can be seen that a leg separation of 14m in the y-direction and 10m in the x-direction. In Table 5 shows the results of the calculations.
Table 5. Deck Member Data.

Deck Members

Members

Description

Cellar deck main girder

W30X108

Cellar deck secondary girder

W10X22

Maint deck main girder

W30X108

Maint deck secondary girder

W10X22

Heli deck main girder

W5X16

Heli deck secondary girder

W4X13

Table 6. Jacket Member Data.

Jacket Members

Member

Outer diameter (in)

Thickness (in)

Leg

38

0.84

Pile

33

0.6

Horizontal brace

21.5

0.38

Diagonal brace

21.5

0.38

X-Braces

24

0.625

Wishbone

24

0.625

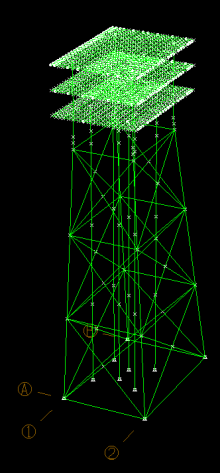
The formulas used here for calculations were assumed to neglect live loads such as wind, wave and currents hence leading to inaccurate initial conceptual results compared to those gotten by Lokman . He had more accurate results where his models maximum initial unity check was 1.5 compared to our values of 2.4. The design shows an initial conceptual design which is in accordance with the design done by Sadeghian and Ghasemi (2015) were they presented a similar three deck design, with a batter of 10, and the braces selected for all the sides were the X and Horizontal braces for a water depth of 60m . After imputing all of the above data into the software we were able to produce geometries of the platform as seen in Figure 4 below. A grouping of parts was done in order to facilitate the structural definition of each member and also to facilitate the analysis that was done later on.
Figure 4. Conceptual design.
There are three critical design parameters to be considered when designing offshore platforms which are; location parameters, functional requirements and total lifecycle considerations . The functional parameters of the platform refereed to oil and gas production, the total life cycle consideration as per API (2012) is 100 years hence are main concern here was the location parameter which were the environmental conditions for the Rio Del Ray Basin . The classification was done in accordance with the methodology developed by Sadeghian and Gheasemi were locational parameters were parameters of water depth, wind, wave, current loads and marine growth were considered for the design . Compared to the designing of the fixed offshore platform done by Romly where he considered only the marine growth in the Malaysian waters, the design was found to be more accurate and produce more satisfying results. According to Strukts fixed offshore platforms are suitable for water depths less than or equal to 520m, hence for a water depth of 40m this selection was suitable. Compared to other fixed offshore platforms such as Compliant towers presented by Hilyard , Jacket structures are found to be more economical. But due to the software limitations which are only limited to jacket structures the jacket fixed offshore structure was chosen because of many advantages it offers.
3.3. Analysis, Simulation and Optimization
3.3.1. Loading Results
In this section the results of the grouping and loading parameters considered in the methodology are presented.
Cellar deck Layout and Loading
Under the loading section a layout was needed in order to be able to estimate the area and location of each of the loads that occur at the cellar deck. Figure 5 show the result of the layout we got from designing in SolidWorks.
Figure 5. Cellar deck Layout.
After the layout was created we had a clear picture of the location of each load. But before applying the loads we needed to perform the grouping of the loads as shown in Table 7. Equipment load were grouped under footprint loads.
Table 7. Footprint Loads.

Equipment

Footprint ID

Weight (lb)

Skid (lb)

Total (lb)

Dimensions (m)

Seperator

SEPSKID

14100

1400

15500

1.5x3

Valves

VALSKID

654

100

745

0.244x0.435

Manifold

MANSKID

14000

1650

15650

4x2x1.2

Pig launcher

LAUSKID

2400

500

2500

4x2x1.5

Environmental Loading
The process of environmental loading according to API standards permitted to obtain Drag and Mass coefficients vs diameter and Marine growth and depth on Table 8 and Table 9 respectivelly. Table 10 presents the loading conditions with direction in operating conditions and Storm condition.
Table 8. Drag and Mass coefficients vs diameter.

Diameter

Drag coefficient (cd)

Mass coefficient (cm)

2.5

0.6

1.2

250

0.6

1.2

Table 9. Marine growth and depth.

Depth Area (m)

Thickness (m)

Density (tonne/m3)

Roughness (cm)

0-30

2.5

1.4

0.000254

30-40

5

1.4

0.000254

Table 10. Loading Conditions.

Load name

Load condition

Direction

Operating Conditions

P000

P045

45°

P090

90°

Storm condition

S000

S045

45°

S090

90°

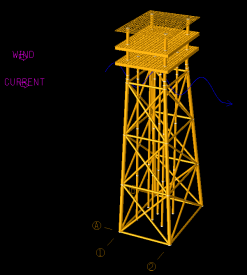
Figure 6 below shows a visual representation of the seastate for the first operating condition which is P000 which occur at angle 0°. Table 11 presents Load combination results. Load combinations are a combination of equipment loads and environmental loads. The loading factors added carter undefined life loads that will act on the platform.
Figure 6. Wave, wind and current visualisation at 00 (The blue line represents the wave prophile).
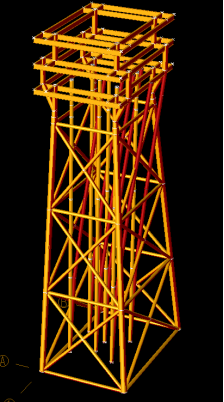
Table 11. Load combination results.

Load combination

Load conditions

Loading Factor

OPR1

EQPT + P000

1.20

OPR2

EQPT + P045

1.20

OPR3

EQPT + P090

1.20

STM0

EQPT + S000

1.33

STM2

EQPT + S045

1.33

STM3

EQPT + S090

1.33

3.3.2. Simulation and Analysis Results
Deflected shape
After performing the deflection analysis as described earlier we had the results for the first deflected shape analysis as shown on Figure 7 below and the results of maximum deflections are presented on Table 12. After the analysis we had a clear picture of the behaviour of our platform when subjected to the different load conditions which was designed to act on them following our API standards. We checked the deflection diagram of the structure for all the six loading conditions. As shown in Figure 7 the structure was shown to have a great deflection of the conductors for all 6 conductors in the 6 different directions. This was because the conductors had no support hence we had to redesign the conductors to reduce its deflections in those directions.
Figure 7. Graphical representation of deflected members.
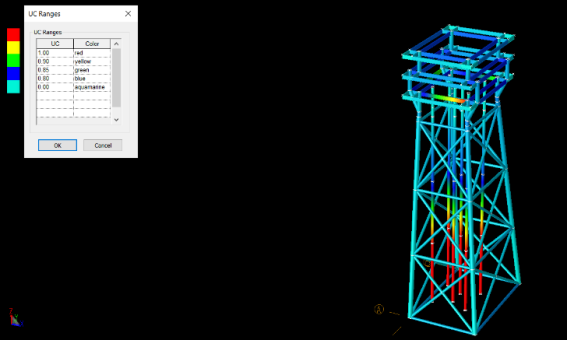
Table 12. Maximum Deflections.

Load Case

X-Direction

Y-direction

Z-Direction

Joint

Deflection (cm)

Joint

Deflection (cm)

Joint

Deflection (cm)

OPR1

645C

301.0008

204P

-0.1250

92FD

-1.3264

OPR2

645C

216.2528

645C

216.2530

93FD

-1.3098

OPR3

91FD

-1.6574

645C

295.8692

93AD

-1.4760

STM0

641C

445.2138

204P

-0.1882

92FD

-1.9439

STM2

645C

318.3321

645C

313.3323

93FD

-1.9123

STM3

91FD

-2.1729

645C

434.3751

94BD

-2.0554

The maximum deflections could be observed in Table 12. These negative signs in that table indicate that the joint moves in the negative directions to the reference axis. The highest values of the deflections are for joints 645C and 641C are the joints of the topmost part of a conductor where it connects to the cellar deck. As seen above values above 100cm are not feasible because it means that the structure will move more than 1m which is not suitable and may cause a lot of accidents. Values below 10cm are more ideal in this case. So there was a need to redesign it.
To mitigate this, bracings where added at the following levels
Z = +7.0m (Cellar Deck)
Z = +1m
Z = -12.7m
Z = -26.4m
Z = -40m
Where Z = 0 is the sea level therefore the positive and negative signs represent levels above and below the sea level respectively.
The diagrams above show the load, shear and moment along the length of the member which is from joint 141C to 241C. The load, shear and moment indicated zero because the load was acting parallel to the x-axis hence there was no moment in the y-axis and shear in the y-axis because there was no rotation in the y-axis.
Unity check
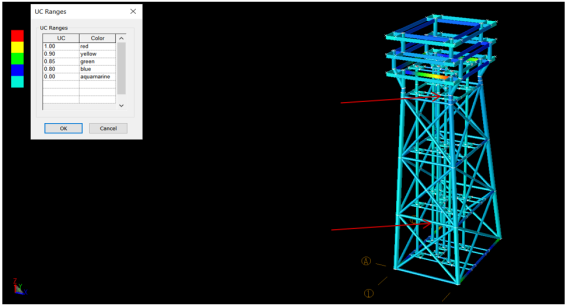
After performing the initial unity check on our conceptual design the following results where gotten as presented in Figure 8 and Table 13 presents the Unity Check Ratio and Stresses for Conductor.
Figure 8. Stress Distribution.
Table 13. The unity check ratio for the different stresses in the conductor.

Stress

Actual (kgsmm)

Allowable (kgsmm)

Ratio

Euler

-0.59

25.03

0.02

Fa

-0.59

11.93

0.05

-Fby

0.00

18.99

0.00

-Fbz

45.55

18.99

2.40

Fv

0.21

10.13

0.02

Ftor

0.00

10.13

0.00

The first results gotten for the unity check analysis provided the information that the conductors had failed. This problem was found to be solved when supports were added to the conductors. For this case study the closest conductor to the lower left corner of the deck the segment in particular was from joint 141C to 241C. This is the portion that elongates from the mudline (-40m) to -26.4m. The member is indicated in red on Figure 8 above. For our choosen case which is the STM0 with is the storm condition acting from zero degree, the ratio actual bending stress about the z-axis is 2.4 indicating that the actual bending stress is higher than allowable bending stress.
3.3.3. Results After Sensitivity Studies (Optimization)
After the sensitivity studies was done we got the following results on deflected shapes and Unity Check. The unity check is a ratio which is used to determine members that will fail in the life span of the structure, the graphical results of our first analysis can be clearly seen. The members in red indicated failed members and hence they needed to be redesigned. The combined unity check option gave us the maximum unity check ratio of a given member during analysis which helped to identify these members and resigned them.
Deflected shapes after sensitivity studies
Concerning Deflected shapes results are presented on Figure 9 and the maximum deflection after redesign in Table 14. After the redesign was done the results were observed as shown in Figure 9. We could observe that now the seastate loads (all the environmental loads) are now more evenly distributed throughout the structure which increases the strength of the structure reducing the deflection due to the loads. But there was moment in the z-axis and hence shear in the y-axis and the distribution of load. After redesigning the conductors to add bracings we did the unity stress check again and we had the found in Table 14. From the results in the table, it was observed that the maximum ratio for the conductor member is 0.13 which therefore implies that the model conductors did not fail. Therefore there is no need for resigning the conductors and braces any further.
Table 14. Maximum deflection after redesign.

Load Case

X-Direction

Y-direction

Z-Direction

Joint

Deflection (cm)

Joint

Deflection (cm)

Joint

Deflection (cm)

OPR1

446C

4.1222

204P

-0.1580

0059

-5.8039

OPR2

445C

2.3537

445C

1.9029

0057

-5.8597

OPR3

91FD

-1.7859

445C

2.6423

0057

-5.9488

STM0

93FD

8.1956

204P

-0.2355

0059

-7.6699

STM2

93FD

4.8813

94BD

3.1472

0057

-7.7634

STM3

91FD

-2.3567

94BD

4.4237

0057

-7.9172

In Table 14 we could observe the final maximum deflections in the structure. From these final deflections we notice that for operating condition (OPR), the maximum displacement is was the x-direction and was equal to 4.1cm, in the y-direction it was equal to 2.6cm and in the z-direction it was equal to -5.9. While for the storm conditions (STR), the maximum displacement is was the x-direction and was equal to 8.2cm, in the y-direction it was equal to 4.4cm and in the z-direction it was equal to -7.9. Taking into consideration that operating conditions are real conditions in which our platform is able to withstand the environmental conditions without stopping its functioning and Storm conditions are conditions where the platform withstands critical and harsh environmental conditions which are designed to test the structure to its limit, a conclusion was arrived at that the values in Table 14 are reasonable in accordance with maximum deflections acceptable by the API. Compared to the past designs done by Zhao and Xie and Zare and Sadeghi where other methods of analysis such as complex and finite element methods the analysis done in this work is simpler and give more accurate results.
Unity Check after sensitivity studies
Concerning Unity Check results are presented on Figure 10 as stress distribution about redesign. Table 15 presents Unity Check Ratio and Stresses for Conductor and Table 16 presents Unity Check Ratio and Stresses for Cellar deck beam after redesign. Table 17 presents the Final Dimensions Main Girders and Table 18 presents Final dimensions of tubular members.
Figure 10. Unity check and stress distribution about redesign.
It was observed on the structure that there is still a red colour indication at the level of the cellar deck beam as seen in Figure 10 above. So it was necessary to check that the value for the unity check did not exceed 1.
Table 15. Unity Check Ratio and Stresses for Conductor after redesign.

Stress

Actual (kgsmm)

Allowable (kgsmm)

Ratio

Euler

-0.59

25.03

0.02

Fa

-.59

11.93

0.05

-Fby

0.01

18.99

0.00

-Fbz

2.50

18.99

0.13

Fv

0.04

10.13

0.00

Ftor

0.00

10.13

0.00

Table 16. Unity Check Ratio and Stresses for Cellar deck beam after redesign.

Stress

Actual (kgsmm)

Allowable (kgsmm)

Ratio

Euler

0.00

3.12

0.00

Fa

0.74

15.19

0.05

-Fby

-5.77

5.74

1.00

-Fbz

-0.82

18.99

0.04

Fv

-0.01

10.13

0.00

Ftor

-1.07

10.13

0.11

Table 17. Final Dimensions Main Girders.

Main Girder

Deck

Final

Section (cm)

Main

W30X108

Cellar

W30X108

Heli

W30X108

Table 18. Final dimensions of tubular members.

Tubular Members

Part

Final

Section

OD cm

t cm

Cellar Deck leg

96.52

2.13

Main Deck leg

96.52

2.13

Heli Deck leg

96.52

2.13

Cellar Deck Brace

96.52

2.13

Jacket Leg

96.52

2.13

Jacket Braces

54.61

0.97

Conductor Braces

38.10

0.97

Conductor

60.96

1.59

Pile

83.82

1.52

From Table 15 it was observed that the maximum unity check ratio is for the maximum bending stress along the y-axis and it is equal to 1.001 (≈1) which is valid since it satisfies the conditions proposed in equation (API) . This means that the actual bending stress was equal to the allowable bending stress in the y-axis there the part will not fail. Also this value appears for storm conditions so reason more for allowing the structure as it is. From the design done by Romly is final model’s unity check was found to be 0.98 which was also in accordance to the API standard. Comparing our final unity results to that obtained by Romly we see that the unity check of this work (UC = 1) is higher. This is because the design done by Romly took only the marine growth as it parameter.
As observed from the Table 18 above, for our chosen case which is the STM0 with is the storm condition acting from zero degree, the ratio actual bending stress about the z-axis is 2.4 indicating that the actual bending stress is higher than allowable bending stress.
3.3.4. Analysis and Sensitivity Studies
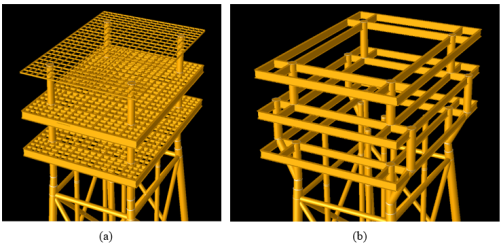
After performing the analysis the error box appeared. These error dialog box was traced to the members which are the 6 conductors connected to the cellar deck and some other members at the deck. This led to the redesigning of the deck structures by reducing members at the decks and conductor length at the cellar deck. Also after careful analysis of the model it was discovered that there was interference between the layout and the deck supports so we needed to redesign as presented in Figure 11.
Figure 11. Redesign after first Model check a) Initial Conceptual Design b) first redesign.

4. Conclusion
Each platform structure is designed based on the functional needs, location and the environmental conditions the platform will be subjected to. Here a comprehensive design of an offshore jacket structure was for the field-X Rio Del Ray basin. This work was able to perform the necessary analysis on the structure based on the given parameters. The main deck which had focused was the cellar deck which carried our processing equipment. With the information provided for the location functional and environmental data using SACS software and SOLIDWWORKS different loads were applied to the structure and analyzed using the API standards. With the information provided both operating and storm combinations of loads were created in order to simulate the summation of loads the platform will be subjected to. After the analysis the data of the failed members were collected and redesigned to optimize the platform. With this work the following specific conclusions were arrived at. The maximum unity check value is 1 and it occurs under Storm condition 1 (STM0) which implies that the maximum stress is applied on the structure at an angle of 0° which is parallel to the structures x-axis. The magnitude of the maximum stress is 5.77kg/mm2. This corresponding to the bending stress occurring in the local y-axis. For all the different operating condition, the unity check for the stress analysis in the structure remains below one (UC≤1). Hence ensuring a safe and efficient structure during normal operating conditions. After analysis we could conclude that the maximum deflection in the structure is 8.2cm with reference to the y-axis which occurs at STM0. This displacement is also caused by a bending stress of magnitude 5.77kg/mm2 in the y-axis.
Abbreviations

API

American Petroleum Institute

OPEC

Organization of the Petroleum Exporting Countries

FEA

Finite Element Analysis

IOGP

International Association of Oil & Gas Producers

FEA

Finite Element Analysis

IOGP

International Association of Oil and Gas Producers

FPSO

Floating Production Storage and Offloading

MATLAB

MATrice LABoratory

OPR

Operating Condition

STR

Storm Conditions

Author Contributions
Noutegomo Boris: Conceptualization, Data curation, Formal Analysis, Investigation, Methodology, Project administration, Resources, Software, Supervision, Validation, Visualization, Writing – original draft, Writing – review & editing
Conflicts of Interest
The author declares no conflicts of interest.
References
[1] Tower Resources plc. 2015. Cameroon. Accessed on 20.05.2023 2: 33pm
[2] Arild Rogne (2013). Classification of water depth. Introduction to main type of mobile offshore units, DNV 2013. P 9.
[3] Frank Sliggers (2005). P180 Development & Operation of Production Systems. Offshore Structures and Subsea Engineering. Shell Exploration & Production Ltd. P 29.
[4] Al-Sulaiman, F. A., & Rahman, S. A. (2019). A review of offshore oil and gas exploration and production in Saudi Arabia. Journal of Petroleum Science and Engineering, 176, 1060-1075.
[5] Abass, A. A., Adelaja, A. O., & Ukaegbu, V. U. (2018). Marginal field development: an overview and challenges in Nigeria. Journal of Petroleum Exploration and Production Technology, 8(4), 1253-1262.
[6] Frydenberg, O. (1981). Report of the Commission of Inquiry into the Accident to the Alexander L. Kielland on 27th March 1980. Norwegian Ministry of Justice.
[7] Ngwang, E., & Njike, J. (2018). Marine environment and offshore platform design in Cameroon. International Journal of Scientific & Technology Research, 7(09), 38-44.
[8] Tchinda, J. B., Djomou, F., & Tchinda, R. (2016). Wave and wind loads on offshore structures in Cameroon. Journal of Marine Science and Application, 15(3), 343-348.
[9] Zhang, C., Li, Y., & Wu, Y. (2018). Finite element analysis for offshore platform structures: A review. Journal of Offshore Mechanics and Arctic Engineering, 140(2), 021601.
[10] International Association of Oil and Gas Producers. (2019). Offshore installation safety. IOGP Report 501.
[11] Zhang, J., Li, X., Zhang, X., & Liu, X. (2020). A review of offshore platform lifecycle assessment and management. Journal of Cleaner Production, 256, 120433.
[12] Lake, L. W. (Ed.). (2007). Petroleum Engineering Handbook. Society of Petroleum Engineers.
[13] Lokman, M. A. A. B. M. (2013). Conceptual design support tool for offshore platform jacket design. Universiti Teknologi Malaysia.
[14] Romly, M. (2014). Design of fixed offshore platform to marine growth thickness in Malaysian water. [Final Year Project]. Universiti Teknologi PETRONAS.
[15] Umar, A. A. (2010). Design for safety framework for offshore oil and gas platforms. Journal of Loss Prevention in the Process Industries, 23(5), 543-552.
[16] Sadeghian, M., & Ghasemi, F. (2015). Development of a methodology for the conceptual design of offshore jacket platforms. Journal of Marine Science and Technology, 20(4), 439-451.
[17] Zare, A. R., & Sadeghi, E. (2016). Application of finite element method for the structural analysis of offshore platforms. Journal of Marine Science and Technology, 21(3), 329-341.
[18] Zhao, X., & Xie, H. (2017). Offshore platform design using genetic algorithm based optimization. Journal of Marine Science and Technology, 22(2), 193-205.
[19] API (2012). API RP 2A-WSD—Derivation of Working Stress Design; American Petroleum Institute (API): Washington, DC, USA, 2012.
[20] Strukts 2012. Types of offshore platforms. Accessed on 20.05.2023 4: 09 pm.
[21] Hilyard, Joseph. 2012. Oil and Gas Industry: A Nontechnical Guide. Tulsa, OK, USA: PennWell.
Cite This Article
  • APA Style

    Boris, N. (2026). Design and Analysis of an Offshore Platform for Oil and Gas Production in Gulf of Guinea Basin. International Journal of Mechanical Engineering and Applications, 14(3), 43-59. https://doi.org/10.11648/j.ijmea.20261403.11

    Copy | Download

    ACS Style

    Boris, N. Design and Analysis of an Offshore Platform for Oil and Gas Production in Gulf of Guinea Basin. Int. J. Mech. Eng. Appl. 2026, 14(3), 43-59. doi: 10.11648/j.ijmea.20261403.11

    Copy | Download

    AMA Style

    Boris N. Design and Analysis of an Offshore Platform for Oil and Gas Production in Gulf of Guinea Basin. Int J Mech Eng Appl. 2026;14(3):43-59. doi: 10.11648/j.ijmea.20261403.11

    Copy | Download

  • @article{10.11648/j.ijmea.20261403.11,
      author = {Noutegomo Boris},
      title = {Design and Analysis of an Offshore Platform for Oil and Gas Production in Gulf of Guinea Basin},
      journal = {International Journal of Mechanical Engineering and Applications},
      volume = {14},
      number = {3},
      pages = {43-59},
      doi = {10.11648/j.ijmea.20261403.11},
      url = {https://doi.org/10.11648/j.ijmea.20261403.11},
      eprint = {https://article.sciencepublishinggroup.com/pdf/10.11648.j.ijmea.20261403.11},
      abstract = {Offshore oil and gas platforms are critical infrastructures for the extraction of hydrocarbons from the sea bed. The design of these platforms is complex and requires multidisciplinary approaches which include following standards such as the API standards. The aim of this study was to design and analyze an offshore platform structure that could be used in the Gulf of Guinea Basin to extract oil and gas from the sub sea bed. In order to design a safe and reliable structure, factors such as the functions and location parameters were taken into account. With these factors loading conditions for the weight of equipment, water depth, currents and wind were designed and used in analyzing the structure. Firstly those parameters permitted to select the platform type which was the fixed offshore jacket platform due to its stability in shallow water regions and according to the API RP 2A WSD standard. Secondly a conceptual model for the offshore platform was designed in SACS software by selecting the appropriate material which was A36 steel mainly due to its weldablity. Solidworks were used to design the cellar deck layout. Finally the structure was optimized by performing stress and deflection analysis. The maximum deflection and unity check ratio were found to be 8.6cm and 1.0 respectively. These values were both cause by a bending stress of 5.77kg/mm2 acting in the local y-axis of the structure. In accordance to the API standards a comprehensive platform design was generated to withstand the environmental conditions of Gulf of Guinea Basin.},
     year = {2026}
    }
    

    Copy | Download

  • TY  - JOUR
    T1  - Design and Analysis of an Offshore Platform for Oil and Gas Production in Gulf of Guinea Basin
    AU  - Noutegomo Boris
    Y1  - 2026/07/11
    PY  - 2026
    N1  - https://doi.org/10.11648/j.ijmea.20261403.11
    DO  - 10.11648/j.ijmea.20261403.11
    T2  - International Journal of Mechanical Engineering and Applications
    JF  - International Journal of Mechanical Engineering and Applications
    JO  - International Journal of Mechanical Engineering and Applications
    SP  - 43
    EP  - 59
    PB  - Science Publishing Group
    SN  - 2330-0248
    UR  - https://doi.org/10.11648/j.ijmea.20261403.11
    AB  - Offshore oil and gas platforms are critical infrastructures for the extraction of hydrocarbons from the sea bed. The design of these platforms is complex and requires multidisciplinary approaches which include following standards such as the API standards. The aim of this study was to design and analyze an offshore platform structure that could be used in the Gulf of Guinea Basin to extract oil and gas from the sub sea bed. In order to design a safe and reliable structure, factors such as the functions and location parameters were taken into account. With these factors loading conditions for the weight of equipment, water depth, currents and wind were designed and used in analyzing the structure. Firstly those parameters permitted to select the platform type which was the fixed offshore jacket platform due to its stability in shallow water regions and according to the API RP 2A WSD standard. Secondly a conceptual model for the offshore platform was designed in SACS software by selecting the appropriate material which was A36 steel mainly due to its weldablity. Solidworks were used to design the cellar deck layout. Finally the structure was optimized by performing stress and deflection analysis. The maximum deflection and unity check ratio were found to be 8.6cm and 1.0 respectively. These values were both cause by a bending stress of 5.77kg/mm2 acting in the local y-axis of the structure. In accordance to the API standards a comprehensive platform design was generated to withstand the environmental conditions of Gulf of Guinea Basin.
    VL  - 14
    IS  - 3
    ER  - 

    Copy | Download

Author Information