Cefpodoxime Proxetil (CP) is an oral prodrug. Its extremely poor solubility in the biological fluids, is what causes its poor bioavailability. And since dissolution is rate-limiting stage in attaining the required bioavailability, co-grinding technique was exploited, it comprises grinding the medicine with excipients (one or more excipients) to create nanoparticles. Formulations were prepared by dry co-grinding technique, for different durations 5, 10 and 20 minutes either alone or with the selected carrier using mortar and pestle. Different premixes of CP as binary or ternary mixtures using fixed concentration of the API (260mg of CP equivalent to 200mg Cefpodoxime base) along with various ratios of other additives. Carriers used were Aerosil 200, Glycine, polyvinylpyrrolidone (PVP) K25 and HPMC E6. The prepared formulations were characterized through dissolution testing, FTIR and DSC techniques. Dissolution parameters such as dissolution efficiency (DE%), amount released after 5 minutes (Q5) and 60 minutes (Q60) were calculated. Statistical evaluation covering student’s T-test, f1, dissimilarity factor and f2, similarity factor was calculated. The findings from the binary mixtures of CP with Aerosil 200 has shown to be very promising, and hence, ternary mixtures of the CP/Aerosil 200 and one of the three carriers -namely, glycine, PVP K25 and HPMC E6- at the ratio of 1:1:1, were separately co-grounded to give mixtures where Q5 ranged from 60% – 68%, Q60 ranged from 80 to 100% and DE% ranged from 67-82%. These results are suggested augmenting effect of the large surface area of Aerosil 200 and the hydrophilic nature of the other carriers. Upon decreasing the weight ratios of Aerosil 200 and other carriers to 1:0.25:0.5, PVP K25 was the most effective tested polymer in terms of improving drug dissolution rate at the lowest weight ratio.
| Published in | Pharmaceutical Science and Technology (Volume 9, Issue 2) |
| DOI | 10.11648/j.pst.20250902.11 |
| Page(s) | 37-52 |
| Creative Commons |
This is an Open Access article, distributed under the terms of the Creative Commons Attribution 4.0 International License (http://creativecommons.org/licenses/by/4.0/), which permits unrestricted use, distribution and reproduction in any medium or format, provided the original work is properly cited. |
| Copyright |
Copyright © The Author(s), 2025. Published by Science Publishing Group |
Cefpodoxime Proxetil, Co-grinding, Aerosil 200, HPMC E6, PVP K25, Glycine
Substance | Structure | Melting point (°C) |
|---|---|---|
Cefpodoxime Proxetil [20] |
| 111 – 113°C |
Aerosil 200 [21] |
| 1600°C |
HPMC E6 (Hypromellose) [22] |
| 190-200°C |
Glycine [23] |
| 232–236°C |
PVP K25 (Povidone) [24] |
| Softens at 150°C |
Formula | CP | Aerosil 200 | Glycine | PVP K25 | HPMC E6 |
|---|---|---|---|---|---|
Pure drug (CP) | 1 | --- | --- | --- | --- |
F1 | 1 | --- | --- | --- | --- |
F2 | 1 | 1 | --- | --- | --- |
F3 | 1 | --- | 1 | --- | --- |
F4 | 1 | --- | --- | 1 | --- |
F5 | 1 | --- | --- | --- | 1 |
F6 | 1 | 1 | 1 | --- | --- |
F7 | 1 | 1 | --- | 1 | --- |
F8 | 1 | 1 | --- | --- | 1 |
F9 | 1 | 0.25 | --- | 0.5 | --- |
F10 | 1 | 0.25 | --- | --- | 0.5 |
Formula | % Released at Q5 | % Released at Q60 | DE 60 min% |
|---|---|---|---|
Pure drug | 8 ± 0.51 | 23± 0.25 | 16% |
F1pure | 31± 0.48 | 66± 0.18 | 46% |
F2 CP/Aero | 9 ± 0.39 | 49± 0.26 | 52% |
F3 CP/glycine | 12± 0.43 | 49± 0.24 | 31% |
F4 CP/PVP | 42± 0.24 | 60± 0.13 | 31% |
F5 CP/HPMC | 8± 0.46 | 47± 0.40 | 37% |
F6 CP/Aero/glycine | 68 ±0.09 | 95 ±0.09 | 82% |
F7 CP/Aer/PVP | 60 ± 0.13 | 100 ±0.10 | 81% |
F8 CP/Aer/HPMC | 62± 0.24 | 88± 0.26 | 76% |
F9 CP/Aer/PVP low | 55± 0.30 | 80± 0.29 | 69% |
F10 CP/Aer0.25/HPMC | 46± 0.27 | 81± 0.25 | 68% |
Formulation | Difference factor (%) (f1) | Similarity factor (%) (f2) |
|---|---|---|
F1 | 45.7 | 25.1 |
F2 | 40.8 | 22.9 |
F3 | 114.2 | 41.6 |
F4 | 117.9 | 41.0 |
F5 | 80.3 | 35.4 |
F6 | 22.7 | 10.2 |
F7 | 23.2 | 10.5 |
F8 | 25.0 | 12.3 |
F9 | 27.9 | 14.7 |
F10 | 29.3 | 15.6 |
Formulation | T- test value (unequal variance) |
|---|---|
F1 | 0.012 |
F2 | 0.005 |
F3 | 0.155 |
F4 | 0.185 |
F5 | 0.073 |
F6 | 0.003 |
F7 | 0.004 |
F8 | 0.003 |
F9 | 0.004 |
F10 | 0.005 |
CP | Cefpodoxime Proxetil |
PVP | Polyvinylpyrrolidone |
HPMC | Hydroxypropyl Methylcellulose |
FTIR | Fourier Transform Infrared Spectroscopy |
DSC | Differential Scanning Calorimetry |
DE% | Dissolution Efficiency Percent |
°C | Degree Celsius |
mW | Milliwatt |
| [1] | E. A. Essa and M. Dwaikat, “Enhancement of Simvastatin dissolution by surface solid dispersion: effect of carriers and wetting agents,” Journal of Applied Pharmaceutical Science, vol. 5, no. 1, pp. 046–053, 2015, Accessed: Dec. 09, 2023. [Online]. Available: |
| [2] | M. Barzegar-Jalali et al., “Enhancement of Dissolution Rate and Anti-inflammatory Effects of Piroxicam Using Solvent Deposition Technique,” Drug Development and Industrial Pharmacy, vol. 28, no. 6, pp. 681–686, Jan. 2002, |
| [3] | H. Friedrich, A. Nada, and R. Bodmeier, “Solid State and Dissolution Rate Characterization of Co-Ground Mixtures of Nifedipine and Hydrophilic Carriers,” Drug Development and Industrial Pharmacy, vol. 31, no. 8, pp. 719–728, Jan. 2005, |
| [4] |
L. Kürti, Á. Kukovecz, G. Kozma, R. Ambrus, M. A. Deli, and P. Szabó-Révész, “Study of the parameters influencing the co-grinding process for the production of meloxicam nanoparticles,” Powder technology, vol. 212, no. 1, pp. 210–217, 2011, Accessed: Dec. 09, 2023. [Online]. Available:
https://www.sciencedirect.com/science/article/pii/S0032591011002750 |
| [5] |
K. Moribe, A. Pongpeerapat, Y. Tozuka, and K. Yamamoto, “Drug nanoparticle formation from drug/HPMC/SDS ternary ground mixtures,” Die Pharmazie-An International Journal of Pharmaceutical Sciences, vol. 61, no. 2, pp. 97–101, 2006, Accessed: Dec. 09, 2023. [Online]. Available:
https://www.ingentaconnect.com/content/govi/pharmaz/2006/00000061/00000002/art00003 |
| [6] |
Zapata, C. Frances, N. Le Bolay, and S. Molina-Boisseau, “Production of small composite particles by co-grinding in a media mill: Characterization of the granulometric and the mechanical properties,” Chemical Engineering Research and Design, vol. 82, no. 5, pp. 631–636, 2004, Accessed: Dec. 09, 2023. [Online]. Available:
https://www.sciencedirect.com/science/article/pii/S0263876204725368 |
| [7] | V. Mundhe, “Cocrystalization: an alternative approach for solid modification,” Journal of Drug Delivery and Therapeutics, vol. 3, no. 4, pp. 166–172, 2013, Accessed: Dec. 09, 2023. [Online]. Available: |
| [8] | T. Friščić and W. Jones, “Recent Advances in Understanding the Mechanism of Cocrystal Formation via Grinding,” Crystal Growth & Design, vol. 9, no. 3, pp. 1621–1637, Mar. 2009, |
| [9] | K. Mahapatra and S. K. Bharti, Medicinal chemistry with pharmaceutical product development. CRC Press, 2019. Accessed: Dec. 09, 2023. [Online]. Available: |
| [10] |
B. Jagadish, R. Yelchuri, H. Tangi, S. Maroju, and V. U. Rao, “Enhanced dissolution and bioavailability of raloxifene hydrochloride by co-grinding with different superdisintegrants,” Chemical and Pharmaceutical Bulletin, vol. 58, no. 3, pp. 293–300, 2010, Accessed: Dec. 09, 2023. [Online]. Available:
https://www.jstage.jst.go.jp/article/cpb/58/3/58_3_293/_article/-char/ja/ |
| [11] |
S. A. El-Gizawy, M. A. Osman, M. F. Arafa, and G. M. El Maghraby, “Aerosil as a novel co-crystal co-former for improving the dissolution rate of hydrochlorothiazide,” International journal of pharmaceutics, vol. 478, no. 2, pp. 773–778, 2015, Accessed: Dec. 09, 2023. [Online]. Available:
https://www.sciencedirect.com/science/article/pii/S037851731400934X |
| [12] |
K. Yamamoto, M. Nakano, T. Arita, Y. Takayama, and Y. Nakai, “Dissolution behavior and bioavailability of phenytoin from a ground mixture with microcrystalline cellulose,” Journal of Pharmaceutical Sciences, vol. 65, no. 10, pp. 1484–1488, 1976, Accessed: Dec. 09, 2023. [Online]. Available:
https://www.sciencedirect.com/science/article/pii/S0022354915409797 |
| [13] |
S.-C. Shin, I.-J. Oh, Y.-B. Lee, H.-K. Choi, and J.-S. Choi, “Enhanced dissolution of furosemide by coprecipitating or cogrinding with crospovidone,” International journal of pharmaceutics, vol. 175, no. 1, pp. 17–24, 1998, Accessed: Dec. 09, 2023. [Online]. Available:
https://www.sciencedirect.com/science/article/pii/S0378517398002609 |
| [14] | Mitrevej, N. Sinchaipanid, and V. Junyaprasert, “Effect of Grinding of β-Cyclodextrin and Glibenclamide on Tablet Properties. Part I. in vitro,” Drug Development and Industrial Pharmacy, vol. 22, no. 12, pp. 1237–1241, Jan. 1996, |
| [15] |
M. Sevukarajan, T. Bachala, R. Sodanapalli, and R. Nair, “Co-Crystals: An Emerging Trend in Pharmaceutical Industry,” Research Journal of Pharmacy and Technology, vol. 4, no. 6, pp. 891–902, 2011, Accessed: Dec. 09, 2023. [Online]. Available:
https://www.indianjournals.com/ijor.aspx?target=ijor:rjpt&volume=4&issue=6&article=008 |
| [16] | Pharmacia and Upjohn, “Vantin,” Pamphlet, 2013. |
| [17] | Sanofi, Aventis, “Orelox,” Pamphlet, 2017. |
| [18] |
V. K. Kakumanu, V. Arora, and A. K. Bansal, “Investigation of factors responsible for low oral bioavailability of cefpodoxime proxetil,” International journal of pharmaceutics, vol. 317, no. 2, pp. 155–160, 2006, Accessed: Dec. 09, 2023. [Online]. Available:
https://www.sciencedirect.com/science/article/pii/S0378517306002213 |
| [19] | R. Raymond, Handbook of pharamceutical excipients, 6th ed. USA: Pharmaceutical press, American Pharmaceutical Association. |
| [20] | PubChem, “Cefpodoxime.” Accessed: Dec. 11, 2023. [Online]. Available: |
| [21] | Medisca, “Silicon dioxide,” MSDS, 2020. |
| [22] | PubChem, “HYPROMELLOSE 2910 (6 MPA. S).” Accessed: Jun. 14, 2025. [Online]. Available: |
| [23] | PubChem, “Glycine.” Accessed: Jun. 14, 2025. [Online]. Available: |
| [24] | PubChem, “1-Ethenyl-2-pyrrolidinone homopolymer.” Accessed: Jun. 14, 2025. [Online]. Available: |
| [25] | “USP Monographs: Cefpodoxime Proxetil Tablets.” Accessed: Jun. 14, 2025. [Online]. Available: |
| [26] | G. M. El Maghraby and A. H. Alomrani, “Effect of binary and ternary solid dispersions on the in vitro dissolution and in-situ rabbit intestinal absorption of gliclazide,” Pak J Pharm Sci, vol. 24, no. 4, pp. 459–468, 2011, Accessed: Dec. 09, 2023. [Online]. Available: |
| [27] |
K. A. Khan, “The concept of dissolution efficiency,” Journal of pharmacy and pharmacology, vol. 27, no. 1, pp. 48–49, 1975, Accessed: Dec. 09, 2023. [Online]. Available:
https://academic.oup.com/jpp/article-abstract/27/1/48/6196131 |
| [28] | Helen Chan and B. H. Stewart, “Physicochemical and drug-delivery considerations for oral drug bioavailability,” Drug Discovery Today, vol. 1, no. 11, pp. 461–473, Nov. 1996, |
| [29] |
J. W. Moore and H. H. Flanner, “Mathematical comparison of dissolution profiles,” Pharmaceutical technology, vol. 20, no. 6, pp. 64–74, 1996, Accessed: Dec. 09, 2023. [Online]. Available:
https://pascal-francis.inist.fr/vibad/index.php?action=getRecordDetail&idt=3112822 |
| [30] | V. P. Shah, Y. Tsong, P. Sathe, and R. L. Williams, “Dissolution Profile Comparison Using Similarity Factor, f2,” Dissolution Technol., vol. 6, no. 3, pp. 15–15, 1999, |
| [31] | T. K. Kim, “T test as a parametric statistic,” Korean journal of anesthesiology, vol. 68, no. 6, pp. 540–546, 2015, Accessed: Dec. 09, 2023. [Online]. Available: |
| [32] | Khan, R. Katara, and S. Ramteke, “Enhancement of Bioavailability of Cefpodoxime Proxetil Using Different Polymeric Microparticles,” AAPS PharmSciTech, vol. 11, no. 3, pp. 1368–1375, Sep. 2010, |
| [33] |
C. S. R. Rao, K. Sharath, V. Kowmudi, and N. Suresh, “Development and in-vitro evaluation of cefpodoxime proxetil gastro-retentive floating tablets,” International Journal of Applied Pharmaceutical Sciences and Research, vol. 1, no. 01, pp. 31–41, 2016, Accessed: Dec. 09, 2023. [Online]. Available:
https://www.sierrajournals.com/index.php/IJAPSR/article/view/1025 |
| [34] |
T. Jutarosaga, J. S. Jeoung, and S. Seraphin, “Infrared spectroscopy of Si–O bonding in low-dose low-energy separation by implanted oxygen materials,” Thin Solid Films, vol. 476, no. 2, pp. 303–311, 2005, Accessed: Dec. 09, 2023. [Online]. Available:
https://www.sciencedirect.com/science/article/pii/S0040609004014294 |
| [35] |
R. Ambrus, Z. Aigner, L. Catenacci, G. Bettinetti, P. Szabó-Révész, and M. Sorrenti, “Physico-chemical characterization and dissolution properties of nifluminic acid-cyclodextrin-PVP ternary systems,” Journal of thermal analysis and calorimetry, vol. 104, no. 1, pp. 291–297, 2011, Accessed: Dec. 11, 2023. [Online]. Available:
https://akjournals.com/view/journals/10973/104/1/article-p291.xml |
| [36] |
S. Gurunath, B. K. Nanjwade, and P. A. Patila, “Enhanced solubility and intestinal absorption of candesartan cilexetil solid dispersions using everted rat intestinal sacs,” Saudi Pharmaceutical Journal, vol. 22, no. 3, pp. 246–257, 2014, Accessed: Dec. 09, 2023. [Online]. Available:
https://www.sciencedirect.com/science/article/pii/S1319016413000388 |
| [37] |
N. SreeHarsha et al., “Spray dried amorphous form of simvastatin: Preparation and evaluation of the buccal tablet,” Indian J. Pharm. Educ. Res, vol. 54, pp. 46–54, 2019, Accessed: Dec. 09, 2023. [Online]. Available:
https://www.ijper.org/sites/default/files/IndJPhaEdRes_54_1-46.pdf |
| [38] | N. D. Fayed, M. A. Osman, and G. M. El Maghraby, “Enhancement of dissolution rate and intestinal stability of candesartan cilexitil,” Journal of Applied Pharmaceutical Science, vol. 6, no. 5, pp. 102–111, 2016, Accessed: Dec. 09, 2023. [Online]. Available: |
| [39] | K. A. Reddy and S. Karpagam, “Cellulose Orodispersible Films of Donepezil: Film Characterization and Drug Release,” Pharm Chem J, vol. 51, no. 8, pp. 707–715, Nov. 2017, |
| [40] | S. H. Patil and G. S. Talele, “Natural gum as mucoadhesive controlled release carriers: evaluation of Cefpodoxime Proxetil by D-Optimal design technique,” Drug Delivery, vol. 21, no. 2, pp. 118–129, Mar. 2014, |
| [41] | L. J. Bonales, V. Muñoz-Iglesias, O. Prieto-Ballesteros, and E. Mateo-Martí, “Preservation of glycine coordination compounds under a gamma radiation dose representative of natural mars radioactivity,” Sci Rep, vol. 12, no. 1, p. 13677, Aug. 2022, |
| [42] | N. S. Barakat, I. M. Elbagory, and A. S. Almurshedi, “Controlled-release carbamazepine matrix granules and tablets comprising lipophilic and hydrophilic components,” Drug Delivery, vol. 16, no. 1, pp. 57–65, Jan. 2009, |
| [43] | Barboza, D. D. Vecchia, M. P. Tagliari, M. A. S. Silva, and H. K. Stulzer, “Differential scanning calorimetry as a screening technique in compatibility studies of acyclovir extended release formulations,” Pharm Chem J, vol. 43, no. 6, p. 363, Jun. 2009, |
| [44] | Mesnukul, K. Yodkhum, and T. Phaechamud, “Solid dispersion matrix tablet comprising indomethacin-PEG-HPMC fabricated with fusion and mold technique,” Indian Journal of Pharmaceutical Sciences, vol. 71, no. 4, p. 413, 2009, Accessed: Dec. 09, 2023. [Online]. Available: |
| [45] | S. P. Chaudhari, M. Bhadiyadra, and R. H. Dave, “Evaluating the effect of the porous and non-porous colloidal silicon dioxide as a stabilizer on amorphous solid dispersion,” Journal of Drug Delivery and Therapeutics, vol. 10, no. 5, pp. 255–263, 2020, Accessed: Dec. 09, 2023. [Online]. Available: |
| [46] | D. A. Bhagwat and J. I. D. Souza, “Formulation and evaluation of solid self micro emulsifying drug delivery system using aerosil 200 as solid carrier,” International current pharmaceutical journal, vol. 1, no. 12, pp. 414–419, 2012, Accessed: Dec. 11, 2023. [Online]. Available: |
| [47] | D.-G. Yu, Z.-P. Liu, L. Cui, Z. Zhao, and L. Chen, “Electrosprayed core– shell solid dispersions of acyclovir fabricated using an epoxy- coated concentric spray head,” IJN, p. 1967, Apr. 2014, |
| [48] |
M. T. Marın, M. V. Margarit, and G. E. Salcedo, “Characterization and solubility study of solid dispersions of flunarizine and polyvinylpyrrolidone,” Il Farmaco, vol. 57, no. 9, pp. 723–727, 2002, Accessed: Dec. 09, 2023. [Online]. Available:
https://www.sciencedirect.com/science/article/pii/S0014827X02012624 |
| [49] |
P. Mura, M. Cirri, M. T. Faucci, J. M. Ginès-Dorado, and G. P. Bettinetti, “Investigation of the effects of grinding and co-grinding on physicochemical properties of glisentide,” Journal of pharmaceutical and biomedical analysis, vol. 30, no. 2, pp. 227–237, 2002, Accessed: Dec. 09, 2023. [Online]. Available:
https://www.sciencedirect.com/science/article/pii/S0731708502002522 |
| [50] | S. C. Arora, “DEVELOPMENT, CHARACTERIZATION AND SOLUBILITY STUDY OF SOLID DISPERSION OF CEFPODOXIME PROXETIL BY SOLVENT EVAPORATION METHOD”. |
| [51] | Y. Bazeed, A. Nouh, E. A. Essa, and G. M. El Maghraby, “EXPLORING DRY CO-GRINDING APPROACH AS A TOOL TO IMPROVE THE DISSOLUTION RATE OF POORLY SOLUBLE DRUG,” European Journal of Biomedical, vol. 7, no. 7, pp. 100–103, 2020, Accessed: Dec. 11, 2023. [Online]. Available: |
| [52] | R. J. Boghra, “Solubility, dissolution rate and bioavailability en-hancement of irbesartan by solid dispersion technique,” Chemical and Pharmaceutical Bulletin, vol. 59, no. 4, pp. 438–441, 2011, |
| [53] | N. Elgindy, K. Elkhodairy, A. Molokhia, and A. Elzoghby, “Lyophilized flutamide dispersions with polyols and amino acids: preparation and in vitro evaluation,” Drug Development and Industrial Pharmacy, vol. 37, no. 4, pp. 446–455, Apr. 2011, |
| [54] | Y. Luo, Y. Hong, L. Shen, F. Wu, and X. Lin, “Multifunctional Role of Polyvinylpyrrolidone in Pharmaceutical Formulations,” AAPS PharmSciTech, vol. 22, no. 1, p. 34, Jan. 2021, |
| [55] | S. Emami et al., “Force Field and a Surface Model Database for Silica to Simulate Interfacial Properties in Atomic Resolution,” Chem. Mater., vol. 26, no. 8, pp. 2647–2658, Apr. 2014, |
| [56] |
K. C. Sung et al., “Effect of formulation variables on drug and polymer release from HPMC-based matrix tablets,” International journal of pharmaceutics, vol. 142, no. 1, pp. 53–60, 1996, Accessed: Dec. 09, 2023. [Online]. Available:
https://www.sciencedirect.com/science/article/pii/0378517396046443 |
APA Style
Kader, N. A. (2025). Employing Co-grinding Technique for Improving Cefpodoxime Proxetil Dissolution Characteristics. Pharmaceutical Science and Technology, 9(2), 37-52. https://doi.org/10.11648/j.pst.20250902.11
ACS Style
Kader, N. A. Employing Co-grinding Technique for Improving Cefpodoxime Proxetil Dissolution Characteristics. Pharm. Sci. Technol. 2025, 9(2), 37-52. doi: 10.11648/j.pst.20250902.11
@article{10.11648/j.pst.20250902.11,
  author = {Nouran Abdel Kader},
  title = {Employing Co-grinding Technique for Improving Cefpodoxime Proxetil Dissolution Characteristics
},
  journal = {Pharmaceutical Science and Technology},
  volume = {9},
  number = {2},
  pages = {37-52},
  doi = {10.11648/j.pst.20250902.11},
  url = {https://doi.org/10.11648/j.pst.20250902.11},
  eprint = {https://article.sciencepublishinggroup.com/pdf/10.11648.j.pst.20250902.11},
  abstract = {Cefpodoxime Proxetil (CP) is an oral prodrug. Its extremely poor solubility in the biological fluids, is what causes its poor bioavailability. And since dissolution is rate-limiting stage in attaining the required bioavailability, co-grinding technique was exploited, it comprises grinding the medicine with excipients (one or more excipients) to create nanoparticles. Formulations were prepared by dry co-grinding technique, for different durations 5, 10 and 20 minutes either alone or with the selected carrier using mortar and pestle. Different premixes of CP as binary or ternary mixtures using fixed concentration of the API (260mg of CP equivalent to 200mg Cefpodoxime base) along with various ratios of other additives. Carriers used were Aerosil 200, Glycine, polyvinylpyrrolidone (PVP) K25 and HPMC E6. The prepared formulations were characterized through dissolution testing, FTIR and DSC techniques. Dissolution parameters such as dissolution efficiency (DE%), amount released after 5 minutes (Q5) and 60 minutes (Q60) were calculated. Statistical evaluation covering student’s T-test, f1, dissimilarity factor and f2, similarity factor was calculated. The findings from the binary mixtures of CP with Aerosil 200 has shown to be very promising, and hence, ternary mixtures of the CP/Aerosil 200 and one of the three carriers -namely, glycine, PVP K25 and HPMC E6- at the ratio of 1:1:1, were separately co-grounded to give mixtures where Q5 ranged from 60% – 68%, Q60 ranged from 80 to 100% and DE% ranged from 67-82%. These results are suggested augmenting effect of the large surface area of Aerosil 200 and the hydrophilic nature of the other carriers. Upon decreasing the weight ratios of Aerosil 200 and other carriers to 1:0.25:0.5, PVP K25 was the most effective tested polymer in terms of improving drug dissolution rate at the lowest weight ratio.},
 year = {2025}
}
TY  - JOUR
T1  - Employing Co-grinding Technique for Improving Cefpodoxime Proxetil Dissolution Characteristics

AU  - Nouran Abdel Kader
Y1  - 2025/07/21
PY  - 2025
N1  - https://doi.org/10.11648/j.pst.20250902.11
DO  - 10.11648/j.pst.20250902.11
T2  - Pharmaceutical Science and Technology
JF  - Pharmaceutical Science and Technology
JO  - Pharmaceutical Science and Technology
SP  - 37
EP  - 52
PB  - Science Publishing Group
SN  - 2640-4540
UR  - https://doi.org/10.11648/j.pst.20250902.11
AB  - Cefpodoxime Proxetil (CP) is an oral prodrug. Its extremely poor solubility in the biological fluids, is what causes its poor bioavailability. And since dissolution is rate-limiting stage in attaining the required bioavailability, co-grinding technique was exploited, it comprises grinding the medicine with excipients (one or more excipients) to create nanoparticles. Formulations were prepared by dry co-grinding technique, for different durations 5, 10 and 20 minutes either alone or with the selected carrier using mortar and pestle. Different premixes of CP as binary or ternary mixtures using fixed concentration of the API (260mg of CP equivalent to 200mg Cefpodoxime base) along with various ratios of other additives. Carriers used were Aerosil 200, Glycine, polyvinylpyrrolidone (PVP) K25 and HPMC E6. The prepared formulations were characterized through dissolution testing, FTIR and DSC techniques. Dissolution parameters such as dissolution efficiency (DE%), amount released after 5 minutes (Q5) and 60 minutes (Q60) were calculated. Statistical evaluation covering student’s T-test, f1, dissimilarity factor and f2, similarity factor was calculated. The findings from the binary mixtures of CP with Aerosil 200 has shown to be very promising, and hence, ternary mixtures of the CP/Aerosil 200 and one of the three carriers -namely, glycine, PVP K25 and HPMC E6- at the ratio of 1:1:1, were separately co-grounded to give mixtures where Q5 ranged from 60% – 68%, Q60 ranged from 80 to 100% and DE% ranged from 67-82%. These results are suggested augmenting effect of the large surface area of Aerosil 200 and the hydrophilic nature of the other carriers. Upon decreasing the weight ratios of Aerosil 200 and other carriers to 1:0.25:0.5, PVP K25 was the most effective tested polymer in terms of improving drug dissolution rate at the lowest weight ratio.
VL  - 9
IS  - 2
ER  -
Pharmaceutical Engineering, German International University, Cairo, Egypt
Biography: Nouran Abdel Kader is a Lecturer at Alexandria University, In-dustrial Pharmacy Department. She is also a Lecturer at German International University, Pharmaceutical Engineering Department. She completed her PhD in Pharmaceutical technology from Tanta University in 2023, and her Master of industrial pharmacy in oph-thalmic liposomes and ocular inserts from Alexandria University in 2015. Dr. Abdel Kader has been a production manager as well as a research and development (R&D) manager in multinational pharmaceutical factories. In addition, she holds a Master of Busi-ness Administration (MBA) in global management. She has participated in multiple research collaboration projects in recent years.
Research Fields: Industrial pharmacy, pharmaceutical engineering, Pharmaceutical technology, Pharmaceutics, pharmaceutical manufacturing and Good Manufacturing Practices.

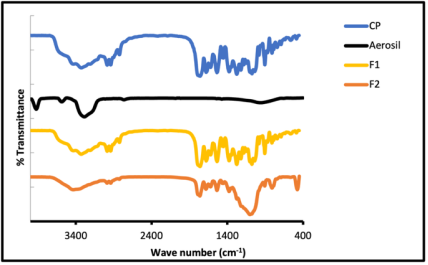
Figure 1. FTIR spectra of CP, Aerosil 200 and co-grinded mixtures F1 and F2. Details of formulations are presented in Table 2.
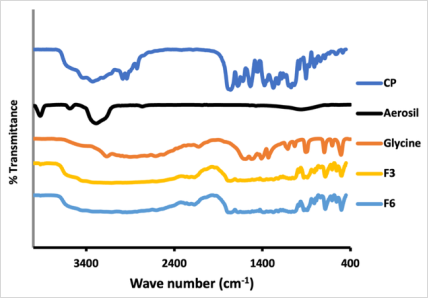
Figure 2. FTIR spectra of CP, Aerosil 200, glycine and glycine containing formulations (F3 and F6).
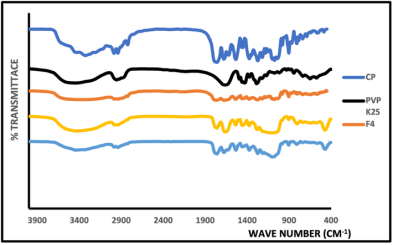
Figure 3. FTIR spectra of CP, Aerosil 200, PVP K25, F4, F7 and F9.
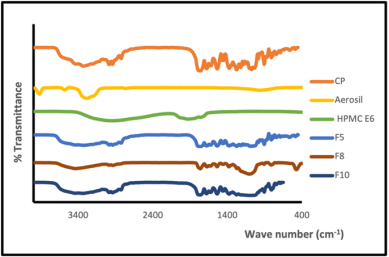
Figure 4. FTIR spectra of CP, Aerosil 200, HPMC E6, F5, F8 and F10.
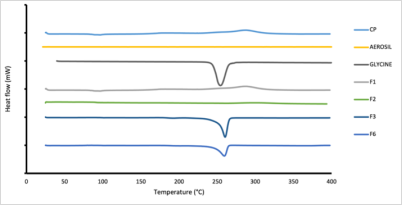
Figure 5. DSC thermograms of pure CP, grounded CP, Aerosil, Glycine; individually and in combinations at different ratios.
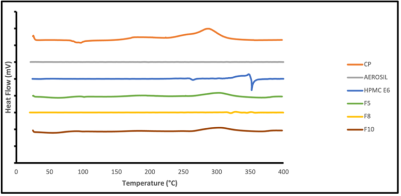
Figure 6. DSC Thermograms of CP, Aerosil 200 and HPMC E6; individually and in combinations at different ratios.
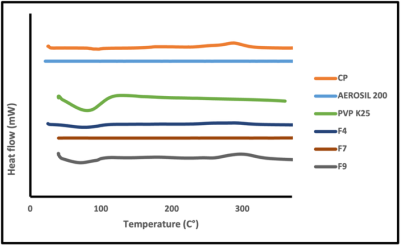
Figure 7. DSC Thermograms of CP, Aerosil 200 and PVP K 25; individually and in combinations at different ratios.
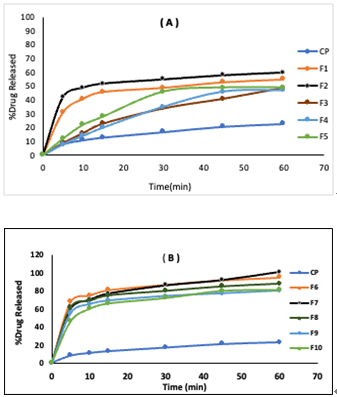
Figure 8. (A&B) Dissolution profiles of binary (A) and ternary (B) co-grinded CP with different excipients using different concentrations of Aerosil 200.
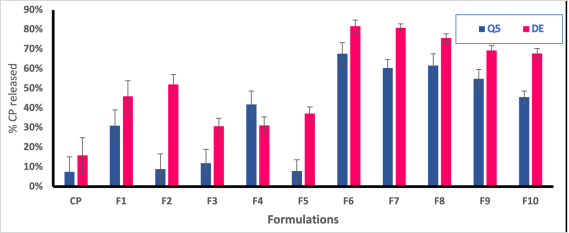
Figure 9. Percentage amount of released of Cefpodoxime Proxetil after 5 minutes (Q5) and dissolution efficiency values (DE) of different formulations.
Information


