Research Article | | Peer-Reviewed

Grain Quality, Yield, and Physiological Efficiency of Malt Barley Varieties Under Diverse Nitrogen Amounts and Split - Utilization Timings in Ethiopia’s Central Highlands

Received: 19 February 2026     Accepted: 16 June 2026     Published: 8 July 2026
Views:       Downloads:
Abstract

Under optimum Nitrogen (N) fertilizer rate with best-split application time is an abiotic menace resulting in massive yield losses to global food security and malt barley and other major staple crops' quality. To harvest the highest grain yield with good quality, the optimal N-rate must coincide with the ideal split application timing, and variety is essential. Finding out how nitrogen application rates (50, 70, 90, and 110 kg ha-1) and split timing (Treatment 1 = full dose at sowing, Treatment 2 = half at sowing and a half at mid-tillering, and Treatment 3; = 1/4 at sowing, 1/2 at mid-tillering, and 1/4 at anthesis) affected the yield, physiological, and agro-physiological efficiency of various malt barley varieties during the main cropping season of 2022 and 2023 was the primary objective of this study. With an acceptable range of quality criteria (thousand seed weight of 35-45 g and hectoliter weight of 48-62 kg ha⁻1), the yield increased significantly from 2889.00 to 6611.10 kg ha⁻1. The IBONE174/03 variety had an appropriate amount of thousand-grain weight (49.82 g) compared to the EH1847 variety. Malt brewers are encouraged to adopt the IBONE 174/03 variety to suit their needs because it provides an ideal grain yield, a tolerable thousand-grain weight, and an acceptable hector litter weight. Optimizing malt quality, productivity, and physiological and agro-physiological efficiency requires using a 110 kg ha-1 N rate and one fourth at sowing, half at mid-tillering, and one fourth at anthesis application time.

Published in Science Discovery (Volume 14, Issue 4)
DOI 10.11648/j.sd.20261404.22
Page(s) 261-271
Creative Commons

This is an Open Access article, distributed under the terms of the Creative Commons Attribution 4.0 International License (http://creativecommons.org/licenses/by/4.0/), which permits unrestricted use, distribution and reproduction in any medium or format, provided the original work is properly cited.

Copyright

Copyright © The Author(s), 2026. Published by Science Publishing Group

Keywords

N-application Time, Nitrogen Fertilization, Hector Litter Weight, Physiological Efficiency, Agro-physiological Efficiency

1. Introduction
After wheat, rice, and maize, barley is the fourth most significant cereal crop in the world . Although it ranks third in terms of yield per unit area, it is Ethiopia's sixth most extensively produced cereal . Barley-based malt is an excellent source of yeast nutrition, which is crucial for the brewing sector.
Malting barley is emerging as a potential industrial crop for resource-constrained farmers with no or very inadequate marketable goods. Malting barley needs to fulfill certain quality requirements in addition to producing large yields. More than 90% of the collected grains (i.e., the grain retention fraction) must be larger than 2.5 mm, and barley grains must contain between 9.5% and 11.5% protein by dry weight to be used in the malting and brewing sectors . When grains do not match these criteria, farmers are paid substantially less and may only be able to use them as barley feed . On the other side, usually, there is a negative correlation between grain yield, grain size, and protein content . Grain yield and malted barley quality criteria need to be properly adjusted to meet the standards for malt quality.
Ethiopia's resource-constrained subsistence farmers utilize very little if any, chemical fertilizer. However, such farmland receives di-ammonium phosphate (DAP) fertilizer applications as a source of N/ P2O5 at rates ranging from nine to ten kilograms per hectare up to eighteen to twenty kilograms per hectare, which are insufficient for the cultivation of barley . Farmers have been provided with improved agronomic management tools and inputs to significantly increase the yield and productivity of this particular crop .
Despite significant efforts to create and put into practice better production technology, the Amhara regional average yield (1.93tha-1) is still low when compared to the global (2.4 tha-1) and nationwide average yields (2.526tha-1) . As a result, continuous research is necessary to get around current production limitations, boost productivity, and increase production, which will help the nation meet its industrial needs and be self-sufficient.
The production and seed quality of malt barley have both significantly improved by selecting an appropriate variety for each agro ecology. Among the nutritional elements, nitrogen is essential for seed quality at its highest level, crop growth, and development. Although a normal nitrogen level enhances seed yield and quality, an excessive level also results in decreased yield and quality of barley seeds. Depending on the environment, different nitrogen doses are best . The quality and yield characteristics of malt barley seed are thus dependent on an adequate nitrogen level. The location, climate, soil, as well as variety utilized, determine the time of the ideal nitrogen quantity .
Grain N-uptake, starch, and protein content have increased as a result of nitrogen administration at various phases of the plant (including sowing, tillering, and booting) . To get higher grain yields and better grain quality, nitrogen should be applied in amounts that match each growth stage of the crop . On the contrary, increased nitrogen‑use efficiency, the correct nitrogen rate, and proper timing of fertilizer applications are essential for optimal crop management and grain quality .
According to recent reports, however, due to Ethiopia's scarcity of malt barley to meet the needs of local breweries, the international and national demand for malt by breweries is growing dramatically . As a result, barley production for malt can play a key role in creating income and improving the highland people's livelihood . Nevertheless, barley production for malt is restricted in some parts of the country. As a result, national breweries must import malt from other countries. Research efforts to increase production and capitalize on the enormous potential of the malting and brewing industries are limited . Limited research is being done to boost output with better quality and take advantage of the great potential of the malting and brewing sectors. This study examined the influences of different nitrogen fertilizer rates and split application time on the productivity, quality, physiological, and agro-physiological efficiency of two Barley cultivars used for malting in the central highlands of Ethiopia.
2. Experimental Methodology
2.1. Research Area
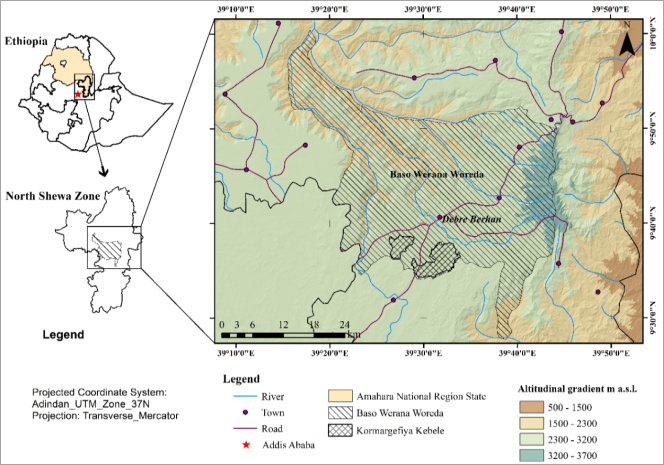
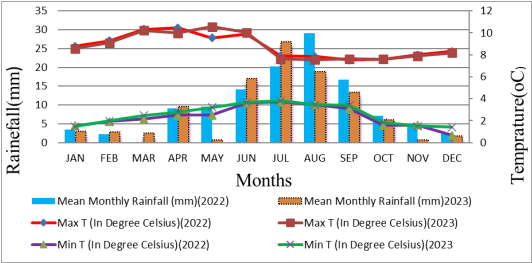
In the central highlands of Ethiopia, specifically the Bassonan Worana district of the Amhara Region, we conducted two consecutive seasons of field research (2022 and 2023) on a local farmer’s field during the principal production period (Figure 1). The testing sites are at an altitude of 2807 m a.s.l. and are situated between latitudes 9° 34' 43" N. The minimum and maximum average annual temperatures in the region are 5.48°C and 20.99°C, respectively. Over the past two years, the average yearly precipitation has been between 483.52 mm and 1 071.30 mm (Figure 2), information obtained from the National Meteorological Data Agency. The main crops farmed there are wheat, potatoes, and food grains. The soil type in the region is Camisole .
2.2. Treatment Conditions and Study Design
A factorial combination of four N rates (50, 70, 90, and 110 kg ha-1), two malt barley varieties (IBONE 174/03 and EH 1847), and three split times of N application (T1 = full dose at sowing, T2 = half dose at sowing and half dose at mid-tillering, and T3 = one forth quantity at sowing, half quantity at mid-tillering, and one forth quantity at anthesis) were appraised in this study. Additionally, one plot with no N application (controls), all varieties were represented in each replication to allow comparison. The experiment used a factorial arrangement of treatments and was arranged as a randomized complete block design (RCBD) with three replications (4 × 3 × 2). Each experimental unit (plot) measured 3 m × 2 m. The distance between adjacent plots was 0.5 m, while the distance between blocks was 1 m. Within a plot there were 10 rows, each 2 m long, spaced 30 cm apart. The harvestable area of each plot was 4.8 m2 (2.4 m × 2 m) and comprised eight rows of 2 m length.
Figure 1. Map of the study area.
Figure 2. Monthly totals of rainfall (mm) alongside the peak (Max T) and trough (Min T) temperatures (°C) observed in 2022 and 2023. Source: National Metrological Data Agency.
2.3. Data Acquisition and Analysis
Successful data collection and analysis were achieved for the soil, yield, quality, and physiological efficiency criteria. Surface soil sample (0-30 cm) soil was sampled. A single composite specimen was generated by thoroughly mixing 17 sub-samples collected by using an auger in a diagonal arrangement. The soil was air‑dryed, passed through a 2 mm sieve, and then analyzed for texture, total nitrogen (TN), available phosphorus (Av. P), pH, organic carbon (OC), and cation‑exchange capacity (CEC).
The soil texture was assessed using the hydrometer methods . The wet digestion method of Walk & Black , was used to determine the soil’s organic‑carbon (OC) content. Total nitrogen in the soil was measured by the Kjeldahl digestion method using sulfuric acid . A separate suspension prepared at a 1:2.5 soil‑to‑water ratio served for pH analysis with a glass electrode attached to a digital potentiometer . The amount of organic carbon was calculated using the volumetric method . Olsen's colorimetric technique was utilized to evaluate the available P . Cation exchange capacity (CEC) was calculated by extracting the soil with 1 M ammonium acetate buffered to pH 7, then measuring the exchanged cations .
Grain yield from each net plot area was measured following harvest, open-air drying, and threshing (4.8 m2). Quality criteria; one thousand grains were counted manually, after which their combined mass was measured on a high‑sensitivity balance. Using the grain analysis computer (GAC) 2100, a typical laboratory weight tool, to measure the hectoliter weight of dockage-free samples, as detailed in . Straw nitrogen was quantified by the micro‑Kjeldahl digestion procedure outlined in the Food and Agriculture Organization (FAO) laboratory manual for plant‑nutrient analysis .
At maturity, representative samples of non-grain above-ground plant components (stems, leaves, and chaff) were gathered from the central unit areas of each plot. The plant samples were washed gently with distilled water to remove surface contaminants and placed in a drying oven set to 70°C and left until their weight stopped decreasing, indicating a constant dry mass. Finally, the dry weight of each specimen was measured using an electronic analytical balance. After pulverizing the samples in a rotor mill and sieving them to ≤ 0.5 mm, we digested the residue with 0.1N H2SO4 containing a 10:1 (K2SO4:CuSO4) digestion mixture, employing the ground material from every treatment. The American Association of Cereal Chemists (AACC) digestion method was employed to determine both the straw‑nitrogen concentration and the total grain‑nitrogen content of fertilized (treated) and unfertilized (untreated) plots using dry‑flour samples .
The ratio of biological yield to nutrient uptake known as physiological efficiency (PE) was calculated by…
PE=Byf - ByuNf - Nu
In the equation, Byf denotes the above‑ground biomass yield (grain + straw) of the fertilized plot, expressed in kg ha⁻1; Byu denotes the same measurement for the unfertilized plot; Nf is the total nutrient absorption (grain + straw) by the fertilized plot, also in kg ha⁻1; and Nu is the nutrient uptake of the unfertilized plot (grain + straw), again in kg ha⁻1.
Agro-physiological efficiency (APE) was determined as
APE=Gkg- GkgNkg- Nkg
G₍f₎ and G₍u₎ denote the grain yields from the fertilized and unfertilized plots, respectively. N₍f₎ is the total nitrogen uptake (grain + straw) of the fertilized plot (in kg), and N₍u₎ is the total nitrogen uptake (grain + straw) of the unfertilized plot (in kg) .
2.4. Statistical Analysis
The Analysis of variance (ANOVA) was conducted using SAS version 9.2 (Statistical Analysis System; SAS, 2004) as described by Gómez and Gómez . The homogeneity test (an F‑test following Gómez & Gómez ) showed no significant differences between the two years for any parameter at any location. Consequently, we merged the two years into a single dataset for the subsequent analysis. Whenever a treatment produced a statistically important outcome, we compared the group means using the least significant difference (LSD) test (α = 0.05). For the factorial analysis, the control was deliberately left out to reduce model complexity.
3. Result and Discussion
3.1. Selected Soil Physical and Chemical Properties
The physicochemical characteristics of the soils, taken before planting at the experimental locations in Bassonan Worra District, are presented in Table 1.
The soils of the two-year testing site belonged to the sandy clay textural class. This is good for crop cultivation. Soil reaction (pH) at the 2022- and 2023-year testing site is slightly acidic. Across both years, the site fell into the low‑range category for both soil organic carbon (OC) and total nitrogen . The measured available phosphorus was marginally below 10 mg P ha⁻1 for both years, which does not meet the critical soil‑available P benchmark of 10 mg P kg⁻1 that has been established for some soils in Ethiopia . The soils from both years’ sites had a markedly high exchangeable K concentration . Both soils possessed cation‑exchange capacities that classify them as high . The soil analysis presented in Table 1 shows that the study‑area soils are deficient in nitrogen (N) and phosphorus (P), indicating that supplemental N and P fertilizers are required for optimal crop yields.
Table 1. Selected physicochemical characteristics of the experimental soils prior to sowing.

Year

Physical Properties

Chemical properties

Sand

Clay

Silt

Textural Class

pH

OC

TN

Ava. P

Ex. K

CEC

%

%

mg kg-1

Cmol kg + kg-1

2022

52.4

36.7

10.9

Sandy Clay

5.9

1.4

0.13

7.9

119

15.3

2023

51.8

37.6

10.6

Sandy Clay

6.1

1.6

0.14

8.8

121

16.7

where: pH (soil reaction), OC (organic carbon), available P (available phosphorus), Ex K (exchangeable potassium), CEC (cation‑exchange capacity), and TN (total nitrogen).
3.2. Grain Yield
A two‑year combined ANOVA showed that nitrogen (N) rate, timing of N application, and their interaction each had a highly significant effect on grain yield (P < 0.001). In contrast, the cultivar (variety) main effect and all other interactions, including the three‑way interaction among the treatments, were not significant for malt‑barley grain yield. (Table 3).
The mean grain yield obtained with the low‑rate (50 kg ha⁻1) nitrogen applied at T1 was 2 889 kg ha⁻1. Switching to the high‑rate (110 kg ha⁻1) nitrogen at T3 raised the yield to 3 722 kg ha⁻1, which is a 128.84% increase relative to the T1 result (Table 2). According to Gauer et al. and Ali , each incremental addition of N fertilizer produced a proportional (linear) boost in grain yield. According to Endale , when the highest nitrogen dose (110 kg per hectare) was divided into three applications 25% at planting, 50% at mid‑tillering, and the final 25% at heading the crop delivered a grain yield of 3 722.1 kg ha⁻1, which is 128.84% higher than the untreated plot.
The superior grain yield recorded with the highest N rates stems from a combination of full nutrient satisfaction and a three‑split N‑fertilizer regimen. By distributing the N input over three applications, the malt‑barley plants were able to utilise the nutrient more efficiently, which in turn stimulated the development of other yield‑determining traits and led to a higher overall harvest. It is likely that the result stems from the alignment of the crop’s greatest N requirement with sufficient soil‑available N at the specified stages. Ellen and Spiertz reported a similar pattern: when a high N rate was divided into separate applications (T2 → T3 → T4), grain yield increased more reliably than when the same amount of N was applied all at once.
In addition, the authors observed that nitrogen availability closely followed the crop’s demand throughout the growing season when the fertilizer was applied in split doses. A one‑year field trial by Mitiku et al. corroborated this finding: applying nitrogen as ¼ at sowing, ½ at mid‑tillering and the remaining ¼ at anthesis produced a grain yield of 6 611 kg ha⁻1, whereas a single application of 50 kg N ha⁻1 at sowing yielded only 2 889 kg ha⁻1.
Table 2. Nitrogen Rate × Timing: Impacts on Barley Yield, Agro‑Physiological Efficiency, Thousand‑Kernel Weight & Hectolitre Weight.

Treatments

GY

TKW

HLW

NR1T1

2889.00e

46d

57.21de

NR2T1

3420.10de

46.04d

57.07de

NR3T1

3774.30cd

47.41cd

57.80ce

NR4T1

3225.70de

48.65cd

59.00be

NR1T2

3302.10de

46.53d

57.00e

NR2T2

4396.00c

49.16cd

59.67be

NR3T2

3396.00de

52.65bc

59.33be

NR4T2

5534.70b

56.70b

60.00bd

NR1T3

3392.40de

49.63cd

57.02de

N2T3

3680.6d

56.22b

60.23bc

NR3T3

5468.70b

58.08ab

61.11b

NR4T3

6611.10a

62.27a

68.83a

LSD

673.07

6.0264

2.4788

EMS

373233.7

20.264949

5.0175167

CV

14.9340

8.722176

3.763945

Means followed by the same letter within a column are not significantly different at a 5% level of significance, Where, T1= full dose at sowing, T2= ½ dose at sowing and ½ dose at mid tillering, T3=1/4 dose at sowing, ½ dose at mid tillering and ¼ dose at anthesis; R1=50 kg ha-1 N; R2=70 kg ha-1 N; R3=90 kg ha-1 N; R4=110 kg ha-1 N; GY=grain yield; TKW (thousand‑seed weight), HLW (hectolitre weight), LSD (least‑significant difference), MS (error mean square), and CV (coefficient of variation).
Table 3. Mean square from analysis of variance (ANOVA) for grain yield and quality parameters of malt barley varieties.

SOV

PE

GY

AgPE

TSW

HLW

Time

NS

***

NS

***

***

Variety

***

NS

***

**

NS

N rate

NS

***

NS

***

***

TxV

*

NS

**

NS

NS

TxNr

NS

***

*

**

***

VxNr

NS

NS

NS

NS

NS

TxVxNr

NS

NS

NS

NS

NS

CV

13.64

14.9340

13.70

8.722176

3.763945

*, **, ***, and For the NS group, the test yielded significant differences at the 0.05, 0.01 and 0.001 probability levels, while all other comparisons failed to achieve statistical significance. Where; T = time of N application; Nr = N rate; V= verities; PE= physiological efficiency; Gy=grain yield; AgPE =Agro physiological efficiency; TSW= thousand seed weight; HLW= hectolitre weight; CV= coefficient of variation
3.3. Thousand-seed Weight
In a combined two‑year study, the thousand‑seed weight of malt barley was strongly influenced (P < 0.001) by three primary factors how much nitrogen was applied, when it was applied, and which variety was grown. The only interaction that mattered was the synergy between nitrogen rate and application timing; every other interaction tested failed to produce a measurable change in seed weight (Table 3).
The main effect results revealed that EH 1847 produced a higher thousand seed weight (53.40gm) than the IBONE, 174/03 variety (49.82 gm). The observed thousand‑gram disparity in seed weight across the varieties is probably a result of their distinct genetic make‑up (Table 4).
The interaction between application timing and nitrogen rate caused a low thousand‑seed weight of 46 g at T1 when the low rate (50 kg N ha⁻1) was used. Conversely, at T3 the same low rate (50 kg N ha⁻1) yielded a higher thousand‑seed weight of 62.27 g, a value that was also obtained with the higher nitrogen rate (100 kg N ha⁻1) at the same sampling time (Table 2). Lower thousand seed weight due to the low rate of N with no N splitting could be due to a non-satisfying crop nutrient requirement and N loss because of one-time application/no splitting, which could lead to a decrease in photosynthesis and carbohydrate accumulation in grain, resulting in light grains. According to Bekele, et al., , the thousand seed weight of malt barley should be greater than 45 gm for two-rowed barley and greater than 42 gm for six-rowed barley. According to the Ethiopian Quality Standard Authority (EQSA), the permissible range is 35‑45 g, while raw barley should weigh 25‑35 g per thousand kernels; the observed value was higher than both of these limits .
Table 4. The impact of varietal variation on thousand seed weight.

Parameters

Variety (V)

TSW

IBONE 174/03

49.82b

EH 1847

53.40a

LSD

3.0836

EMS

42.886594

CV

12.68858

In each column, values that are followed by the identical letter are statistically indistinguishable at the 5% significance level; Where TKW=Thousand seed weight; physiological efficiency; LSD=least significant difference; MS=error mean squire’s=coefficient of variation
3.4. Hectoliter Weight
An analysis of variance conducted over two years showed that the main effects of nitrogen rate, the timing of nitrogen application, and their interaction all had a highly significant effect (P < 0.001) on the hectoliter weight (HLW) of malt‑barley grain. Variety and the other treatment interactions did not affect grain hectoliter weight (Table 3).
The interaction effect revealed that the higher nitrogen rate (110 kg ha⁻1) applied at the T3 timing produced the greatest haul‑load weight (HLW) of 68 kg ha⁻1, whereas the lowest HLW (57.21 kg ha⁻1) was obtained with the lowest nitrogen rate (50 kg ha⁻1) applied at the T1 timing (Table 2).
This may result from applying the higher nitrogen rate in three separate doses, which allows carbohydrates to accumulate in the endosperm cells during the grain-filling process. Both Derebe and Temesgen and Gezahegn & Kefale reported that increasing the applied nitrogen‑fertilizer rate leads to a greater hectolitre weight. The experiment demonstrated that the hectoliter weight of both varieties remained within the Ethiopian Quality Standard Authority’s (EQSA) permissible interval of 60-65 kg hl⁻1 across all nitrogen‑fertilizer levels. In contrast, the literature cites a broader acceptable test‑weight window for raw barley, namely 48-62 kg hl⁻1 . According to Rick et al. , barley is considered acceptable when its hectoliter weight lies between 66.1 kg hl⁻1 and 72.8 kg hl⁻1. In the present study, however, no variety met this criterion at any nitrogen‑fertilizer level.
3.5. Physiological Efficiency
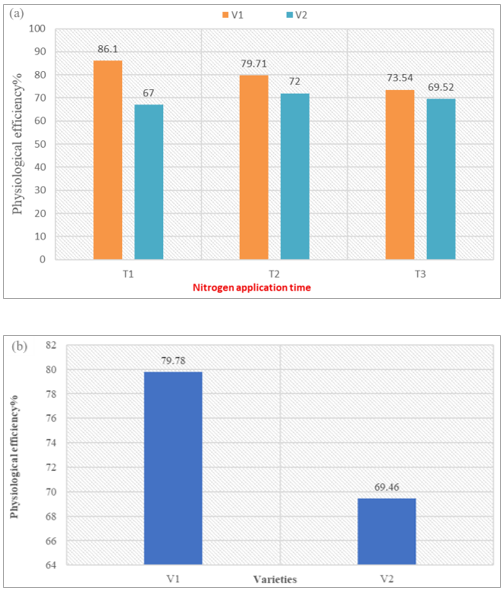
A two-year combined analysis of variance showed that physiological efficiency (PE) was significantly (P 0.001) influenced by the main effects of variety and therefore the interaction effect of time of N application and variety (P 0.05), but not by the main effects of nitrogen (N) rates or time of application; rather, it is the interactions between N rates and time of application, between variety and N rates, and the three‑way interaction among variety, N rates, and time of application that matter (Table 3).
Regarding the primary impact of variety, the IBONE 174/03 cultivar was 28% more efficient at converting nutrient uptake into biological yield than EH 1847 (Figure 3b).
The interaction effects of the time of N‑fertilizer application and variety, on the other hand, showed that the IBONE 174/03 variety produced a higher protein efficiency (PE) of 86.1%, whereas the EH 1847 variety yielded a lower PE of 67.0% (T1) (Figure 3a). Genetic diversity may explain the observed differences in physiological efficiency, a conclusion that aligns with Gauer et al. , who demonstrated that crop genotype is the chief driver of physiological efficiency. Contrary to earlier reports, Haile Deresse et al. reported that the PE parameter reaches its highest value under low nitrogen applications and its lowest value when nitrogen application is high.
Figure 3. (a) Interaction between cultivar and the timing of split nitrogen application; (b) Main effect of cultivar, both influencing physiological efficiency.
3.6. Agro-physiological Efficiency
A two‑year combined analysis of variance showed that agro‑physiological efficiency was significantly (p < 0.05) influenced by the main effect of variety, the interaction of variety with the time of N‑fertilizer application, N rates, the time of application, and the three‑way interaction among treatments. In contrast, N rate, the time of application, and the interaction between variety and N rate had no significant effect on this parameter (Table 3).
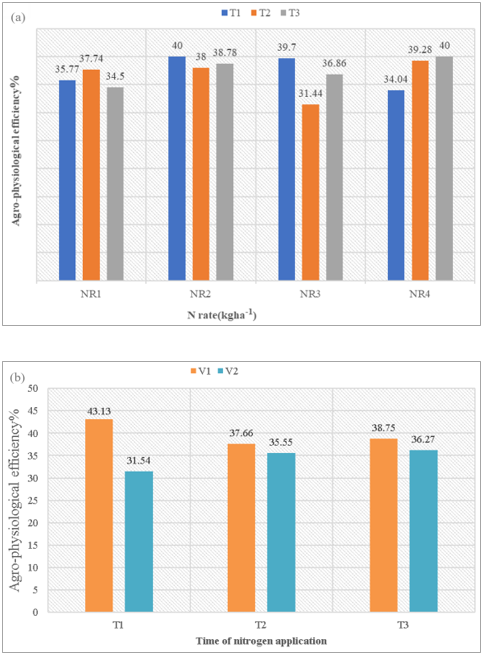
The interaction between the first N‑fertilizer application (T1) and crop variety yielded inconsistent outcomes among the treatments. Specifically, the combination of T1 + IBONE 174/03 produced the highest AgPE value (43.13%), while T1 + EH 1847 gave the lowest (31.54%) (Figure 4b). This agro-physiological difference caused by varietal differences could be the result of genotype differences between the two varieties.
The interaction effects of nitrogen (N) rates and the timing of N‑fertilizer application showed that the highest agronomic phosphorus efficiency (AgPE) - 40.00% - was obtained with the highest N rate (110 kg ha⁻1) applied at time T3, whereas the lowest AgPE - 31.44% occurred with the lower N rate (90 kg ha⁻1) applied at time T2 (Figure 4a).
This Higher agro-physiological efficiency from a higher N rate and more splitting may be due to the splitting of N fertilizer into many doses, which may increase the efficiency of the fertilizers used by decreasing N losses largely in favor of the most splitting. According to Haile Deresse et al. , Tena et al. , and Belete et al. , the extreme values of this parameter are observed at the lowest and highest nitrogen application rates, respectively, across all wheat cultivars during the study period. Our own results mirror these findings.
Figure 4. The interaction effect of N rate and time of nitrogen fertilizer split application (a) and varieties and time of nitrogen fertilizer application (b) on Agro - physiological efficiency.

4. Summary and Conclusions
The success of malt‑barley production hinges on detailed knowledge of how different varieties react to nitrogen (N) fertilizer, specifically the amount applied and the stage of growth at which it is applied. Grain yield and malting quality are not uniform; they fluctuate with regional conditions, the N rate, and the timing of application. Consequently, future research must concentrate on identifying the optimal N dose and application window for each locally‑adapted variety. By doing so, growers can increase yields through improved physiological efficiency while preserving grain quality at the levels required for malting. Because protein content is a critical quality parameter, is strongly affected by both variety and N management; establishing variety‑specific N‑rate and timing recommendations is indispensable for producing high‑quality malt‑barley grain.
The effects of nitrogen‑fertilizer rate and timing of application on grain yield, quality, and physiological efficiency of two released malt‑barley varieties showed that yield, thousand‑seed weight, hectoliter weight, physiological efficiency, and agro‑physiological traits all increased as nitrogen rates and the number of applications rose. However, lower nitrogen rates still produced satisfactory grain yields with acceptable quality and good physiological efficiency.
In addition, genotypic variation was observed for thousand‑seed weight and physiological efficiency. The maximum yield with acceptable quality occurred with the top nitrogen dose (110 kg ha⁻1) applied at the T3 stage. At this level, cultivars IBONE 174/03 and EH 1847 reached thousand‑kernel weights of 49.82 g and 53.40 g, respectively. Well above the EQSA standard of 25-35 g and higher than the >45 g minimum recommended for 2‑rowed barley (Anonymous, 2012).
Although the three‑factor interaction was not statistically significant for grain yield, the maximum yield (6 917 kg ha⁻1) occurred when the highest nitrogen rate (110 kg ha⁻1), the T3 application timing, and the IBONE 174/03 variety were combined, and the grain met all quality specifications. Overall, nitrogen level and application timing were the primary determinants of yield increase, with no negative impact on malt‑barley quality. Therefore, it is possible to conclude that integrated application of 110kg ha-1 N fertilizer rates and IBONE 174/03 variety in three-split (¼ dose at the time of sowing, ½ dose at mid-tillering, and ¼ dose at anthesis) N application was recommended for the study location and areas of the similar agro-ecological zone, in the central highlands of Ethiopia. Fertilizer recommendations are generally derived from soil tests that measure plant‑available nutrients. Because the present study was limited to a single site and one cropping season, a definitive recommendation cannot yet be made. Consequently, multi‑season, multi‑location trials are required to pinpoint the optimal nitrogen rate and application timing that maximize physiological efficiency, grain yield, and malt‑barley quality.
Abbreviations

AACC

American Association of Cereal Chemists

ANOVA

Analysis of Variance

CEC

Cation‑Exchange Capacity

DAP

Diammonium Phosphate

EQSA

Ethiopian Quality Standard Authority

FAO

Food And Agriculture Organization

GAC

Grain Analysis Computer

HLW

Hectoliter Weight

LSD

Least Significant Difference

OC

Organic Carbon

RCBD

Randomized Complete Block Design

TN

Total Nitrogen

Acknowledgments
The authors wish to thank the Debre Berhan Research Centre (DBRC), Debre Berhan University College of Agriculture and Natural Resource Science (DBU), Bassona worana Woreda Office of Agriculture and Natural Resource Development, and both the North Shewa Departments of Agriculture & Natural Resources and Livestock & Fishery Development.
Author Contributions
Mitiku Ashenafi: Conceptualization, Data curation, Methodology, Resources, Software, Supervision, Writing – original draft
Endale Lemma: Conceptualization, Data curation, Methodology, Software, Writing – original draft
Wondwosen Tena: Methodology, Resources, Software, Supervision, Writing – review & editing
Conflicts of Interest
The author and co-authors have no conflict of interest.
References
[1] Tricase, C., Amicarelli, V., Lamonaca, E., & Rana, R. L. (2018). Economic analysis of the barley market and related uses. Grasses as food and feed, 10.
[2] Mulatu, B., & Grando, S. (2006,). Barley research and development in Ethiopia. In Proceedings of the 2nd National Barley Research and Development Review Workshop (pp. 28-30).
[3] Hu, Y., Barmeier, G., & Schmidhalter, U. (2021). Genetic Variation in Grain Yield and Quality Traits of Spring Malting Barley. Agronomy, 11(6), 1177.
[4] Geloso, V., Hinton, M., & Kufenko, V. (2017). The equally “bad” French and English farmers of Quebec: New TFP measures from the 1831 census. Historical Methods: A Journal of Quantitative and Interdisciplinary History, 50(3), 170-189.
[5] Fox, G. P. (2010). Chemical Composition in Barley Grains and Malt Quality In Zhang G, Li C, editors. Genetics and Improvement of Barley Malt Quality.
[6] Agegnehu, G., Liben, M., Molla, A., Feyissa, A., Bekele, A., & Getaneh, F. (2011). Research achievements in soil fertility management in relation to barley in Ethiopia. Barley research and development in Ethiopia, 137.
[7] Molina-Cano, J. L., Francesch, M., Perez-Vendrell, A. M., Ramo, T., Voltas, J., & Brufau, J. J. J. O. C. S. (1997). Genetic and environmental variation in malting and feed quality of barley. Journal of Cereal Science, 25(1), 37-47.
[8] CSA (Central Statistical Agency), Federal Democratic republic of Ethiopia central Statistical agency: Agricultural Sample Survey 2020/2021 (2013 E. C.). Report on Area and Production of Major Crops (Private Peasant Holdings, Meher Season) Statistical Bulletin 584, Federal Democratic Republic of Ethiopia, Addis Ababa, Ethiopia.
[9] Akar, T., Avci, M., Dusunceli, F., & Mejía, D. (2004). Barley: Post-harvest operations.
[10] Yesmin, S., Akhtar, M., & Hossain, B. (2014). Yield and Seed quality of barley (Hordeum vulgare L.) as affected by variety, nitrogen level, and harvesting time. International Journal of Agriculture and Crop Sciences, 7(5), 262.
[11] Cochrane, M. P., & Duffus, C. M. (1983). Endosperm cell number in cultivars of barley differing in grain weight. Annals of Applied Biology, 102(1), 177-181.
[12] Da Moraes, L. B. D., Freo, J. D., Biduski, B., Elias, M. C., & Gutkoski, L. C. (2013). Effects of rate, time, and splitting of nitrogen fertilization on the technological quality of wheat. Journal of Food Science and Engineering, 3(1), 9.
[13] Leghari, S. J., Wahocho, N. A., Laghari, G. M., HafeezLaghari, A., MustafaBhabhan, G., HussainTalpur, K.,. & Lashari, A. A. (2016). Role of nitrogen for plant growth and development: A review. Advances in Environmental Biology, 10(9), 209-219.
[14] Hirel, B., Tétu, T., Lea, P. J., & Dubois, F. (2011). Improving nitrogen use efficiency in crops for sustainable agriculture. Sustainability, 3(9), 1452-1485. Hirel, B., Tétu, T., Lea, P. J., & Dubois, F. (2011). Improving nitrogen use efficiency in crops for sustainable agriculture. Sustainability, 3(9), 1452-1485.
[15] Mohammed, H., & Getachew, L. (2003). An overview of malt barley production and marketing in Arsi. In Proceedings of the workshop on constraints and prospects of malt barley, production, supply, and marketing organized by Asella Malt Factory and industrial projects service (pp. 1-25).
[16] Endale, L. (2019). Effects of rate and time of nitrogen fertilizer application on yield, quality and nitrogen use efficiency of malt barley varieties (Hordeum distichon L.) AT ssonaworana woreda, central highland of Ethiopia.
[17] Ashenafi Ali, Teklu Erkossa, Kiflu Gudeta, Wuletawu Abera, Ephrem Mesfin et al., 2024. Reference soil group’s map of Ethiopia based on legacy data and machine learning-technique: EthioSoilGrids 1.0. SOIL, 10, 189-209.
[18] Walkley, A., Black, I., 1934. An examination of Degtjareff method for determining soil organic matter and a proposed modification of the chromic acid titration method. Soil Sci. 37, 29-37.
[19] Bremner, J. M. (1960). Determination of nitrogen in soil by the Kjeldahl method. The Journal of Agricultural Science, 55(1), 11-33.
[20] Rayment, G. E., & Lyons, D. J. (2011). Soil chemical methods: Australasia (Vol. 3). CSIRO publishing.
[21] Nelson, D. A., & Sommers, L. (1983). Total carbon, organic carbon, and organic matter. Methods of soil analysis: Part 2 chemical and microbiological properties, 9, 539-579.
[22] Olsen, S. R., Cole, C. V., Watanabe, F. S., Dean, L. A., 1954. Estimation of available phosphorus in soils by extraction with sodium carbonate. USDA Circular 939, 1-19.
[23] Chapman, H. D., 1965. Cation exchange capacity by ammonium saturation. In: Black, C. A., Ensminger, L. E., Clark, F. E. (Eds.), Method of Soil Analysis. ASA, Madison, pp. 891-901.
[24] AACC. (1993). Approved methods of the American Association of Cereal Chemists (AACC): Methods. St. Paul^ Minnesota Minnesota: AACC.
[25] Motsara, M. R., & Roy, R. N. (2008). Guide to laboratory establishment for plant nutrient analysis (19): Food and Agriculture Organization of the United Nations Rome. FAO Viale delle Terme di Caracalla, 153.
[26] Fageria, N. K., & Baligar, V. C. (2005). Enhancing nitrogen use efficiency in crop plants. Advances in agronomy, 88, 97-185.
[27] Gomez, K. A., & Gomez, A. A. (1984). Statistical procedures for agricultural research. John Wiley & sons.
[28] Jones, B. J. J., 2001. Laboratory Guides for Conducting Soil Tests and Plant Analysis. CRC Press, London, p. 363.
[29] Tekalign, M., Haque, I., 1991. Phosphorus status of some Ethiopian soils. III: evaluation of soil test methods for available phosphorus. Trop. Agric. 68, 51-56.
[30] Landon, J. R., 1991. Booker Tropical Soil Manual: a Handbook for Soil Survey and Agricultural Land Evaluation in the Tropics and Subtropics. Longman Scientific and Technical, Essex, New York, p. 474. OR John Wiley & Sons Inc., New York.
[31] Gauer, L. E., Grant, C. A., Bailey, L. D., & Gehl, D. T. (1992). Effects of nitrogen fertilization on grain protein content, nitrogen uptake, and nitrogen use efficiency of six spring wheat (Triticum aestivum L.) cultivars, in relation to estimated moisture supply. Canadian Journal of Plant Science, 72(1), 235-241.
[32] Ali, E. A. (2010). Grain yield and nitrogen use efficiency of pearl millet as affected by plant density, nitrogen rate, and splitting in sandy soil. American-Eurasian Journal of Agricultural and Environmental Science, 7(3), 327-335.
[33] Ellen, J., & Spiertz, J. H. J. (1980). Effects of rate and timing of nitrogen dressings on grain yield formation of winter wheat (T. aestivum L.). Fertilizer Research, 1(3), 177-190.
[34] Ashenafi, M., Lemma, E., & Tena, W. (2023). International Journal of Current Research and Academic Review. Int. J. Curr. Res. Aca. Rev, 11(3), 11-25.
[35] Bekele, S., Yoseph, T., & Ayalew, T. (2020). Growth, protein content, yield, and yield components of malt barley (Hordeum vulgare L.) varieties in response to seeding rate at Sinana District, Southeast Ethiopia. International Journal of Applied Agricultural Sciences, 6(4), 61-71.
[36] EQSA (Ethiopia Quality Standards Authority). 2006. Malting barley specification. Addis Ababa, Ethiopia.
[37] Terefe, D., Desalegn, T., & Ashagre, H. (2018). Effect of nitrogen fertilizer levels on grain yield and quality of malt barley (Hordeum vulgare L.) varieties at Wolmera District, Central Highland of Ethiopia. International Journal of Research Studies in Agricultural Sciences, 4(4), 29-43.
[38] Gezahegn, B., & Kefale, D. (2016). Effect of nitrogen fertilizer level on grain yield and quality of malt barley (Hordeum vulgare L.) varieties in Malga Woreda, southern Ethiopia. Food Science and Quality Management, 52(6), 8-16.
[39] Rick, G., Ian, M., Nick, M., & Neroli, G. (2014). Western Australian malting barley varietal recommendations. Journal of Food Sciences, 2, 11-14.
[40] Haile, D., Nigussie, D., & Ayana, A. (2012). Nitrogen use efficiency of bread wheat: Effect of nitrogen rate and time of application. Journal of soil science and plant nutrition, 12(3), 389-410.
[41] Tana, T., Dalga, D., & Sharma, J. J. (2015). Effect of weed management methods and nitrogen fertilizer rates on grain yield and nitrogen use efficiency of bread wheat (Triticum aestivum L.) in southern Ethiopia. East African Journal of Sciences, 9(1), 15-30.
[42] Belete, F., Dechassa, N., Molla, A., & Tana, T. (2018). Effect of nitrogen fertilizer rates on grain yield and nitrogen uptake and use efficiency of bread wheat (Triticum aestivum L.) varieties on the Vertisols of central highlands of Ethiopia. Agriculture & Food Security, 7(1), 78.
Cite This Article
  • APA Style

    Ashenafi, M., Lemma, E., Tena, W. (2026). Grain Quality, Yield, and Physiological Efficiency of Malt Barley Varieties Under Diverse Nitrogen Amounts and Split - Utilization Timings in Ethiopia’s Central Highlands. Science Discovery, 14(4), 261-271. https://doi.org/10.11648/j.sd.20261404.22

    Copy | Download

    ACS Style

    Ashenafi, M.; Lemma, E.; Tena, W. Grain Quality, Yield, and Physiological Efficiency of Malt Barley Varieties Under Diverse Nitrogen Amounts and Split - Utilization Timings in Ethiopia’s Central Highlands. Sci. Discov. 2026, 14(4), 261-271. doi: 10.11648/j.sd.20261404.22

    Copy | Download

    AMA Style

    Ashenafi M, Lemma E, Tena W. Grain Quality, Yield, and Physiological Efficiency of Malt Barley Varieties Under Diverse Nitrogen Amounts and Split - Utilization Timings in Ethiopia’s Central Highlands. Sci Discov. 2026;14(4):261-271. doi: 10.11648/j.sd.20261404.22

    Copy | Download

  • @article{10.11648/j.sd.20261404.22,
      author = {Mitiku Ashenafi and Endale Lemma and Wondwosen Tena},
      title = {Grain Quality, Yield, and Physiological Efficiency of Malt Barley Varieties Under Diverse Nitrogen Amounts and Split - Utilization Timings in Ethiopia’s Central Highlands},
      journal = {Science Discovery},
      volume = {14},
      number = {4},
      pages = {261-271},
      doi = {10.11648/j.sd.20261404.22},
      url = {https://doi.org/10.11648/j.sd.20261404.22},
      eprint = {https://article.sciencepublishinggroup.com/pdf/10.11648.j.sd.20261404.22},
      abstract = {Under optimum Nitrogen (N) fertilizer rate with best-split application time is an abiotic menace resulting in massive yield losses to global food security and malt barley and other major staple crops' quality. To harvest the highest grain yield with good quality, the optimal N-rate must coincide with the ideal split application timing, and variety is essential. Finding out how nitrogen application rates (50, 70, 90, and 110 kg ha-1) and split timing (Treatment 1 = full dose at sowing, Treatment 2 = half at sowing and a half at mid-tillering, and Treatment 3; = 1/4 at sowing, 1/2 at mid-tillering, and 1/4 at anthesis) affected the yield, physiological, and agro-physiological efficiency of various malt barley varieties during the main cropping season of 2022 and 2023 was the primary objective of this study. With an acceptable range of quality criteria (thousand seed weight of 35-45 g and hectoliter weight of 48-62 kg ha⁻1), the yield increased significantly from 2889.00 to 6611.10 kg ha⁻1. The IBONE174/03 variety had an appropriate amount of thousand-grain weight (49.82 g) compared to the EH1847 variety. Malt brewers are encouraged to adopt the IBONE 174/03 variety to suit their needs because it provides an ideal grain yield, a tolerable thousand-grain weight, and an acceptable hector litter weight. Optimizing malt quality, productivity, and physiological and agro-physiological efficiency requires using a 110 kg ha-1 N rate and one fourth at sowing, half at mid-tillering, and one fourth at anthesis application time.},
     year = {2026}
    }
    

    Copy | Download

  • TY  - JOUR
    T1  - Grain Quality, Yield, and Physiological Efficiency of Malt Barley Varieties Under Diverse Nitrogen Amounts and Split - Utilization Timings in Ethiopia’s Central Highlands
    AU  - Mitiku Ashenafi
    AU  - Endale Lemma
    AU  - Wondwosen Tena
    Y1  - 2026/07/08
    PY  - 2026
    N1  - https://doi.org/10.11648/j.sd.20261404.22
    DO  - 10.11648/j.sd.20261404.22
    T2  - Science Discovery
    JF  - Science Discovery
    JO  - Science Discovery
    SP  - 261
    EP  - 271
    PB  - Science Publishing Group
    SN  - 2331-0650
    UR  - https://doi.org/10.11648/j.sd.20261404.22
    AB  - Under optimum Nitrogen (N) fertilizer rate with best-split application time is an abiotic menace resulting in massive yield losses to global food security and malt barley and other major staple crops' quality. To harvest the highest grain yield with good quality, the optimal N-rate must coincide with the ideal split application timing, and variety is essential. Finding out how nitrogen application rates (50, 70, 90, and 110 kg ha-1) and split timing (Treatment 1 = full dose at sowing, Treatment 2 = half at sowing and a half at mid-tillering, and Treatment 3; = 1/4 at sowing, 1/2 at mid-tillering, and 1/4 at anthesis) affected the yield, physiological, and agro-physiological efficiency of various malt barley varieties during the main cropping season of 2022 and 2023 was the primary objective of this study. With an acceptable range of quality criteria (thousand seed weight of 35-45 g and hectoliter weight of 48-62 kg ha⁻1), the yield increased significantly from 2889.00 to 6611.10 kg ha⁻1. The IBONE174/03 variety had an appropriate amount of thousand-grain weight (49.82 g) compared to the EH1847 variety. Malt brewers are encouraged to adopt the IBONE 174/03 variety to suit their needs because it provides an ideal grain yield, a tolerable thousand-grain weight, and an acceptable hector litter weight. Optimizing malt quality, productivity, and physiological and agro-physiological efficiency requires using a 110 kg ha-1 N rate and one fourth at sowing, half at mid-tillering, and one fourth at anthesis application time.
    VL  - 14
    IS  - 4
    ER  - 

    Copy | Download

Author Information
  • Abstract
  • Keywords
  • Document Sections

    1. 1. Introduction
    2. 2. Experimental Methodology
    3. 3. Result and Discussion
    4. 4. Summary and Conclusions
    Show Full Outline
  • Abbreviations
  • Acknowledgments
  • Author Contributions
  • Conflicts of Interest
  • References
  • Cite This Article
  • Author Information