Abstract
This study examines the distributional behavior of Nigeria’s Gross Domestic Product (GDP) using the Generalized Inverted Exponential Distribution (GIED) as a flexible parametric framework for modeling macroeconomic data. GDP series in developing economies are often characterized by skewness and departures from normality, which limits the adequacy of conventional distributions such as the Log-Normal and Pareto models in capturing their empirical properties. This motivates the use of more flexible alternatives for improved distributional modeling. The analysis is based on Nigeria’s GDP data spanning 1981–2022. Model parameters are estimated using Maximum Likelihood Estimation (MLE), while model adequacy is evaluated through log-likelihood values, Akaike Information Criterion (AIC), Bayesian Information Criterion (BIC), Kolmogorov–Smirnov (K–S) statistics, and graphical diagnostic tools. The results indicate that the GIED provides a superior overall fit compared to the competing distributions, as reflected in lower information criteria values and improved goodness-of-fit statistics, highlighting its flexibility in capturing skewed and asymmetric features of GDP data. In addition, a simple linear time-trend regression model is employed to assess the temporal evolution of GDP. The estimated time coefficient is positive and statistically significant, and its stability is confirmed through bootstrap resampling and Bayesian robustness checks, indicating consistency across estimation approaches. Overall, the findings suggest that the GIED is a suitable and flexible distribution for modeling GDP in contexts characterized by non-normality, while the regression results provide complementary evidence of a sustained upward trend in Nigeria’s GDP over the study period. This supports the usefulness of combining distributional and regression approaches in macroeconomic data analysis.
Keywords
Nigeria, Gross Domestic Product, Generalized Inverted Exponential Distribution, Maximum Likelihood Estimate,
Probability Density Function
1. Introduction
Gross Domestic Product (GDP) is a central indicator of economic performance, measuring the total monetary value of goods and services produced within a country over a given period
| [15] | Ibeh, C., & Mbegbu, C. (2024). Weibull-Generalized Inverted Exponential Log-Logistic Distribution: A flexible model for reliability data. Nigerian Journal of Statistics and Applications, 18(3), 133–149. |
[15]
. It underpins economic planning, policy formulation, and investment decisions worldwide
. Beyond its economic significance, understanding the statistical properties of GDP is essential for reliable economic analysis, particularly in developing economies where volatility and structural instability are prevalent.
Empirical GDP data in developing economies often exhibit pronounced right-skewness, distributional asymmetry, and irregular fluctuations driven by external shocks and policy changes. In countries such as Nigeria, exposure to global commodity markets and macroeconomic policy shifts further amplifies these distributional irregularities
| [5] | Bashar, O. M. N., Aliyu, S. U., & Sanni, M. (2023). On the behavior of Nigeria’s macroeconomic variables: A heavy-tailed modeling perspective. Nigerian Journal of Economic Modeling, 6(2), 122–135. |
[5]
. Such characteristics violate the assumptions of symmetry and thin tails underlying many conventional statistical models.
Traditional distributions, including the Normal and Log-normal, are commonly applied to GDP modelling but are often inadequate for capturing substantial asymmetry and non-normal behavior.
| [9] | Elaziz, M. A., Elgarhy, M., & Abd Elfattah, A. M. (2022). Discrete generalized inverted exponential distribution for color image segmentation. Applied Mathematics and Computation, 420, 126897. |
[9]
. As a result, these models may underestimate downside risks or overstate growth potential, leading to misleading economic inferences
| [7] | Charles, A., Dufrénot, G., & Nguena, C. (2018). Modeling GDP growth volatility in African countries. Journal of African Economies, 27(4), 397–423. |
[7]
. Although heavy-tailed alternatives such as the Student’s
t distribution and the Generalized Pareto Distribution (GPD) improve tail modelling, they suffer from key limitations; the Student’s
t distribution lacks a hazard-based interpretation, while the GPD focuses solely on tail behavior and depends on subjective threshold selection.
The Generalized Inverted Exponential Distribution (GIED) offers a flexible and theoretically coherent alternative that aligns closely with the empirical properties of GDP data. It accommodates strong skewness and flexible distributional behaviour, making it suitable for modeling asymmetric macroeconomic data. Moreover, the GIED admits closed-form density, survival, and hazard functions, enabling efficient likelihood-based and Bayesian inference across the entire distribution.
Accordingly, this study provides one of the first empirical investigations into the suitability of the Generalized Inverted Exponential Distribution for modelling GDP data. By offering a theoretically grounded application of a flexible parametric distribution to macroeconomic data, the study contributes new empirical evidence to the literature on GDP distributional modelling.
The study tests the following hypotheses:
1) H01: The Generalized Inverted Exponential Distribution (GIED) does not provide a significantly better fit to Nigeria’s GDP data than the Log-Normal and Pareto distributions.
2) H11: The Generalized Inverted Exponential Distribution (GIED) provides a significantly better fit to Nigeria’s GDP data than the Log-Normal and Pareto distributions.
3) H02: Time does not have a statistically significant effect on Nigeria’s GDP.
4) H12: Time has a statistically significant effect on Nigeria’s GDP.
2. Literature Review
The Generalized Inverted Exponential Distribution (GIED) has received some attention in the statistical modeling literature in recent years. Owing to its structural flexibility, it may be used to represent different types of failure rate behavior, which suggests potential applicability in reliability studies, survival data analysis, and lifetime data modeling.
A hybrid inferential approach that involved Maximum Likelihood Estimation (MLE) and Bayesian estimation was applied to estimate the Generalized Inverted Exponential Distribution under the adaptive Type-I progressive hybrid censoring scheme
| [29] | Zhang, Y., Wei, X., & Sun, Z. (2024). Inference on GIED under constant stress partially accelerated life testing. Journal of Applied Probability and Statistics, 19(1), 88–104. |
[29]
. The authors also incorporated competing risks, a common issue in survival data where several causes can lead to failure. MLE was used as the likelihood function, in terms of the specific-tensor model, while parameter estimation was carried out by using a numerical optimization algorithm. At the same time, a Bayesian method via posterior simulations and prior distributions was used to obtain more reliable interval estimates. Their strategy aims for inferential precision in complex censoring situations but does not include model comparison with other distributions.
The performance of GIED was illustrated using Maximum Likelihood Estimation (MLE) and least squares estimation (LSE) on simulated and sparse real data
| [1] | Abouammoh, A. M., & Alshingiti, A. S. (2009). A generalized inverted exponential distribution and its applications. Journal of Statistical Theory and Applications, 8(3), 341–351. |
[1]
. Their paper lacked extensive validation on diverse empirical datasets and investigation of robustness to model misspecification, though. In another related article, a modified GIED with improved flexibility for fitting varying hazard rates was proposed
| [2] | Abouammoh, A. M., & Alshangiti, A. S. (2019). Modified generalized inverted exponential distribution: Properties and applications. Journal of Statistical Theory and Applications, 18(4), 561–578. |
[2]
. But the absence of a comparative examination with other current models considerably limited the broader usefulness of their results.
A new generalization of the inverted exponential distribution was proposed with improved fits in simulated and some real scenarios
| [3] | Ahad, M. A., & Ahmad, M. (2024). Sine, Monotonic, and Power Inverted Exponential Distribution: Properties and Applications. Journal of Statistical Distributions and Applications, 11(1), 1–15. |
[3]
. However, they did not address computational efficiency or apply their model to a range of real data across engineering or biomedical applications. An extended generalized exponential distribution was suggested by introducing an extra parameter to capture skewness and heavy tails, similar to the GIED philosophy and showed its significant performance on life data deriving analytical properties and used MLE for parameter estimation, but without conducting robustness tests or comparing it with other models
| [12] | Hasaballah, A., Ramadan, M., & Ahmed, T. (2024). Statistical inference of generalized inverted exponential distribution under hybrid censoring schemes. Communications in Statistics - Simulation and Computation, 53(2), 395–412. |
[12]
.
In a novel application, a discrete form of the GIED was applied to color image segmentation employing a likelihood-based estimation strategy by fitting the discrete GIED model to pixel intensity data and evaluated segmentation performance using cluster quality indices
| [13] | Hasan, M. T., Khan, A., & Sattar, A. (2024). Estimation of parameters of GIED based on progressive Type-I interval censoring. Pakistan Journal of Statistics and Operation Research, 20(1), 45–60. |
[13]
. This methodology stands out for expanding GIED applications to digital imaging; while this was a significant extension of the applicability of GIED beyond reliability theory, the model's performance on various kinds of images and in real-time setups was yet to be investigated. GIED inference under progressive Type-I interval censoring via simulations was considered
| [19] | Njeri, L., & Njenga, S. (2021). Estimation of GIED parameters under Type II progressively censored schemes. African Journal of Statistics, 9(2), 88–102. |
[19]
. Their methods, however, were not applied to real censored datasets and were not compared to non-parametric alternatives.
Ranked Set Sampling (RSS) was applied to address multicomponent stress-strength reliability issues, thereby improving the precision of parameter estimations in GIED
| [20] | Panahi, R. (2022). Estimation methods for GIED under progressively hybrid censoring. Iranian Journal of Statistical Sciences, 13(4), 302–319. |
[20]
. No empirical validation of the model against large or industry-specific datasets existed, despite its methodological robustness. A Weibull-generalized GIED was proposed and emphasized its flexibility, but the study lacked applications under different stress models or in actual industrial reliability settings
| [21] | Prakash, R. (2022). Bayesian prediction under optimal SS-PALT using GIED. Journal of Statistical Theory and Practice, 16(1), 64–78. |
[21]
.
A Poisson-GIED model that could deal with over-dispersed count data efficiently was proposed
| [22] | Salem, M. A., Abdel-Baset, M., & Hassan, S. (2023). Analysis of GIED under adaptive Type-I progressive hybrid censored competing risks data. Journal of Statistical Research, 57(1), 97–112. |
[22]
. While promising, the model was not tested on longitudinal or real-time surveillance data, including those in health monitoring systems. GIED was used in a comprehensive hybrid censoring setup for the analysis of COVID-19 data, using MLE and Bayesian inference, accounting for uncertainty via posterior intervals
| [18] | Mahmoud, M. A., Hussein, M., & El-Barry, E. (2018). A new flexible inverted exponential distribution: Properties and estimation. Journal of Applied Mathematics and Physics, 6(12), 2460–2479. |
[18]
. The censoring model integrates features of Type-I and Type-II censoring, providing flexibility in real-world medical follow-ups. Their findings were statistically sound, the application nonetheless remaining confined to pandemic scenarios, without extensions to general epidemiological datasets.
The Expectation-Maximization algorithm was used for parameter estimation of GIED based on progressively censored data
| [26] | Wijekularathna, D. (2024). Generalized variables method for GIED under censoring. Journal of Statistical Theory and Practice, 18(2), 128–142. |
[26]
. EM algorithm addressed the incomplete data problem by iteratively computing the expected log-likelihood and updating parameter estimates. The study did not cover Bayesian or hybrid estimation models, particularly at an intense level of censoring. A comparative evaluation of estimation methods under progressively hybrid censoring (including MLE and Bayesian methods) for the GIED was conducted
. Simulation studies assessed the bias, variance, and MSE of the estimators across varying censoring intensities, but without extensive performance comparison on different levels of censoring and sample sizes.
Bayesian predictive inference in a two-sample stress-strength reliability test (SS-PALT) under the Generalized Inverted Exponential Distribution (GIED) framework was investigated
| [28] | Zhang, H., Liu, Y., & Jin, M. (2023). Order-restricted inference for GIED under joint progressive censoring. Journal of Reliability and Statistical Studies, 15(3), 265–280. |
[28]
. The methodology involved specifying prior distributions for model parameters and deriving posterior predictive distributions to optimize reliability decisions. However, this theoretical development wasn't applied under real product testing conditions. Dependent competing risks data were modeled using a bivariate exponentiated Generalized Inverted Exponential Distribution (GIED), and its effectiveness was demonstrated using both Maximum Likelihood Estimation (MLE) and Bayesian methods, with the joint survival behavior modeled through copula-like structures, although the computational expense and model complexity were not considered
.
The Lindley-Generalized Inverted Exponential Distribution (Lindley-GIED) was introduced and shown to provide improved fit for certain real-life data sets. Maximum Likelihood Estimation (MLE) was employed for parameter estimation, and the model was compared with standard distributions using goodness-of-fit criteria such as AIC and BIC. Although the approach improved data fitting performance, it did not consider complex censoring schemes or diverse industrial applications
. Interval estimation for record data within the framework of the Generalized Inverted Exponential Distribution (GIED) was proposed using analytical techniques to derive asymptotic confidence intervals
. Although theoretically rigorous, the authors did not compare their results with bootstrap or Bayesian credible intervals, which are often more practical in small samples or skewed data.
A generalized variables method was employed for the Generalized Inverted Exponential Distribution (GIED) under censored data conditions, yielding reliable results. The approach allows for the estimation of confidence regions without relying on normality assumptions
. It was effective under moderate censoring but lacked analysis of outlier robustness and distributional misspecification. Order-restricted inference for the Generalized Inverted Exponential Distribution (GIED) was employed under balanced joint progressive Type-II censoring and applied to jute fiber strength data
. The method focused on incorporating known ordering among groups in parameter estimation. Although innovative, it was not tested on multi-type materials or unbalanced censoring structures.
Finally, The Generalized Inverted Exponential Distribution (GIED) was applied to scenarios involving ever-present stress, specifically partially accelerated life testing, where its inferential properties were demonstrated
. However, the study did not consider more complex stress patterns, such as dynamic or time-varying stresses that are typically found in real-world testing settings.
In contrast, macroeconomic and financial econometrics extensively employ duration and hazard-based models to study unemployment spells, firm survival, transaction durations, and credit default. Foundational works in the literature highlight the importance of flexible hazard structures in economic modeling
| [14] | Hassan, R., & Nagy, M. (2021). Reliability estimation of multicomponent stress-strength model under GIED using ranked set sampling. Journal of Statistical Computation and Simulation, 91(2), 215–230. |
| [24] | Sah Telee, J., & Kumar, M. (2021). Lindley generalized inverted exponential distribution: Properties and real data applications. Journal of Statistical Distributions and Applications, 8(1), 25–39. |
[14, 24]
. Despite similarities in data characteristics, such as censoring, asymmetry, and time-varying risk, GIED has rarely been applied in macroeconomic settings, where Pareto, Log-Normal, Weibull, log-logistic, and semi-parametric Cox-type models dominate.
Overall, despite extensive methodological development, GIED’s application remains concentrated in reliability studies, with minimal integration into macroeconomic and financial duration modeling. This gap motivates the present study, which reviews GIED as a flexible and computationally tractable alternative for modeling economic event durations subject to censoring, asymmetry, and evolving hazard dynamics.
3. Data Presentation
This study utilizes secondary data on GDP for the period of 1981-2022. It is an official economic report from the Central Bank of Nigeria.
| [8] | Eghwerido, A. O., Adeyemi, O. S., & Uche, U. (2019). On the extended new generalized exponential distribution: Properties and applications. Journal of Applied Statistics and Econometrics, 14(1), 45–60. |
[8]
(See Appendix)
3.1. Model Estimation and Implementation
All analyses were conducted in R, with parameter estimation carried out via log-likelihood maximization and convergence assessed using standard tolerance-based criteria.
3.2. Generalized Inverted Exponential (GIE) distribution
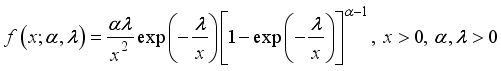
The Generalized Inverted Exponential (GIE) distribution is a continuous probability model commonly used in reliability engineering. The probability density function (PDF) of the GIE distribution was introduced by Mahmoud et al.
| [25] | Wang, L., Zhou, T., & Yu, W. (2022). Interval estimation of GIED parameters from record values. Communications in Statistics - Theory and Methods, 51(3), 745–765. |
[25]
and is defined as:
Where

is the scale parameter, and

is the shape parameter, which determines the heaviness of the tail.
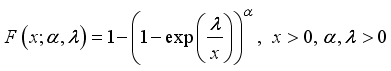
The corresponding cumulative distribution function (CDF) is given by:
These functions describe the probability distribution of a variable that follows the GIE distribution, which is useful in reliability analysis and survival studies due to its flexibility in modeling failure rates.
3.3. Some Useful Properties of Generalized Inverted Exponential Distribution
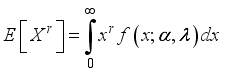
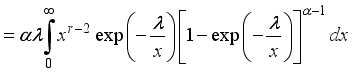
3.3.1. The rth Moment
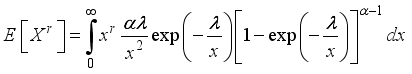
The rth moment of a random variable X following the Generalized Inverted Exponential distribution is given by:
Substituting for

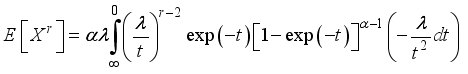
in the above expression for rth moment gives
By transformation techniques, let
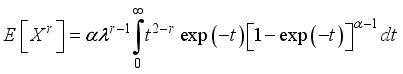
. Rewriting the integral:
Let
.

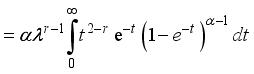
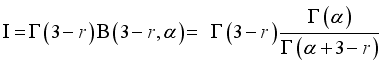
can be expressed in terms of the Beta function and the Gamma function. Thus,
Where
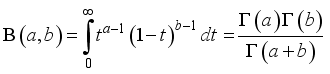
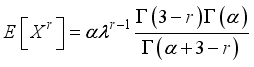
is a beta function. Thus, the rth moment of the generalized inverted exponential distribution is
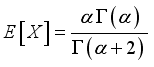
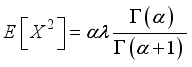
The first-four crude moments are obtained by substituting for

in

. Consequently, we have the following:
3.3.2. Quantile Function and Distribution of Order Statistics: The Quantile Function or Inverted Cumulative Distribution Function is Given by
Where

is the cumulative distribution function of the generalized inverted exponential distribution. To find the quantile function

, set
Taking the

root on both sides gives
Taking the natural logarithm on both sides:
Solving for x, we obtained:
This function allows for the generation of random samples from the GIE distribution using the inverse transform sampling method. The range of quantile function lies between 0 and 1.
Also, let
be a random sample of size

from a generalized inverted exponential distribution with PDF

and CDF

. The order statistics are denoted by:
Where

is the

order statistics representing the

smallest value in the sample. The general model for the PDF of the

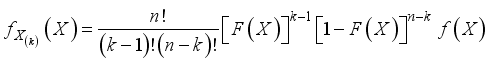
order statistics is given by:
Where:

is the CDF of the GIE distribution,

is the PDF of the GIE distribution,

is the sample size and

is the rank of the order statistics. Substituting for the PDF and CDF, we have:
Simplifying further, we obtain the PDF of the k-th order statistics as
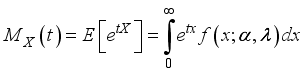
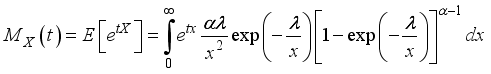
3.3.3. Moment Generating Function
The moment generating function of a random variable

is defined as:
Where

is the PDF of the GIE distribution. Substituting, we have
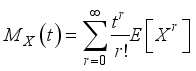
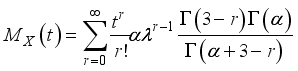
Recall that an alternative approach to approximating the MGF is by using the Taylor series expansion. Thus
Where

is the rth moment of GIE distribution. Consequently, we obtain
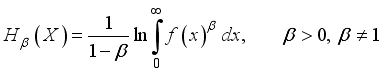
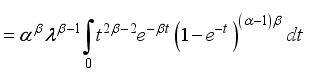
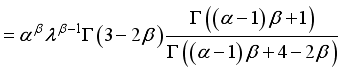
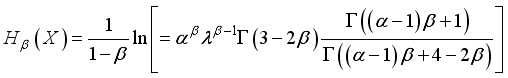
3.3.4. Renyi Entropy
The Renyi entropy of order

for a probability distribution with PDF

is defined as:
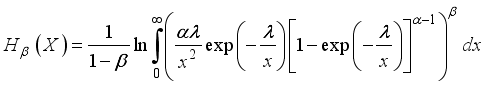
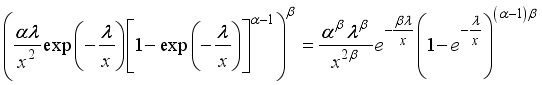
For the generalized inverted exponential distribution with PDF given above, the entropy is derived as follows
Where:
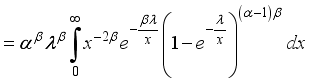
, rewriting the integral gives:
This integral function has a standard form related to the Beta-Gamma function. Thus, we have
Consequently, the Renyi entropy of generalized inverted exponential distribution becomes:
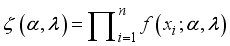
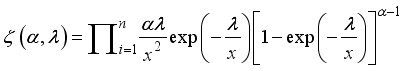
3.3.5. Estimation
Given a random sample
from generalized inverted exponential distribution with shape parameter

and scale parameter

, with PDF given above, the likelihood function for a sample size

is the product of individual PDFs:
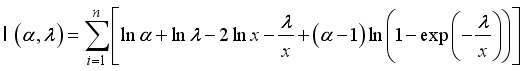
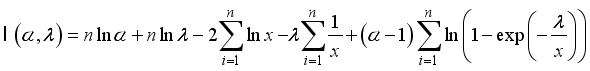
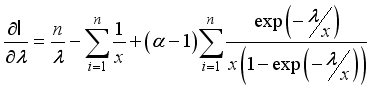
Taking the log-likelihood function,

:
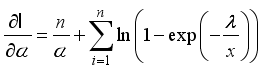
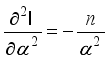
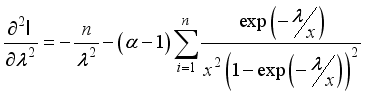
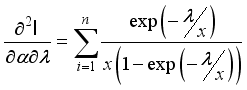
In order to derive the Information Matrix, the first and second derivative of the likelihood function

is needed, thus:
Also, the second order partial derivative is computed, consequently we have
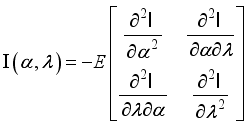
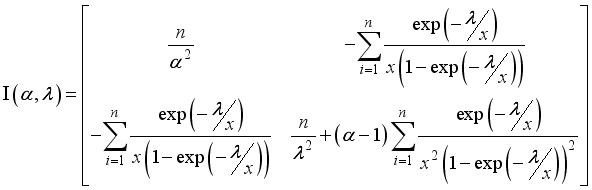
The expected Fisher Information Matrix is given by:
Approximating the expectations gives:
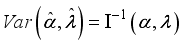
The inverse of the Fisher Information Matrix provides the asymptotic variance covariance matrix for

:
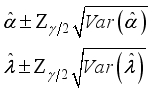
The asymptotic normality property of MLEs allows us to construct confidence intervals using:
Where

is the standard normal quantile for the 95% confidence level which is equal to 1.96
These results provide a basis for statistical inference, allowing estimation of uncertainty in the MLEs of the GIE distribution parameters.
4. Analysis and Discussion of Results
4.1. Graph of PDF and CDF of GIE Distribution
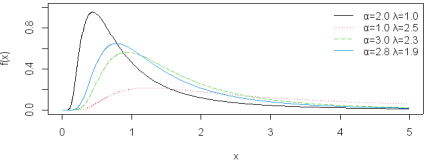
Figure 1. Pdf of GIE distribution.
The PDF plots shown in
Figure 1 reveal different parameter combinations of the shape of the distribution changes. From the graph, higher values of

leads to a sharper peak while smaller values of

stretch the distribution, making it right skewed. The distribution exhibits right-skewness and accommodates upper-tail observations more flexibly than symmetric distributions.
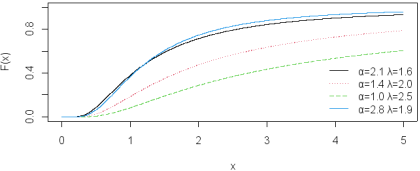
Figure 2. CDF of GIE distribution.
Examining the graph of the CDF in
Figure 2, higher values of

lead to a steeper increase, meaning the probability mass is more concentrated around lower values of

. Also, when

increases, the distribution shifts to the right, meaning larger values of x accumulate probability more gradually.
Table 1. Shows the descriptive statistics of the GDP data. The average mean of the data is 38590 with a higher variance of 434898838. The skewness value of 0.527287 indicates moderate right-skewness, while the kurtosis value of 1.639 indicates a platykurtic distribution with lighter tails than the normal distribution.
Table 1. Descriptive Statistics.
mean | Variance | SD | Min | Max | IQR | Skewness | Kurtosis |
38590 | 434898838 | 20854 | 16048.3 | 74639.5 | 37755.4 | 0.527287 | 1.6398 |
4.2. Numerical Applications of Generalized Inverted Exponential Distribution
Table 2 presents a statistical comparison of the GIED, Pareto distribution, and Log-Normal (LN) distribution based on their goodness of fit measures. The goal is to determine which distribution best models the gross domestic product (GDP) dataset.
Table 2. LL, AIC, BIC, K-S and p-Values of the Fitted Distribution of Data Set.
Model | Estimate | LL | AIC | BIC | K-S | p |
Pareto | xm = 497.92 | -540.3 | 1083.72 | 1087.2 | 0.5654 | 3.32E-13 |
a = 0.2399 |
GIE | a = 4.7856 | -471 | 945.34 | 948.82 | 0.176 | 0.1303 |
λ = 65401.04 |
LND | a = 10.417 | -471 | 1001.82 | 1005.3 | 0.4996 | 3.24E-10 |
b = 0.5354 | | | |
The log-likelihood (LL), as seen in
Table 2, measures model fit, where higher values indicate improved fit; however, it should be interpreted jointly with penalized criteria such as AIC and BIC for model selection. The LL of GIE is -471, which is higher than the Pareto distribution (-540.3) but similar to the LN distribution (-471). The Akaike Information Criterion (AIC) evaluates model quality by balancing fit and complexity. Lower values indicate a better model. The GIE distribution with AIC = 945.34 outperforms the Pareto distribution (AIC = 1083.72) and the LN distribution (AIC = 1001.82). The Bayesian Information Criterion (BIC) is similar to AIC but penalizes complexity more. Also, lower values of BIC indicate a better fit. The GIE distribution (BIC = 948.82) is better than Pareto (BIC = 1087.2) and LN (BIC = 1005.3). The Kolmogorov-Smirnov Statistic (KS) measures the maximum deviation between empirical and theoretical CDFs. The GIED produced the smallest KS statistic (0.176) and the largest associated p-value (0.1303) among the competing models, indicating closer agreement with the empirical distribution. The p-value tests whether the data follows the specified distribution. The K-S p-value for the GIE distribution is 0.1303, which exceeds the 0.05 significance level. This indicates that the null hypothesis of a good fit cannot be rejected at the 5% level. This suggests that the GIE distribution is not rejected by the KS test at the 5% level, unlike the competing models of the Pareto
and the LND
. Overall, the GIED demonstrates better performance across the selected goodness-of-fit criteria compared to the Pareto and Log-Normal distributions. The higher K–S p-values indicate better agreement between the empirical and theoretical distributions, as they provide weaker evidence against the fitted model.
4.3. Density Plot of the GIE Distribution
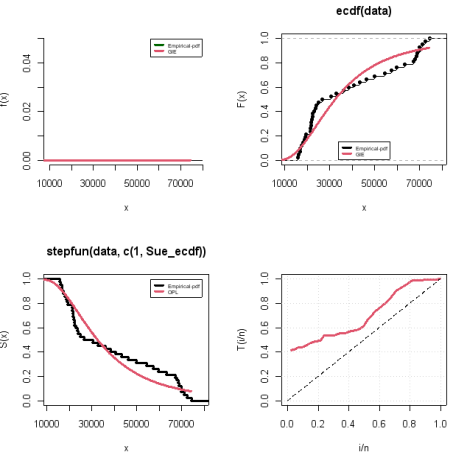
Figure 3 consists of four different graphs that compare the GIE distribution with empirical data using different statistical functions. In the top-left graph (PDF), the empirical PDF appears almost flat, suggesting a low probability density across the range. The GIE PDF follows the same trend but remains low, implying that the fitted GIE model assigns low density to most values. For the top-right graph, the Empirical Cumulative Distribution Function (ECDF), the ECDF rises steeply at lower values, indicating that a large proportion of the data falls within the lower range. The survival function

decreases gradually, showing that high values occur with small probability. This suggests that the GIE model reasonably approximates the tail behavior but might underestimate or overestimate in specific regions. The probability-plot (P–P) in the bottom-right graph shows the red line deviating from the 45-degree diagonal at several points, indicating that the Generalized Inverted Exponential (GIE) model does not perfectly align with the empirical distribution. Deviations are most pronounced in the extreme values, where the fitted CDF lies above or below the diagonal, suggesting that the model may underestimate the probability of very large observations. This pattern reflects the inherent limitations of the GIE in fully capturing the heaviest tails, as its shape parameter, while flexible, prioritizes global fit across the bulk of the data. Overall, the model provides a reasonable representation of the central distribution, but tail-dependent measures, such as high quantiles or extreme-risk estimates, should be interpreted with caution.
Figure 3. Density plot of the GIE distribution.
4.4. Robustness Check
Table 3 shows that the robustness check was conducted using bootstrapping to assess the stability of the regression estimates.
Table 3. Regression Coefficients and Robustness Checks for YEAR.
Method | Estimate ( | Std Error | t/- | 95% CI / Credible Interval |
OLS | 1,.572.71 | 93.03 | 16.91 | 1,382.98 – 1,762.44 |
Bootstrap | 1,572.71 | - | - | 1,385 – 1,760 |
Bayesian | 1,574 | - | - | 1,384 – 1,763 |
A linear regression of GDP on YEAR revealed a strong positive association. The regression is a simple time-trend model and does not address key time-series issues such as non-stationarity, serial correlation, or spurious regression, so it should be interpreted as a descriptive trend rather than a causal econometric relationship. The model explained 90.1% of the variance in GDP (R2 = 0.901), adjusted (R2 = 0.892), with a standard error of 6,802. ANOVA indicated that the model was statistically significant (F(1,40) = 100.28), (p < 0.001), rejecting the null hypothesis that YEAR does not affect GDP.
The estimated coefficient for YEAR was β = 1,572.71 (SE = 93.03, t = 16.91, p < 0.001; 95% CI: 1,382.98–1,762.44), and the intercept was −3,108,460.34 (SE = 186,050.79, p < 0.001), indicating a linear upward trend in GDP over the observed period.
Robustness checks using 1,000 bootstrap replications and Bayesian estimation with non-informative priors produced consistent results, confirming the stability of the YEAR coefficient (bootstrap 95% CI: 1,385–1,760; Bayesian posterior mean = 1,574, 95% credible interval: 1,384–1,763). These findings support the reliability of the regression estimates and the statistical significance of the linear relationship between YEAR and GDP.
4.5. Discussion
The GDP data exhibit a skewness of 0.527 and kurtosis of 1.6398, indicating a right-skewed, platykurtic distribution.
The GIED fitted via MLE showed improved performance relative to the Log-normal and Pareto distributions, achieving the highest log-likelihood (LL = –471), lowest AIC (945.34) and BIC (948.82), and highest KS p-value (0.1303) compared to LND (AIC = 1001.82, BIC = 1005.3; KS p = 3.24 x 10⁻¹⁰) and Pareto (AIC = 1083.72, BIC = 1087.2; KS p = 3.32 x 10⁻¹³).
Graphical diagnostics (PDF, CDF, P–P plot, survival function) confirm that GIED captures skewness and upper-tail observations well; however, minor convex deviations in the extreme upper tail, where cumulative probabilities are underestimated by 3–5%, reflect the influence of the estimated shape parameter, which optimizes overall fit at the cost of fully accommodating the heaviest extremes. These results demonstrate strong global fit while highlighting that tail-dependent inferences should consider the slight underestimation inherent in the fitted shape parameter.
5. Conclusion
This study examines the distributional properties of Nigeria’s Gross Domestic Product (GDP) by presenting a novel empirical application of the Generalized Inverted Exponential Distribution (GIED) as a parametric framework for modeling economic growth. Macroeconomic aggregates in developing economies frequently exhibit skewness and departures from normality, violating the distributional assumptions underlying standard econometric specifications. The primary objective is to assess whether Nigeria’s GDP exhibits distributional asymmetry that can be effectively modeled using the GIED rather than the conventional parametric alternatives.
Model parameters are estimated using Maximum Likelihood Estimation (MLE), and comparative performance is evaluated against the Log-Normal and Pareto distributions using likelihood-based information criteria (AIC and BIC), the Kolmogorov–Smirnov statistic, associated p-values, and graphical diagnostics. The results indicate that Nigeria’s GDP distribution is positively skewed and departs from normality, and that the GIED consistently outperformed competing models across the selected goodness-of-fit criteria. These findings support the suitability of the GIED for distribution-sensitive econometric analysis and robust in-sample modeling of macroeconomic distributional behaviour.
The findings have practical implications for macroeconomic forecasting, volatility characterization, and economic risk modeling in developing economies where GDP series often deviate from normality assumptions. By providing a more flexible distributional framework, the GIED may support improved policy analysis, economic planning, and model-based decision-making under uncertainty.
A limitation of the study is that the analysis is based on GDP levels rather than transformed or differenced series. Future research may extend the framework to logarithmic GDP, GDP growth rates, or other stationary transformations to account for time-series characteristics commonly observed in macroeconomic data.
By extending a distribution commonly applied in reliability and survival analysis to a macroeconomic setting, this study contributes to the econometric literature on flexible distributional modeling of economic aggregates and provides a robust statistical framework for analyzing GDP dynamics in developing economies.
Abbreviation
AIC | Akaike Information Criterion |
BIC | Bayesian Information Criterion |
CDF | Cumulative Density Function |
CBN | Central Bank of Nigeria |
ECDF | Empirical Cumulative Distribution Function |
GDP | Gross Domestic Product |
GIED | Generalized Inverted Exponential Distribution |
K-S | Kolmogorov-Smirnov |
LL | Log Likelihood |
LND | Log-Normal Distribution |
NBS | Nigeria Bureau of Statistics |
PDF | Probability Density Function |
Author Contributions
Chinedu Kingsley Nwankwo: Conceptualization, Data curation, Formal Analysis, Methodology, Supervision, Resources, Validation, Writing – original draft, Writing – review & editing
Dongnaan Godswill Apameh: Data curation, Methodology, Resources, Visualization
Funding
This work is not supported by any external funding.
Conflicts of Interest
The authors declare there is no existing conflict of interest.
Appendix
Table 4. Presentation of Nigeria GDP dataset from 1981 to 2022. Presentation of Nigeria GDP dataset from 1981 to 2022. Presentation of Nigeria GDP dataset from 1981 to 2022.
Year | GDP | Year | GDP |
1981 | 19,549.56 | 2020 | 70,014.37 |
1982 | 18,219.27 | 2021 | 72,393.67 |
1983 | 16,228.81 | 2022 | 74,639.47 |
1984 | 16,048.31 | | |
1985 | 16,997.52 | | |
1986 | 17,007.77 | | |
1987 | 17,552.10 | | |
1988 | 18,839.55 | | |
1989 | 19,201.16 | | |
1990 | 21,462.73 | | |
1991 | 21,539.61 | | |
1992 | 22,537.10 | | |
1993 | 22,078.07 | | |
1994 | 21,676.85 | | |
1995 | 21,660.49 | | |
1996 | 22,568.87 | | |
1997 | 23,231.12 | | |
1998 | 23,829.76 | | |
1999 | 23,967.59 | | |
2000 | 25,169.54 | | |
2001 | 26,658.62 | | |
2002 | 30,745.19 | | |
2003 | 33,004.80 | | |
2004 | 36,057.74 | | |
2005 | 38,378.80 | | |
2006 | 40,703.68 | | |
2007 | 43,385.88 | | |
2008 | 46,320.01 | | |
2009 | 50,042.36 | | |
2010 | 54,612.26 | | |
2011 | 57,511.04 | | |
2012 | 59,929.89 | | |
2013 | 63,218.72 | | |
2014 | 67,152.79 | | |
2015 | 69,023.93 | | |
2016 | 67,931.24 | | |
2017 | 68,490.98 | | |
2018 | 69,799.94 | | |
2019 | 71,387.83 | | |
Source: Central Bank of Nigeria Economic Report, 2024
References
| [1] |
Abouammoh, A. M., & Alshingiti, A. S. (2009). A generalized inverted exponential distribution and its applications. Journal of Statistical Theory and Applications, 8(3), 341–351.
|
| [2] |
Abouammoh, A. M., & Alshangiti, A. S. (2019). Modified generalized inverted exponential distribution: Properties and applications. Journal of Statistical Theory and Applications, 18(4), 561–578.
|
| [3] |
Ahad, M. A., & Ahmad, M. (2024). Sine, Monotonic, and Power Inverted Exponential Distribution: Properties and Applications. Journal of Statistical Distributions and Applications, 11(1), 1–15.
|
| [4] |
Akpan, U. F., & Atan, J. A. (2013). Effect of exchange rate volatility on the Nigerian economy: An empirical investigation. International Journal of Economics and Finance, 5(8), 134–142.
|
| [5] |
Bashar, O. M. N., Aliyu, S. U., & Sanni, M. (2023). On the behavior of Nigeria’s macroeconomic variables: A heavy-tailed modeling perspective. Nigerian Journal of Economic Modeling, 6(2), 122–135.
|
| [6] |
Central Bank of Nigeria. (2024). Statistical bulletin: Domestic production, consumption and prices (October 2, 2024). Abuja: Central Bank of Nigeria.
|
| [7] |
Charles, A., Dufrénot, G., & Nguena, C. (2018). Modeling GDP growth volatility in African countries. Journal of African Economies, 27(4), 397–423.
|
| [8] |
Eghwerido, A. O., Adeyemi, O. S., & Uche, U. (2019). On the extended new generalized exponential distribution: Properties and applications. Journal of Applied Statistics and Econometrics, 14(1), 45–60.
|
| [9] |
Elaziz, M. A., Elgarhy, M., & Abd Elfattah, A. M. (2022). Discrete generalized inverted exponential distribution for color image segmentation. Applied Mathematics and Computation, 420, 126897.
|
| [10] |
Engle, R. F., & Russell, J. R. (1998). Autoregressive conditional duration: A new model for irregularly spaced transaction data. Econometrica, 66(5), 1127–1162.
|
| [11] |
Fraumeni, B. M. (2022). Measuring the economy: A primer on GDP and national income accounting. Review of Income and Wealth, 68(1), 1–15.
|
| [12] |
Hasaballah, A., Ramadan, M., & Ahmed, T. (2024). Statistical inference of generalized inverted exponential distribution under hybrid censoring schemes. Communications in Statistics - Simulation and Computation, 53(2), 395–412.
|
| [13] |
Hasan, M. T., Khan, A., & Sattar, A. (2024). Estimation of parameters of GIED based on progressive Type-I interval censoring. Pakistan Journal of Statistics and Operation Research, 20(1), 45–60.
|
| [14] |
Hassan, R., & Nagy, M. (2021). Reliability estimation of multicomponent stress-strength model under GIED using ranked set sampling. Journal of Statistical Computation and Simulation, 91(2), 215–230.
|
| [15] |
Ibeh, C., & Mbegbu, C. (2024). Weibull-Generalized Inverted Exponential Log-Logistic Distribution: A flexible model for reliability data. Nigerian Journal of Statistics and Applications, 18(3), 133–149.
|
| [16] |
Joshi, S., Dhungana, R., & Tharu, R. (2021). Poisson generalized inverted exponential distribution and its applications. Statistics and Applications, 19(2), 137–155.
|
| [17] |
Lancaster, T. (1990). The econometric analysis of transition data. Cambridge: Cambridge University Press.
|
| [18] |
Mahmoud, M. A., Hussein, M., & El-Barry, E. (2018). A new flexible inverted exponential distribution: Properties and estimation. Journal of Applied Mathematics and Physics, 6(12), 2460–2479.
|
| [19] |
Njeri, L., & Njenga, S. (2021). Estimation of GIED parameters under Type II progressively censored schemes. African Journal of Statistics, 9(2), 88–102.
|
| [20] |
Panahi, R. (2022). Estimation methods for GIED under progressively hybrid censoring. Iranian Journal of Statistical Sciences, 13(4), 302–319.
|
| [21] |
Prakash, R. (2022). Bayesian prediction under optimal SS-PALT using GIED. Journal of Statistical Theory and Practice, 16(1), 64–78.
|
| [22] |
Salem, M. A., Abdel-Baset, M., & Hassan, S. (2023). Analysis of GIED under adaptive Type-I progressive hybrid censored competing risks data. Journal of Statistical Research, 57(1), 97–112.
|
| [23] |
Sarhan, A. M., Almetwally, E. M., & Jeyamkondan, S. (2024). Bivariate exponentiated GIED: Modeling dependent competing risks data. Reliability Engineering & System Safety, 235, 109117.
|
| [24] |
Sah Telee, J., & Kumar, M. (2021). Lindley generalized inverted exponential distribution: Properties and real data applications. Journal of Statistical Distributions and Applications, 8(1), 25–39.
|
| [25] |
Wang, L., Zhou, T., & Yu, W. (2022). Interval estimation of GIED parameters from record values. Communications in Statistics - Theory and Methods, 51(3), 745–765.
|
| [26] |
Wijekularathna, D. (2024). Generalized variables method for GIED under censoring. Journal of Statistical Theory and Practice, 18(2), 128–142.
|
| [27] |
World Bank. (2022). World Development Indicators. Retrieved from
https://data.worldbank.org/
|
| [28] |
Zhang, H., Liu, Y., & Jin, M. (2023). Order-restricted inference for GIED under joint progressive censoring. Journal of Reliability and Statistical Studies, 15(3), 265–280.
|
| [29] |
Zhang, Y., Wei, X., & Sun, Z. (2024). Inference on GIED under constant stress partially accelerated life testing. Journal of Applied Probability and Statistics, 19(1), 88–104.
|
Cite This Article
-
APA Style
Nwankwo, C. K., Apameh, D. G. (2026). Comparative Distributional Analysis of Nigeria's GDP Using the Generalized Inverted Exponential Distribution. Science Journal of Applied Mathematics and Statistics, 14(2), 58-70. https://doi.org/10.11648/j.sjams.20261402.12
 Copy
|
Copy
|
 Download
ACS Style
Nwankwo, C. K.; Apameh, D. G. Comparative Distributional Analysis of Nigeria's GDP Using the Generalized Inverted Exponential Distribution. Sci. J. Appl. Math. Stat. 2026, 14(2), 58-70. doi: 10.11648/j.sjams.20261402.12
Copy
|
Download
AMA Style
Nwankwo CK, Apameh DG. Comparative Distributional Analysis of Nigeria's GDP Using the Generalized Inverted Exponential Distribution. Sci J Appl Math Stat. 2026;14(2):58-70. doi: 10.11648/j.sjams.20261402.12
Copy
|
Download
-
@article{10.11648/j.sjams.20261402.12,
  author = {Chinedu Kingsley Nwankwo and Dongnaan Godswill Apameh},
  title = {Comparative Distributional Analysis of Nigeria's GDP Using the Generalized Inverted Exponential Distribution},
  journal = {Science Journal of Applied Mathematics and Statistics},
  volume = {14},
  number = {2},
  pages = {58-70},
  doi = {10.11648/j.sjams.20261402.12},
  url = {https://doi.org/10.11648/j.sjams.20261402.12},
  eprint = {https://article.sciencepublishinggroup.com/pdf/10.11648.j.sjams.20261402.12},
  abstract = {This study examines the distributional behavior of Nigeria’s Gross Domestic Product (GDP) using the Generalized Inverted Exponential Distribution (GIED) as a flexible parametric framework for modeling macroeconomic data. GDP series in developing economies are often characterized by skewness and departures from normality, which limits the adequacy of conventional distributions such as the Log-Normal and Pareto models in capturing their empirical properties. This motivates the use of more flexible alternatives for improved distributional modeling. The analysis is based on Nigeria’s GDP data spanning 1981–2022. Model parameters are estimated using Maximum Likelihood Estimation (MLE), while model adequacy is evaluated through log-likelihood values, Akaike Information Criterion (AIC), Bayesian Information Criterion (BIC), Kolmogorov–Smirnov (K–S) statistics, and graphical diagnostic tools. The results indicate that the GIED provides a superior overall fit compared to the competing distributions, as reflected in lower information criteria values and improved goodness-of-fit statistics, highlighting its flexibility in capturing skewed and asymmetric features of GDP data. In addition, a simple linear time-trend regression model is employed to assess the temporal evolution of GDP. The estimated time coefficient is positive and statistically significant, and its stability is confirmed through bootstrap resampling and Bayesian robustness checks, indicating consistency across estimation approaches. Overall, the findings suggest that the GIED is a suitable and flexible distribution for modeling GDP in contexts characterized by non-normality, while the regression results provide complementary evidence of a sustained upward trend in Nigeria’s GDP over the study period. This supports the usefulness of combining distributional and regression approaches in macroeconomic data analysis.},
 year = {2026}
}
Copy
|
Download
-
TY  - JOUR
T1  - Comparative Distributional Analysis of Nigeria's GDP Using the Generalized Inverted Exponential Distribution
AU  - Chinedu Kingsley Nwankwo
AU  - Dongnaan Godswill Apameh
Y1  - 2026/06/02
PY  - 2026
N1  - https://doi.org/10.11648/j.sjams.20261402.12
DO  - 10.11648/j.sjams.20261402.12
T2  - Science Journal of Applied Mathematics and Statistics
JF  - Science Journal of Applied Mathematics and Statistics
JO  - Science Journal of Applied Mathematics and Statistics
SP  - 58
EP  - 70
PB  - Science Publishing Group
SN  - 2376-9513
UR  - https://doi.org/10.11648/j.sjams.20261402.12
AB  - This study examines the distributional behavior of Nigeria’s Gross Domestic Product (GDP) using the Generalized Inverted Exponential Distribution (GIED) as a flexible parametric framework for modeling macroeconomic data. GDP series in developing economies are often characterized by skewness and departures from normality, which limits the adequacy of conventional distributions such as the Log-Normal and Pareto models in capturing their empirical properties. This motivates the use of more flexible alternatives for improved distributional modeling. The analysis is based on Nigeria’s GDP data spanning 1981–2022. Model parameters are estimated using Maximum Likelihood Estimation (MLE), while model adequacy is evaluated through log-likelihood values, Akaike Information Criterion (AIC), Bayesian Information Criterion (BIC), Kolmogorov–Smirnov (K–S) statistics, and graphical diagnostic tools. The results indicate that the GIED provides a superior overall fit compared to the competing distributions, as reflected in lower information criteria values and improved goodness-of-fit statistics, highlighting its flexibility in capturing skewed and asymmetric features of GDP data. In addition, a simple linear time-trend regression model is employed to assess the temporal evolution of GDP. The estimated time coefficient is positive and statistically significant, and its stability is confirmed through bootstrap resampling and Bayesian robustness checks, indicating consistency across estimation approaches. Overall, the findings suggest that the GIED is a suitable and flexible distribution for modeling GDP in contexts characterized by non-normality, while the regression results provide complementary evidence of a sustained upward trend in Nigeria’s GDP over the study period. This supports the usefulness of combining distributional and regression approaches in macroeconomic data analysis.
VL  - 14
IS  - 2
ER  -
Copy
|
Download
 ,
,  ,
,  and
and  .
.